 9-Plex
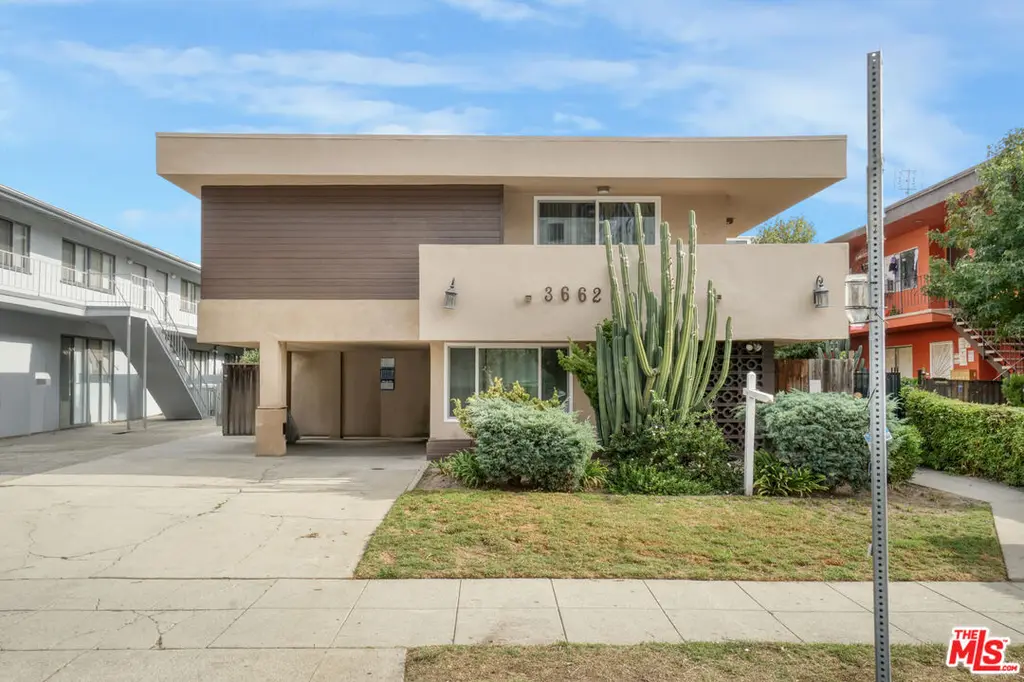
3662 Keystone Ave · Los Angeles, CA
Flood risk 1/10 · Minimal
- FEMA flood zone
- X (unshaded)
- Chance of flooding over 30 yrs
- 0.0%
- Est. flood insurance / yr
- $507 – $1,088
Fire risk 1/10 · Minimal
- Est. fire insurance / yr
- $659 – $1,223
Heat risk 6/10 · Moderate
- Hot days now (above 85°F)
- 7 days/yr
- Hot days in 30 yrs
- 21 days/yr
Wind risk 1/10 · Minimal
- Chance of severe wind over 30 yrs
- —
Air-quality risk 4/10 · Minor
- Unhealthy air days now
- 6 days/yr
- Unhealthy air days in 30 yrs
- 7 days/yr
Risk factors via First Street. Map © Google.
Why this score? — see what drove the C grade
The composite is a weighted blend of 9 inputs, each scored 0–100. Each bar is that input's sub-score; the figure is the points it added to the 100-point composite (weight × sub-score).
- Cash flow +22.6/30.0
- ARV discount +12.4/15.0
- DSCR +7.2/10.0
- 1% rule +4.5/10.0
- Schools +3.6/10.0
- Livability +3.4/5.0
- Rent growth +2.6/5.0
- Condition / age +2.5/5.0
- Appreciation +0.0/10.0
$2,500,000
🖨 Deal sheet (PDF) 📄 Offer letter ✓ Due diligence
Multi-family units
County records classify this as Multi-Family (5+ Unit). Listing-text estimate: 9 units. confirmed
5+ unit building — per-unit beds/baths from public records are typically unavailable; the breakdown below (if shown) is an estimate from the listing text.
Listing remarks MLS
MAJOR PRICE ADJUSTMENT! We are pleased to present a 9 unit offering in one of the best Palms locations at 3662 Keystone Ave, just a short distance to the new developments along Overland Blvd and short distance to downtown Culver City. The offering consists of (6) 1 Bed, 1 Bath, (1) 2 Bed, 2 Bath, (1) 2 Bed, 1.5 Bath, and (1) Studio, 1 Bath unit that is spread out over 7,512 square feet, which offers spacious unit layouts. The property was built in 1961 and sits on a 7,500 square foot lot that is zoned LAR3. The investment offering provides an excellent value-add opportunity for future investors with rents approximately 30% below market, in one of the best rental pockets of LA's Westside. The building offers 10 parking spaces and on-site laundry for for tenants. The building features a brand new roof, copper plumbing and was recently repainted. With it's excellent unit mix and future upside potential, an investor is poised to take advantage of a generational real estate asset in a prime location that has experienced tremendous growth and development. The Palms market has continued to prove to be one of the best rental pockets in all of Los Angeles. With continued rent growth and low vacancy rates, renters continue to seek out opportunities in the immediate area surrounding the subject property. With Culver City directly to the south, Venice directly west, and high end neighborhoods just to the north, Palms is strategically located to continue to see massive growth. Area amenities include high end restaurants, bars and nightlife along with shopping and a robust office market making it a perennial economic hub in Southern California. With tech companies like Amazon, Youtube and TikTok, the location and rental upside make this an opportunity to own a generational asset in one of LA's best neighborhoods.
Key facts
- 7,502 sq ft lot
- 10 parking spots
- Built 1961
Neighborhood map
What this means for you Summary
Snapshot
- This is a 9 × 1-bed/?-bath units multifamily listed at $2.50M.
Deal economics
- At list price, monthly cash flow is $4k ($51k/yr) — positive. Per door: $472/mo.
- The deal already cash-flows at list — no discount required.
- To meet the 1% rule (rent ≥ 1% of price), the offer needs to be $2.38M (4.7% below list).
- Recommended offer: $2.20M (12.0% below list) — sets the bar for market timing.
- Cap rate 8.3% vs local median 2.1% in Los Angeles — top-decile yield for the area; either an underpriced asset or a hidden risk that comps aren't pricing in. Stress-test before assuming the spread holds.
Location & tenants
- Location reads 68/100 on livability (#273 in CA) — a middle-class / working-renter tenant base. Strengths: amenities A+, commute A+, employment B; Watch: health & safety C-, schools D+, crime F.
- Los Angeles Unified (urban): math 29% / reading 54% proficiency, ranked #223 of 517 in CA (top 43%) — families likely to look elsewhere, expect single-tenant / working-renter base with shorter leases; 67% free/reduced lunch — lower-income household profile, screen leases tightly.
- Market conditions: Rents flat; 121 active listings in the ZIP; 1 comparable units currently listed for rent nearby; solid renter incomes; 19,697 units permitted in Los Angeles County in 2024 (9,426 in 5+ unit buildings).
- At $23,825/mo this rent would consume 270% of the median local household income ($106k/yr) (locally 4507% of renters already pay >50% of income on rent) — very limited rent-growth headroom before tenants either downsize or default.
Forward outlook
- Local home prices are declining (-3.0%/yr); year-one equity from $17k of loan paydown is wiped out by about $75k of value loss. Plan a longer hold.
- Los Angeles County population projected at +9% by 2050 — modest demand growth; plan on rents tracking national, not racing it.
Negotiation context
- It's been on market 479 days — a 12% lower offer ($2.20M) is reasonable based on typical stale-listing flexibility.
- 2 sale attempts since 2y ago; this cycle's ask has dropped $200k (7%) from the opening price — seller is motivated, your offer sets the floor, not the list.
- Current owner paid $110k; list at $2.50M implies a 2183% gain — meaningful room to come down on a strong offer.
Risks & watch-outs
- Climate carrying-cost: extreme-heat days projected 7→21/yr by 2055 (HVAC capex compounding) — expect insurance premiums to compound above CPI over the hold.
Questions for the listing agent
- It's been on market 479 days. Have you received any prior offers? Is the seller open to a 12% concession, seller financing, or rate buy-down credit?
- Can we see the unit-by-unit rent roll, current vacancy, and any below-market leases? What's the average tenancy length?
- What capital expenditures (roof, boiler, parking lot, exteriors) have been made in the last 5 years, and what's planned in the next 2?
- Built in 1961 — when were the roof, HVAC, electrical panel, plumbing, and water heater last replaced?
- Why hasn't it sold? Are there any deal-killer items the seller is aware of (foundation, flood, title, zoning, code violations)?
- Is there a deadline driving the sale (1031 exchange, divorce, estate, relocation)? That informs how much negotiation room exists.
- Schools are D-rated, which usually means shorter tenancies and higher turnover. Who's the typical renter profile here, and what's been the actual vacancy rate?
- Crime grade is F in this area — have there been break-ins, vandalism, or insurance claims at this property in the last 3 years? What carrier currently insures it and at what premium?
- What's the average days-on-market for RENTAL listings here right now (not sales)? A rising rental-DOM trend means longer vacancies and softer asking-rent achievability than the comps imply.
- What's the recent tenant-quality profile in this submarket — average credit score on applications, eviction rate, late-payment / NSF rate, and stable-employment percentage? A property-management company in the area should have these aggregated.
- How much new apartment / multifamily construction is in the pipeline within 1–3 miles? Heavy new supply (>2% of stock underway) typically softens rents 12–24 months out; light construction supports rent growth.
Investment metrics
- 1% rule
- 0.95% ✗
- Cap rate
- 8.33%
- Cash-on-cash
- 7.28%
- DSCR
- 1.32
- GRM
- 8.7
CMA / ARV
- ARV (median comp)
- $2,808,469
- List price
- $2,500,000
- Delta
- -10.98%
- Verdict
- UNDERPRICED
- Comps
- 20 within 1.0 mi
Show comp detail 2 sales within ~0.75 mi
| Address | Dist | Beds/Ba | Sqft | Sold | Price | $/sf | Match |
|---|---|---|---|---|---|---|---|
| 3310 Keystone Ave | 0.45mi | 10/11.0 (+1) | 7,316 (-3%) | 2mo | $2,450,000 | $335 | 68 |
| 3831 Motor | 0.32mi | 10/13.0 (+1) | 8,159 (+9%) | 3mo | $2,045,000 | $251 | 55 |
Match score weights: distance 35% · size 25% · config 20% · recency 20%. Top-matched comps best support the ARV.
Projected returns pro-forma
-3.0% appreciation · 0.3% rent growth · sell at horizon
- IRR
- -7.9%
- Equity multiple
- 0.72×
- Total profit
- $-199,078
- Equity at exit
- $372,758
- IRR
- -1.8%
- Equity multiple
- 0.89×
- Total profit
- $-75,523
- Equity at exit
- $216,154
Cash invested: $700,000 (down + closing). Projections, not guarantees.
Landlord ↔ Tenant lean methodology
- Overall (CITY)
- 0 Strongly Tenant-Friendly
- State California
- 18 Strongly Tenant-Friendly · D+13
- County
- — inherits STATE
- City Los Angeles
- 0 Strongly Tenant-Friendly · D+22
ZIP-level market 90034
- Rents YoY
- 0.3%
- Active inventory
- 121
- Price-to-rent
- 78.7×
Monthly cashflow live
- Estimated rent
- $23,825 high interval (Pro) →
- Mortgage (P&I)
- −$13,110
- Tax from tax record
- −$425 /mo · $5,100/yr
- Insurance
- −$1,042
- HOA
- −$0
- Vacancy / Maint / Mgmt
- −$5,003
- Net cashflow
- $4,245
Break-even live
Sensitivity live
| Price | -10% $5,660 | -5% $4,952 | +0% $4,245 | +5% $681 | +10% $-183 |
|---|---|---|---|---|---|
| Rent | -10% $2,363 | -5% $3,304 | +0% $4,245 | +5% $5,186 | +10% $6,127 |
| Rate | -1.0pp $5,504 | -0.5pp $4,881 | base $4,245 | +0.5pp $3,597 | +1.0pp $2,938 |
9-unit breakdown (identical units grouped — click to expand)
| Units | Beds | Baths | Est. rent |
|---|---|---|---|
| 9× units | 1 | — | $23,823 |
| #1 | 1 | — | $2,647 |
| #2 | 1 | — | $2,647 |
| #3 | 1 | — | $2,647 |
| #4 | 1 | — | $2,647 |
| #5 | 1 | — | $2,647 |
| #6 | 1 | — | $2,647 |
| #7 | 1 | — | $2,647 |
| #8 | 1 | — | $2,647 |
| #9 | 1 | — | $2,647 |
| Total (9 units) | $23,825 | ||
UW: 25.0% down · 7.5% · 30yr · 1.5% tax · 5.0% vac · 8.0% maint · 8.0% mgmt
Financing live
Cash to close
- Down payment
- $625,000
- Closing costs
- $75,000
- Reserves months
- —
- Total cash needed
- —
Loan-product check · same deal, 3 products live
Conventional
25% down · 7.5% · 30yr
- Down + closing
- —
- Monthly P&I
- —
- Monthly cashflow
- —
- DSCR
- —
- Eligible?
- —
Personal DTI + credit; lowest rate.
DSCR
20% down · 8.5% · 30yr
- Down + closing
- —
- Monthly P&I
- —
- Monthly cashflow
- —
- DSCR
- —
- Eligible?
- —
No personal income docs; deal must DSCR.
Hard money
10% down · 12.0% · 12mo
- Down + closing
- —
- Monthly P&I
- —
- Monthly cashflow
- —
- DSCR
- —
- Eligible?
- —
Short-term bridge; refi at stabilization.
Rent comps 1 comps
| Address | Beds | Baths | Sqft | Rent | $/sqft | DOM | Units | Dist |
|---|---|---|---|---|---|---|---|---|
| 9041 Cattaraugus Ave Los Angeles, CA | 8.0 | 8.0 | 5689 | $15,500 | $2.72 | 44d | 1 | 1.38mi |
Listing history 19 events
-
2026-06-18days on market $2,500,000 Active 479 DOM
-
2026-06-17days on market $2,500,000 Active 478 DOM
-
2026-06-16days on market $2,500,000 Active 477 DOM
-
2026-06-15days on market $2,500,000 Active 476 DOM
-
2026-06-13days on market $2,500,000 Active 474 DOM
-
2026-06-09days on market $2,500,000 Active 470 DOM
-
2026-06-08days on market $2,500,000 Active 469 DOM
-
2026-06-07days on market $2,500,000 Active 468 DOM
-
2026-06-04days on market $2,500,000 Active 465 DOM
-
2026-06-03days on market $2,500,000 Active 464 DOM
-
2026-06-02days on market $2,500,000 Active 463 DOM
-
2026-06-01days on market $2,500,000 Active 462 DOM
-
2026-05-31days on market $2,500,000 Active 461 DOM
-
2025-05-08price $2,500,000 1830-char remark
Show marketing remark (1830 chars)
MAJOR PRICE ADJUSTMENT! We are pleased to present a 9 unit offering in one of the best Palms locations at 3662 Keystone Ave, just a short distance to the new developments along Overland Blvd and short distance to downtown Culver City. The offering consists of (6) 1 Bed, 1 Bath, (1) 2 Bed, 2 Bath, (1) 2 Bed, 1.5 Bath, and (1) Studio, 1 Bath unit that is spread out over 7,512 square feet, which offers spacious unit layouts. The property was built in 1961 and sits on a 7,500 square foot lot that is zoned LAR3. The investment offering provides an excellent value-add opportunity for future investors with rents approximately 30% below market, in one of the best rental pockets of LA's Westside. The building offers 10 parking spaces and on-site laundry for for tenants. The building features a brand new roof, copper plumbing and was recently repainted. With it's excellent unit mix and future upside potential, an investor is poised to take advantage of a generational real estate asset in a prime location that has experienced tremendous growth and development. The Palms market has continued to prove to be one of the best rental pockets in all of Los Angeles. With continued rent growth and low vacancy rates, renters continue to seek out opportunities in the immediate area surrounding the subject property. With Culver City directly to the south, Venice directly west, and high end neighborhoods just to the north, Palms is strategically located to continue to see massive growth. Area amenities include high end restaurants, bars and nightlife along with shopping and a robust office market making it a perennial economic hub in Southern California. With tech companies like Amazon, Youtube and TikTok, the location and rental upside make this an opportunity to own a generational asset in one of LA's best neighborhoods.
-
2025-04-03price $2,595,000 1830-char remark
Show marketing remark (1830 chars)
MAJOR PRICE ADJUSTMENT! We are pleased to present a 9 unit offering in one of the best Palms locations at 3662 Keystone Ave, just a short distance to the new developments along Overland Blvd and short distance to downtown Culver City. The offering consists of (6) 1 Bed, 1 Bath, (1) 2 Bed, 2 Bath, (1) 2 Bed, 1.5 Bath, and (1) Studio, 1 Bath unit that is spread out over 7,512 square feet, which offers spacious unit layouts. The property was built in 1961 and sits on a 7,500 square foot lot that is zoned LAR3. The investment offering provides an excellent value-add opportunity for future investors with rents approximately 30% below market, in one of the best rental pockets of LA's Westside. The building offers 10 parking spaces and on-site laundry for for tenants. The building features a brand new roof, copper plumbing and was recently repainted. With it's excellent unit mix and future upside potential, an investor is poised to take advantage of a generational real estate asset in a prime location that has experienced tremendous growth and development. The Palms market has continued to prove to be one of the best rental pockets in all of Los Angeles. With continued rent growth and low vacancy rates, renters continue to seek out opportunities in the immediate area surrounding the subject property. With Culver City directly to the south, Venice directly west, and high end neighborhoods just to the north, Palms is strategically located to continue to see massive growth. Area amenities include high end restaurants, bars and nightlife along with shopping and a robust office market making it a perennial economic hub in Southern California. With tech companies like Amazon, Youtube and TikTok, the location and rental upside make this an opportunity to own a generational asset in one of LA's best neighborhoods.
-
2025-02-24$2,700,000 Active 1830-char remark
Show marketing remark (1830 chars)
MAJOR PRICE ADJUSTMENT! We are pleased to present a 9 unit offering in one of the best Palms locations at 3662 Keystone Ave, just a short distance to the new developments along Overland Blvd and short distance to downtown Culver City. The offering consists of (6) 1 Bed, 1 Bath, (1) 2 Bed, 2 Bath, (1) 2 Bed, 1.5 Bath, and (1) Studio, 1 Bath unit that is spread out over 7,512 square feet, which offers spacious unit layouts. The property was built in 1961 and sits on a 7,500 square foot lot that is zoned LAR3. The investment offering provides an excellent value-add opportunity for future investors with rents approximately 30% below market, in one of the best rental pockets of LA's Westside. The building offers 10 parking spaces and on-site laundry for for tenants. The building features a brand new roof, copper plumbing and was recently repainted. With it's excellent unit mix and future upside potential, an investor is poised to take advantage of a generational real estate asset in a prime location that has experienced tremendous growth and development. The Palms market has continued to prove to be one of the best rental pockets in all of Los Angeles. With continued rent growth and low vacancy rates, renters continue to seek out opportunities in the immediate area surrounding the subject property. With Culver City directly to the south, Venice directly west, and high end neighborhoods just to the north, Palms is strategically located to continue to see massive growth. Area amenities include high end restaurants, bars and nightlife along with shopping and a robust office market making it a perennial economic hub in Southern California. With tech companies like Amazon, Youtube and TikTok, the location and rental upside make this an opportunity to own a generational asset in one of LA's best neighborhoods.
-
2024-07-11historical 426-char remark
Show marketing remark (426 chars)
HURRY, HURRY, HURRY!!! Have you been wringing your hands searching for affordable investment apartment building? Or a property suitable for a contractor to build a 5 story with subterranean parking? This is it. It'll be gone if you hesitate. Neighborhood already has several newer high rises. The older buildings are nicely kept. Just a lovely neighborhood. Drive by only, please. No sign. (Currently rented. ) Get it now!
-
2024-03-02$3,000,000 Active 426-char remark
Show marketing remark (426 chars)
HURRY, HURRY, HURRY!!! Have you been wringing your hands searching for affordable investment apartment building? Or a property suitable for a contractor to build a 5 story with subterranean parking? This is it. It'll be gone if you hesitate. Neighborhood already has several newer high rises. The older buildings are nicely kept. Just a lovely neighborhood. Drive by only, please. No sign. (Currently rented. ) Get it now!
-
1972-10-18soldstatus $109,500
ⓘ Source: listings_history table (triggers on properties + properties_extension) + one-shot
backfill from property_details.listing_events for pre-trigger history.
Tax reassessment forecast CA · Resets to sale price
- Current annual tax
- $5,100 · $425/mo
- Projected year-2 tax
- $19,000 · $1,583/mo
- Expected delta
- +$13,900/yr (+$1,158/mo · 272.6%)
ⓘ Screening estimate from a state-policy table — verify with the county assessor before closing.
Climate risk First Street
- Flood 1/10 Low FEMA zone X (unshaded) · 0% chance over 30 yrs
- Wildfire 1/10 Low
- Heat 6/10 Major 7 d/yr ≥85°F today · 21 d/yr by 30 yrs out
- Wind 1/10 Low
- Air quality 4/10 Moderate 6 unhealthy d/yr today · 7 by 30 yrs out
Nearby sold comps map
Loading sold comps map…
Walkable amenities ~0.75 mi
Loading nearby amenities…
Taxation est. · year 1
- Rental income
- $285,900
- − Mortgage interest
- −$140,039
- − Property taxes
- −$5,100
- − Insurance
- −$12,500
- − Repairs & maintenance
- −$22,872
- − Management
- −$22,872
- − Depreciation
- −$72,727
- Taxable income
- $9,790
- Est. tax owed @ 24.0%
- −$2,350
- After-tax cash flow
- $48,588/yr
For passive investors: Depreciation is non-cash, so a rental often shows a tax loss while cash-flowing — sheltering income. Rental losses are passive: they offset passive income freely, and up to $25,000/yr can offset ordinary (W-2) income if you actively participate and your MAGI is under $100k (phasing out to $0 by $150k); unused losses carry forward. On sale, claimed depreciation is recaptured at up to 25%, and gains may owe capital-gains tax (a 1031 exchange can defer both). Figures are a year-1 estimate at your 24.0% rate — not tax advice; consult a CPA.
Schools (NCES district)
- District
- Los Angeles Unified
- NCES district ID
- 0622710
- Math proficiency
- 29% ▼ -4.00%
- Reading proficiency
- 54% ▲ 10.00%
- Median HH income
- $50,403
- Composite
- 35.67/100
- National rank
- #4875
- State rank
- #223 of 517 in CA
Livability — Los Angeles
- Score
- 68/100
- State rank
- #273
- US rank
- #9237
Category grades
Schools grade is shown separately in the Schools card above.
Census & demographics
- Census place
- Los Angeles, CA
- County
- Los Angeles County · 9,444,647 people
- City population
- 3,838,149
- Metro
- Los Angeles-Long Beach-Anaheim, CA
- Population (ZIP)
- 57,075
- Household income
- $105,701
- Rent vs Own
- Severe rent burden
- 4507.0
Population outlook (Los Angeles County) Hauer SSP2
- Today (2025)
- 10,940,515 people
- By 2030
- 11,256,481 · +2.9%
- By 2040
- 11,729,929 · +7.2%
- By 2050
- 11,948,407 · +9.2%
- By 2075
- 11,818,114 · +8.0%
- By 2100
- 10,842,928 · -0.9%
Race, ethnicity, and origin ACS 2023
- Neighborhood character
- Highly diverse neighborhood (Simpson 0.73)
- Race & ethnicity
- White 41% Hispanic / Latino 26% Asian 18% Two or more races 13% Black 9%
- Hispanic origin (detail)
- Mexican 16%
- Common ancestry
- Scotch-Irish 3% Romanian 3% Italian 2%
- Foreign-born
- 30% · Canada, China, South Korea
- Languages at home
- 58% English-only · Spanish 21% Other Indo-European 6% Chinese 4%
Political lean MEDSL · Los Angeles
- 2024 margin
- Solid D (+32.9) · D 64.8% · R 31.9% · Other 3.3%
- 2008→2024 swing
- -7.4pp toward R · 2008: 40.4pp · 2024: 32.9pp
- All cycles
- 2024: D+32.9 2020: D+44.2 2016: D+48.0 2012: D+40.0 2008: D+40.4
Not yet ingested
- Civics
- —
Market trends
- HPI YoY
- ▼ -1346.08%
- Current HPI
- 445.7709
- Rent YoY
- ▲ 0.30%
- Metro
- Los Angeles-Long Beach-Anaheim, CA
- State GDP YoY
- ▲ 3.21%
- F500 in state
- 116
Industry mix (Fortune 500 HQ in CA)
| Industry | F500 HQs | Revenue |
|---|---|---|
| Technology | 27 | $1,492B |
|
||
| Financial Services | 3 | $174B |
|
||
| Retail | 3 | $44B |
|
||
| Insurance | 3 | $26B |
|
||
| Media / Entertainment | 2 | $115B |
|
||
| Pharmaceuticals / Biotech | 2 | $62B |
|
||
Price history
+2183.1% since first listed6 events — show timeline
- 2025-05-08 Price Changed $2,500,000 TheMLS
- 2025-04-03 Price Changed $2,595,000 TheMLS
- 2025-02-24 Listed $2,700,000 TheMLS
- 2024-07-11 Listing Removed — CSMAR
- 2024-03-02 Listed $3,000,000 CSMAR
- 1972-10-18 Sold (Public Records) $109,500 Public Records
Property tax history
+1.8%/yrLatest (2025): $5,100 · +2.7% YoY. Source: county tax records.
Cash-flow waterfall
monthlySold comps — $/sqft
last 12 mo · ≤1 miLoading sold comps…