2801 SW Houtama Rd · Pendleton, OR
Flood risk 1/10 · Minimal
- FEMA flood zone
- X (unshaded)
- Chance of flooding over 30 yrs
- 0.0%
- Est. flood insurance / yr
- $507 – $1,088
Fire risk 7/10 · Major
- Est. fire insurance / yr
- $498 – $926
Heat risk 4/10 · Minor
- Hot days now (above 97°F)
- 6 days/yr
- Hot days in 30 yrs
- 14 days/yr
Wind risk 1/10 · Minimal
- Chance of severe wind over 30 yrs
- —
Air-quality risk 7/10 · Major
- Unhealthy air days now
- 8 days/yr
- Unhealthy air days in 30 yrs
- 9 days/yr
Risk factors via First Street. Map © Google.
Why this score? — see what drove the B- grade
The composite is a weighted blend of 9 inputs, each scored 0–100. Each bar is that input's sub-score; the figure is the points it added to the 100-point composite (weight × sub-score).
- Cash flow +30.0/30.0
- 1% rule +10.0/10.0
- DSCR +10.0/10.0
- ARV discount +7.5/15.0
- Livability +3.1/5.0
- Schools +3.0/10.0
- Condition / age +2.2/5.0
- Rent growth +1.8/5.0
- Appreciation +0.0/10.0
$55,000
🖨 Deal sheet 📄 Offer letter ✓ Due diligence
Listing remarks
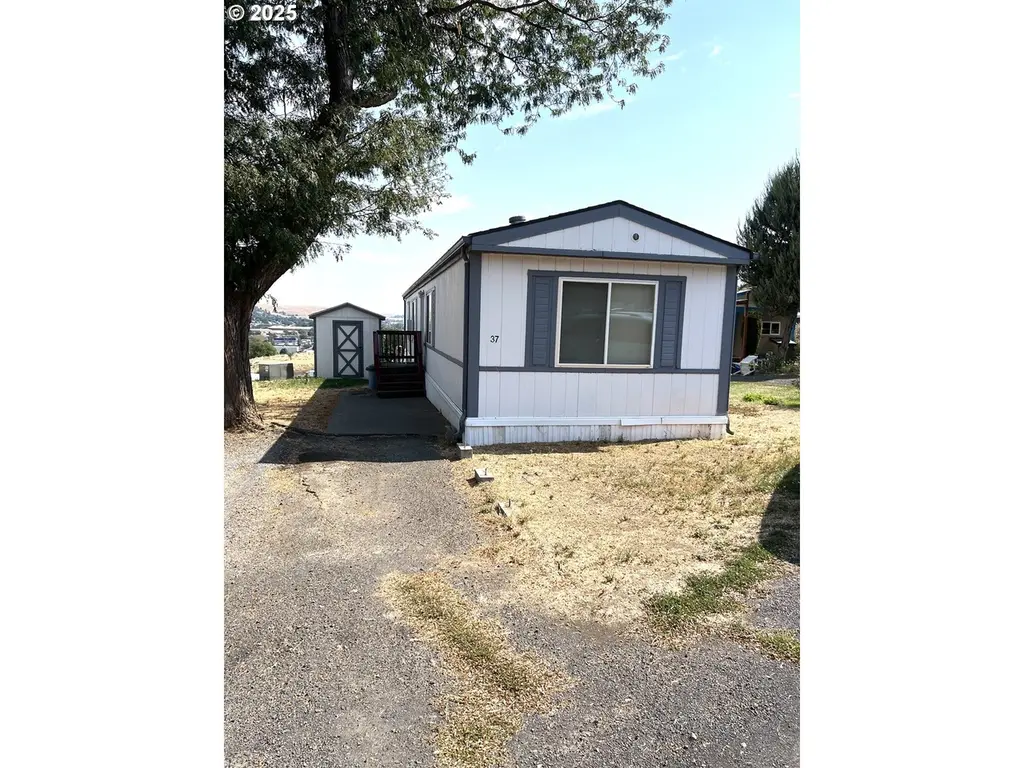
Well-maintained 1995 mobile home featuring 2 bedrooms and 2 bathrooms. The renovated primary bathroom and updated front entry stairs add comfort and appeal. Ideal for first-time buyers or those looking to downsize. Conveniently located to shopping and recreational activities. Schedule your showing today!
Key facts
- Built 1995
- Listed 48 days
Tags
Property features AI
Finance
- Other: Parcel number 151435
- HOA & community: Not a senior community; Land lease: No; Lot rent $580 monthly
Exterior
- Parking: Driveway
- Utilities: Electric fuel; Public water; Public sewer
- Home design: Manufactured home in a park; Residential property (detached); Resale; Main level living
- Construction: Built in 1995; Skirting foundation
- Exterior features: Lap siding; Composition roof
Interior
- Kitchen: Dishwasher; Free-standing range; Range hood; Free-standing refrigerator
- Bedrooms: Primary bedroom on the main level; Second bedroom on the main level
- Flooring: Wall-to-wall carpet
- Bathrooms: 2 full bathrooms (both on the main level)
- Heating & cooling: Forced air heating; Central air conditioning; Electric hot water
- Interior features: Wall-to-wall carpet; Vinyl window frames
Neighborhood map
What this means for you Summary
Snapshot
- This is a 2-bed/2.0-bath manufactured listed at $55k. Condition is rated fair.
Deal economics
- At list price, monthly cash flow is $681 ($8k/yr) — positive.
- The deal already cash-flows at list — no discount required.
- Meets the 1% rule at list price ($1k rent vs $55k).
- Recommended offer: $53k (3.0% below list) — sets the bar for market timing.
- Cap rate 21.2% vs local median 3.2% in Pendleton — top-decile yield for the area; either an underpriced asset or a hidden risk that comps aren't pricing in. Stress-test before assuming the spread holds.
Location & tenants
- Location reads 61/100 on livability (#267 in OR) — a middle-class / working-renter tenant base. Strengths: housing A+, cost of living A; Watch: employment D+, crime D-, amenities F.
- Pendleton SD 16 (town): math 27% / reading 43% proficiency, ranked #24 of 58 in OR (top 41%) — families likely to look elsewhere, expect single-tenant / working-renter base with shorter leases.
- Zoned schools: Pendleton High School (math 22% / reading 62%, grade F, #67 of 143 statewide, top 46%, 795 students, 73% FRL) — zoned schools average 73% FRL vs 44% district-wide (28 pts higher); higher-poverty schools than district average — tighter screening recommended.
- Market conditions: Rents soft (-2.7%/yr); 139 active listings in the ZIP; 7 comparable units currently listed for rent nearby; rentals lingering (median 44d on market — plan ~5-8 weeks vacancy on turnover, expect pricing pressure); 100% of comp listings sitting > 30 days — soft ceiling on asking rent; 205 units permitted in Umatilla County in 2024 (0 in 5+ unit buildings).
Forward outlook
- Local home prices are declining (-3.0%/yr); year-one equity from $380 of loan paydown is wiped out by about $2k of value loss. Plan a longer hold.
- Umatilla County population projected to shrink 3% by 2050 — rents likely to lag national; underwrite the cash flow, not the appreciation.
- At projected returns (-3.0% appreciation + 0.0% rent growth), your $15k cash investment doubles in ~3 years — after that, you're playing with house money.
Negotiation context
- It's been on market 49 days — a 3% lower offer ($53k) is reasonable based on typical stale-listing flexibility.
Risks & watch-outs
- Climate carrying-cost: major wildfire risk — expect insurance premiums to compound above CPI over the hold.
Questions for the listing agent
- It's been on market 49 days. Have you received any prior offers? Is the seller open to a 3% concession, seller financing, or rate buy-down credit?
- Have any recent inspections been done? Can we get a copy of the seller's disclosures and any deferred-maintenance estimates?
- Is there a deadline driving the sale (1031 exchange, divorce, estate, relocation)? That informs how much negotiation room exists.
- Schools are D-rated, which usually means shorter tenancies and higher turnover. Who's the typical renter profile here, and what's been the actual vacancy rate?
- Crime grade is D in this area — have there been break-ins, vandalism, or insurance claims at this property in the last 3 years? What carrier currently insures it and at what premium?
- What's the average days-on-market for RENTAL listings here right now (not sales)? A rising rental-DOM trend means longer vacancies and softer asking-rent achievability than the comps imply.
- What's the recent tenant-quality profile in this submarket — average credit score on applications, eviction rate, late-payment / NSF rate, and stable-employment percentage? A property-management company in the area should have these aggregated.
- How much new for-sale + rental construction is in the pipeline within 1–3 miles? Heavy new supply typically softens prices + rents 12–24 months out; constrained supply supports both.
Investment metrics
- 1% rule
- 2.44% ✓
- Cap rate
- 21.15%
- Cash-on-cash
- 53.07%
- DSCR
- 3.36
- GRM
- 3.4
CMA / ARV
- ARV (median comp)
- $121,417
- List price
- $55,000
- Delta
- -54.70%
- Verdict
- UNDERPRICED
- Comps
- 4 within 1.0 mi
Show comp detail 2 sales within ~0.75 mi
| Address | Dist | Beds/Ba | Sqft | Sold | Price | $/sf | Match |
|---|---|---|---|---|---|---|---|
| 2801 SW Houtama Rd #88 | 0.00mi | 3/2.0 (+1) | 896 (-5%) | 9mo | $58,000 | $65 | 80 |
| 2600 SW Goodwin Ave #6 | 0.35mi | 3/2.0 (+1) | 1,075 (+14%) | 8mo | $190,000 | $177 | 48 |
Match score weights: distance 35% · size 25% · config 20% · recency 20%. Top-matched comps best support the ARV.
Projected returns pro-forma
-3.0% appreciation · 0.0% rent growth · sell at horizon
- IRR
- 47.7%
- Equity multiple
- 2.98×
- Total profit
- $30,548
- Equity at exit
- $8,201
- IRR
- 52.1%
- Equity multiple
- 5.37×
- Total profit
- $67,324
- Equity at exit
- $4,755
Cash invested: $15,400 (down + closing). Projections, not guarantees.
Landlord ↔ Tenant lean methodology
- Overall (STATE)
- 28 Tenant-Leaning
- State Oregon
- 28 Tenant-Leaning · D+6
- County
- — inherits STATE
- City
- — inherits STATE
ZIP-level market 97801
- Rents YoY
- -2.7%
- Active inventory
- 139
- Price-to-rent
- 3.4×
Monthly cashflow live
- Estimated rent
- $1,343 high interval (Pro) →
- Mortgage (P&I)
- −$288
- Tax est. 1.5%
- −$69 /mo · $825/yr
- Insurance
- −$23
- HOA
- −$0
- Vacancy / Maint / Mgmt
- −$282
- Net cashflow
- $681
Break-even live
UW: 25.0% down · 7.5% · 30yr · 1.5% tax · 5.0% vac · 8.0% maint · 8.0% mgmt
Financing live
Cash to close
- Down payment
- $13,750
- Closing costs
- $1,650
- Reserves months
- —
- Total cash needed
- —
Loan-product check · same deal, 3 products live
Conventional
25% down · 7.5% · 30yr
- Down + closing
- —
- Monthly P&I
- —
- Monthly cashflow
- —
- DSCR
- —
- Eligible?
- —
Personal DTI + credit; lowest rate.
DSCR
20% down · 8.5% · 30yr
- Down + closing
- —
- Monthly P&I
- —
- Monthly cashflow
- —
- DSCR
- —
- Eligible?
- —
No personal income docs; deal must DSCR.
Hard money
10% down · 12.0% · 12mo
- Down + closing
- —
- Monthly P&I
- —
- Monthly cashflow
- —
- DSCR
- —
- Eligible?
- —
Short-term bridge; refi at stabilization.
Rent comps 7 comps
| Address | Beds | Baths | Sqft | Rent | $/sqft | DOM | Units | Dist |
|---|---|---|---|---|---|---|---|---|
| 2601 SW Hailey Ave Pendleton, OR | 1.0–2.0 | 2.0 | 816 | $1,300 | $1.59 | 43d | 4 | 0.51mi |
| 2921 Westgate Pendleton, OR | 3.0 | 1.0–2.0 | 869 | $1,854 | $2.13 | 43d | 23 | 0.74mi |
| 3200 SW Perkins Ave Pendleton, OR | 2.0 | 2.0 | 1000 | $1,450 | $1.45 | 43d | 1 | 0.77mi |
| 1405 NW Despain Ave Pendleton, OR | 3.0 | 1.0 | 986 | $1,300 | $1.32 | 43d | 1 | 1.15mi |
| 516 NW Bailey Ave Unit 1 Pendleton, OR | 2.0 | 1.0 | 850 | $975 | $1.15 | 43d | 1 | 1.42mi |
| 438 SW 5th St Pendleton, OR | 2.0 | 1.0 | 795 | $1,145 | $1.44 | 43d | 4 | 1.46mi |
| 623 SW 4th St Unit 1 Pendleton, OR | 3.0 | 2.0 | 945 | $1,300 | $1.38 | 43d | 1 | 1.50mi |
Listing history 16 events
-
2026-06-19days on market $55,000 Active 49 DOM
-
2026-06-18days on market $55,000 Active 48 DOM
-
2026-06-17days on market $55,000 Active 47 DOM
-
2026-06-16days on market $55,000 Active 46 DOM
-
2026-06-15days on market $55,000 Active 45 DOM
-
2026-06-14days on market $55,000 Active 43 DOM
-
2026-06-12days on market $55,000 Active 42 DOM
-
2026-06-09days on market $55,000 Active 39 DOM
-
2026-06-08days on market $55,000 Active 38 DOM
-
2026-06-07days on market $55,000 Active 37 DOM
-
2026-06-03days on market $55,000 Active 33 DOM
-
2026-06-02days on market $55,000 Active 32 DOM
-
2026-06-01days on market $55,000 Active 31 DOM
-
2026-05-31days on market $55,000 Active 30 DOM
-
2026-05-30days on market $55,000 Active 29 DOM
-
2025-08-30$55,000 Active 305-char remark
ⓘ Source: listings_history table (triggers on properties + properties_extension) + one-shot
backfill from property_details.listing_events for pre-trigger history.
Climate risk First Street
- Flood 1/10 Low FEMA zone X (unshaded) · 0% chance over 30 yrs
- Wildfire 7/10 Severe
- Heat 4/10 Moderate 6 d/yr ≥97°F today · 14 d/yr by 30 yrs out
- Wind 1/10 Low
- Air quality 7/10 Severe 8 unhealthy d/yr today · 9 by 30 yrs out
Nearby sold comps map
Loading sold comps map…
Walkable amenities ~0.75 mi
Loading nearby amenities…
Taxation est. · year 1
- Rental income
- $16,119
- − Mortgage interest
- −$3,081
- − Property taxes
- −$825
- − Insurance
- −$275
- − Repairs & maintenance
- −$1,289
- − Management
- −$1,289
- − Depreciation
- −$1,600
- Taxable income
- $7,759
- Est. tax owed @ 24.0%
- −$1,862
- After-tax cash flow
- $6,311/yr
For passive investors: Depreciation is non-cash, so a rental often shows a tax loss while cash-flowing — sheltering income. Rental losses are passive: they offset passive income freely, and up to $25,000/yr can offset ordinary (W-2) income if you actively participate and your MAGI is under $100k (phasing out to $0 by $150k); unused losses carry forward. On sale, claimed depreciation is recaptured at up to 25%, and gains may owe capital-gains tax (a 1031 exchange can defer both). Figures are a year-1 estimate at your 24.0% rate — not tax advice; consult a CPA.
Condition & rehab AI · 12 photos
A well-maintained 1995 mobile home with cosmetic updates, offering a good starting point for a potential renovation.
Repairs flagged
- Minor kitchen cabinets — slight wear
- Minor bathroom vanity — slight wear
- Minor HVAC unit — visible and likely needs cleaning
Value-add opportunities
- Both paint interior walls — enhances curb appeal and interior aesthetics
- Both replace kitchen countertops — modernizes the space and increases value
- Both landscaping — improves curb appeal and adds value
Renovation cost estimate screening
| Repair item | Severity | Est. cost |
|---|---|---|
| kitchen cabinets · slight wear | Minor | $500–3,000 |
| bathroom vanity · slight wear | Minor | $500–3,000 |
| HVAC unit · visible and likely needs cleaning | Minor | $500–3,000 |
| Total estimated repair cost · 3 items | $1,500–9,000 |
Value-add ROI direction
- Both paint interior walls — enhances curb appeal and interior aesthetics ↑
- Both replace kitchen countertops — modernizes the space and increases value ↑
- Both landscaping — improves curb appeal and adds value ↑
ⓘ Cost ranges are severity-bucket heuristics (US national rule-of-thumb). Get contractor quotes + a written scope before underwriting a rehab budget.
Schools (NCES district)
- District
- Pendleton SD 16
- NCES district ID
- 4109510
- Math proficiency
- 27% ▼ -11.00%
- Reading proficiency
- 43% ▼ -7.00%
- Median HH income
- $49,009
- Composite
- 30.19/100
- National rank
- #6315
- State rank
- #24 of 58 in OR
Livability — Pendleton
- Score
- 61/100
- State rank
- #267
- US rank
- #17964
Category grades
Schools grade is shown separately in the Schools card above.
Census & demographics
- Census place
- Pendleton, OR
- County
- Umatilla County · 29,551 people
- City population
- 21,575
- Metro
- Hermiston-Pendleton, OR
- Population (ZIP)
- 21,575
- Household income
- $71,639
- Rent vs Own
- Severe rent burden
- 866.0
Population outlook (Umatilla County) Hauer SSP2
- Today (2025)
- 76,329 people
- By 2030
- 75,975 · -0.5%
- By 2040
- 75,119 · -1.6%
- By 2050
- 74,058 · -3.0%
- By 2075
- 70,639 · -7.5%
- By 2100
- 63,441 · -16.9%
Race, ethnicity, and origin ACS 2023
- Neighborhood character
- Predominantly White (75%)
- Race & ethnicity
- White 75% Two or more races 11% Hispanic / Latino 10% Native American 7%
- Hispanic origin (detail)
- Mexican 8%
- Common ancestry
- Italian 4% Slovak 4% Portuguese 4%
- Foreign-born
- 2% · Canada
- Languages at home
- 93% English-only · Spanish 6%
Political lean MEDSL · Umatilla
- 2024 margin
- Solid R (+37.8) · D 29.7% · R 67.5% · Other 2.8%
- 2008→2024 swing
- -15.1pp toward R · 2008: -22.6pp · 2024: -37.8pp
- All cycles
- 2024: R+37.8 2020: R+32.0 2016: R+35.6 2012: R+28.1 2008: R+22.6
Not yet ingested
- Civics
- —
Market trends
- HPI YoY
- ▼ -312.42%
- Current HPI
- 198.6911
- Rent YoY
- ▼ -2.66%
- Metro
- Hermiston-Pendleton, OR
- State GDP YoY
- ▲ 2.05%
- F500 in state
- 2
Industry mix (Fortune 500 HQ in OR)
| Industry | F500 HQs | Revenue |
|---|---|---|
| Consumer Goods | 1 | $51B |
|
||
Price history
1 event — show timeline
- 2025-08-30 Listed $55,000 RMLS
Cash-flow waterfall
monthlySold comps — $/sqft
last 12 mo · ≤1 miLoading sold comps…