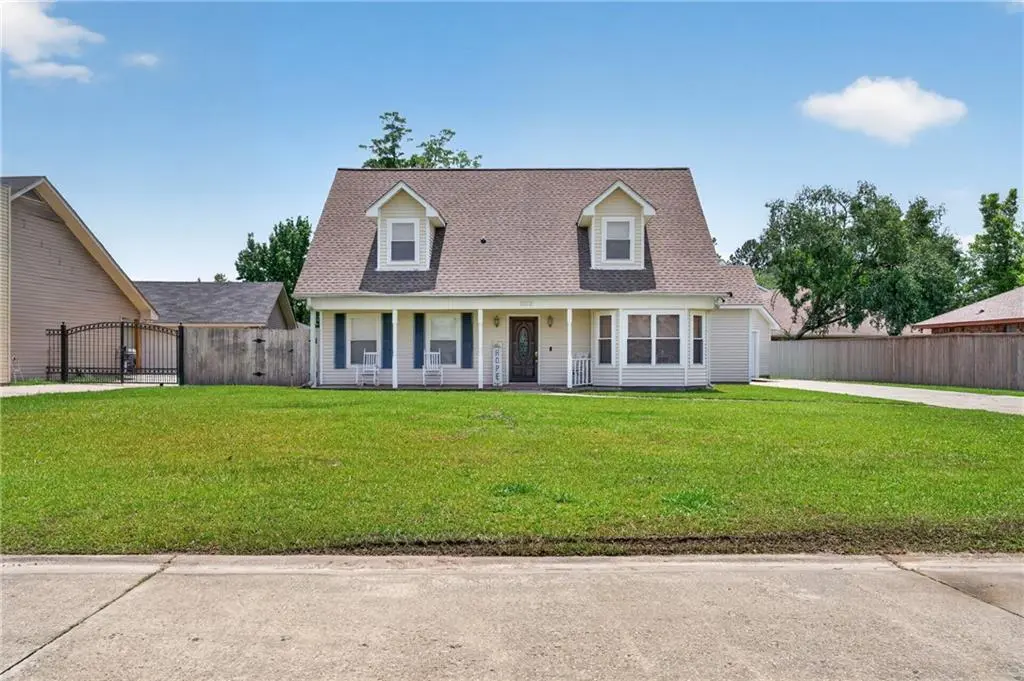
202 Oakmont Dr · Slidell, LA
Flood risk 1/10 · Minimal
- FEMA flood zone
- X
- Chance of flooding over 30 yrs
- 0.0%
- Est. flood insurance / yr
- $507 – $1,088
Fire risk 4/10 · Minor
- Est. fire insurance / yr
- $1,269 – $2,357
Heat risk 10/10 · Severe
- Hot days now (above 108°F)
- 7 days/yr
- Hot days in 30 yrs
- 22 days/yr
Wind risk 9/10 · Severe
- Chance of severe wind over 30 yrs
- 99.0%
Air-quality risk 2/10 · Minimal
- Unhealthy air days now
- 1 days/yr
- Unhealthy air days in 30 yrs
- 2 days/yr
Risk factors via First Street. Map © Google.
Why this score? — see what drove the C grade
The composite is a weighted blend of 9 inputs, each scored 0–100. Each bar is that input's sub-score; the figure is the points it added to the 100-point composite (weight × sub-score).
- Cash flow +18.7/30.0
- ARV discount +15.0/15.0
- DSCR +5.9/10.0
- Schools +4.3/10.0
- 1% rule +4.1/10.0
- Rent growth +4.0/5.0
- Livability +3.5/5.0
- Condition / age +2.5/5.0
- Appreciation +0.0/10.0
$235,000
🖨 Deal sheet (PDF) 📄 Offer letter ✓ Due diligence
Listing remarks MLS
Welcome to a spacious, structurally sound home full of potential and ready for your personal touch! From the inviting front porch to the generous interior spaces, this property offers great bones and timeless features waiting to be refreshed to match your style. Step inside to a spacious foyer that welcomes you into the heart of the home. The comfortable den features a cozy wood-burning fireplace, creating the perfect gathering space, while the open dining area flows seamlessly from the den for easy entertaining. A convenient wet bar with sink adds extra charm and functionality. The galley kitchen offers granite countertops, ample workspace, and a breakfast area for casual dining. The oversized primary suite provides a relaxing retreat with an adjoining bath featuring separate vanities, separate closets, and a walk-in shower. Upstairs, you'll find two generously sized bedrooms and a shared bathroom, offering comfortable accommodations for family or guests. One of the standout features of this home is the abundant storage space throughout. Enjoy outdoor living on the covered back porch overlooking the fenced yard, with a detached two-car garage providing additional convenience and storage. Additional features include an all-electric setup, two water heaters, two air conditioning systems, and a roof that is only 4 years old. X Flood zone, and the convenient location offers easy access for commuters. If you're looking for a well-built home with space, functionality, and the opportunity to make it your own, this property is ready to shine again
Key facts
- Front porch
- Granite countertops
- Wet bar with sink
Tags
Property features AI
Exterior
- Parking: Detached garage with two spaces
- Utilities: Public water; Public sewer
- Home design: Rectangular lot; Located outside city limits
- Construction: Vinyl siding; Shingle roof; Slab foundation; Average condition
- Exterior features: Covered brick porch; Porch
Interior
- Kitchen: Granite counters
- Bedrooms: Total of 9 rooms (bedroom count not specified)
- Bathrooms: 2 full bathrooms; 1 half bathroom
- Heating & cooling: Multiple heating units; Has cooling; Has heating
- Interior features: Attic; Ceiling fan(s); Cathedral ceilings; Vaulted ceilings; Granite counters; High ceilings; Accessibility features
Neighborhood map
What this means for you Summary
Snapshot
- This is a 3-bed/2.5-bath single-family listed at $235k.
Deal economics
- At list price, monthly cash flow is $231 ($3k/yr) — positive.
- The deal already cash-flows at list — no discount required.
- To meet the 1% rule (rent ≥ 1% of price), the offer needs to be $215k (8.6% below list).
- Recommended offer: $215k (8.6% below list) — sets the bar for 1% rule.
- Cap rate 7.5% vs local median 5.9% in Slidell — meaningfully above typical; check what's discounted (condition, days-on-market, listing class) to confirm the premium yield is real.
Location & tenants
- Location reads 70/100 on livability (#57 in LA) — a middle-class / working-renter tenant base. Strengths: cost of living A+, housing A+, health & safety A+; Watch: amenities F, commute F.
- St. Tammany Parish (suburban): math 43% / reading 55% proficiency, ranked #11 of 98 in LA (top 11%) — families likely to look elsewhere, expect single-tenant / working-renter base with shorter leases.
- Market conditions: Rents rising fast (+5.9%/yr); 246 active listings in the ZIP; 3 comparable units currently listed for rent nearby; rentals leasing fast (median 5d on market — plan ~1-2 weeks tenant-placement turnaround); 1,064 units permitted in St. Tammany Parish in 2024 (0 in 5+ unit buildings).
- This rent runs 41% of the median local income ($63k/yr) — at the standard rent-burdened threshold; future hikes will face affordability resistance.
Forward outlook
- Local home prices are declining (-3.0%/yr); year-one equity from $2k of loan paydown is wiped out by about $7k of value loss. Plan a longer hold.
- St. Tammany County population projected at +27% by 2050 — long-run rental-demand tailwind backs the buy-and-hold thesis.
Negotiation context
- It's been on market 15 days — a 2% lower offer ($231k) is reasonable based on typical stale-listing flexibility.
- 4 sale attempts since 9y ago with the ask held roughly flat each time — persistent listings suggest the price (not the market) is what's stuck; bring a comps-based counter.
- Current owner paid $165k; 42% above their basis — modest negotiation headroom, anchor on the comps not their cost.
Risks & watch-outs
- Climate carrying-cost: severe wind risk, 99% chance of damaging wind over 30y; extreme-heat days projected 7→22/yr by 2055 (HVAC capex compounding) — expect insurance premiums to compound above CPI over the hold.
Questions for the listing agent
- Is there a deadline driving the sale (1031 exchange, divorce, estate, relocation)? That informs how much negotiation room exists.
- Schools are B-rated — typically a magnet for longer-tenancy family renters. What's the average tenant stay here, and is there a school-zone premium baked into asking?
- What's the average days-on-market for RENTAL listings here right now (not sales)? A rising rental-DOM trend means longer vacancies and softer asking-rent achievability than the comps imply.
- What's the recent tenant-quality profile in this submarket — average credit score on applications, eviction rate, late-payment / NSF rate, and stable-employment percentage? A property-management company in the area should have these aggregated.
- How much new for-sale + rental construction is in the pipeline within 1–3 miles? Heavy new supply typically softens prices + rents 12–24 months out; constrained supply supports both.
Investment metrics
- 1% rule
- 0.91% ✗
- Cap rate
- 7.47%
- Cash-on-cash
- 4.22%
- DSCR
- 1.19
- GRM
- 9.1
CMA / ARV
- ARV (on-the-fly)
- $319,005
- Comps found
- 12
Show comp detail 12 sales within ~0.75 mi
| Address | Dist | Beds/Ba | Sqft | Sold | Price | $/sf | Match |
|---|---|---|---|---|---|---|---|
| 104 Inverrary Ct | 0.10mi | 3/2.0 | 2,025 (-3%) | 11mo | $290,000 | $143 | 79 |
| 105 Inverrary Ct | 0.11mi | 4/2.0 (+1) | 1,996 (-4%) | 10mo | $215,000 | $108 | 73 |
| 105 Oakmont Dr | 0.10mi | 3/2.0 | 1,808 (-13%) | 0mo | $194,000 | $107 | 71 |
| 100 Inverrary Ct | 0.07mi | 3/2.5 | 1,820 (-13%) | 9mo | $228,000 | $125 | 68 |
| 200 N Pebble Beach Ct | 0.04mi | 4/2.0 (+1) | 1,787 (-14%) | 1mo | $270,000 | $151 | 66 |
| 216 Tiara Dr | 0.22mi | 3/2.5 | 2,356 (+13%) | 14mo | $265,000 | $112 | 57 |
| 248 Chateau Dr | 0.56mi | 2/2.0 (-1) | 1,917 (-8%) | 8mo | $380,000 | $198 | 47 |
| 34307 Campana Ln | 0.59mi | 3/2.0 | 1,782 (-14%) | 12mo | $273,135 | $153 | 36 |
| 34303 Campana Ln | 0.59mi | 4/2.5 (+1) | 1,788 (-14%) | 13mo | $277,135 | $155 | 33 |
| 62728 Capella Ct | 0.71mi | 4/2.5 (+1) | 1,839 (-12%) | 13mo | $289,445 | $157 | 32 |
| 62729 Capella Ct | 0.71mi | 3/2.0 | 1,782 (-14%) | 16mo | $274,470 | $154 | 27 |
| 62429 Charlard Ct | 0.75mi | 3/2.0 | 1,782 (-14%) | 15mo | $274,835 | $154 | 27 |
Match score weights: distance 35% · size 25% · config 20% · recency 20%. Top-matched comps best support the ARV.
Projected returns pro-forma
-3.0% appreciation · 5.91% rent growth · sell at horizon
- IRR
- -6.8%
- Equity multiple
- 0.74×
- Total profit
- $-16,942
- Equity at exit
- $35,039
- IRR
- 5.9%
- Equity multiple
- 1.49×
- Total profit
- $32,149
- Equity at exit
- $20,319
Cash invested: $65,800 (down + closing). Projections, not guarantees.
Landlord ↔ Tenant lean methodology
- Overall (STATE)
- 90 Strongly Landlord-Friendly
- State Louisiana
- 90 Strongly Landlord-Friendly · R+12
- County
- — inherits STATE
- City
- — inherits STATE
ZIP-level market 70460
- Rents YoY
- 5.9%
- Active inventory
- 246
- Price-to-rent
- 9.1×
Monthly cashflow live
- Estimated rent
- $2,148 medium interval (Pro) →
- Mortgage (P&I)
- −$1,232
- Tax from tax record
- −$135 /mo · $1,626/yr
- Insurance
- −$98
- HOA
- −$0
- Vacancy / Maint / Mgmt
- −$451
- Net cashflow
- $231
Break-even live
Sensitivity live
| Price | -10% $364 | -5% $298 | +0% $231 | +5% $165 | +10% $98 |
|---|---|---|---|---|---|
| Rent | -10% $62 | -5% $146 | +0% $231 | +5% $316 | +10% $401 |
| Rate | -1.0pp $350 | -0.5pp $291 | base $231 | +0.5pp $170 | +1.0pp $108 |
UW: 25.0% down · 7.5% · 30yr · 1.5% tax · 5.0% vac · 8.0% maint · 8.0% mgmt
Financing live
Cash to close
- Down payment
- $58,750
- Closing costs
- $7,050
- Reserves months
- —
- Total cash needed
- —
Loan-product check · same deal, 3 products live
Conventional
25% down · 7.5% · 30yr
- Down + closing
- —
- Monthly P&I
- —
- Monthly cashflow
- —
- DSCR
- —
- Eligible?
- —
Personal DTI + credit; lowest rate.
DSCR
20% down · 8.5% · 30yr
- Down + closing
- —
- Monthly P&I
- —
- Monthly cashflow
- —
- DSCR
- —
- Eligible?
- —
No personal income docs; deal must DSCR.
Hard money
10% down · 12.0% · 12mo
- Down + closing
- —
- Monthly P&I
- —
- Monthly cashflow
- —
- DSCR
- —
- Eligible?
- —
Short-term bridge; refi at stabilization.
Rent comps 3 comps
| Address | Beds | Baths | Sqft | Rent | $/sqft | DOM | Units | Dist |
|---|---|---|---|---|---|---|---|---|
| 100 Greenbrier Way Slidell, LA | 1.0–3.0 | 1.0–2.5 | 1160 | $1,945 | $1.68 | 3d | 21 | 0.94mi |
| 1204 Belair Blvd Slidell, LA | 4.0 | 2.5 | 2430 | $2,500 | $1.03 | 4d | 1 | 1.22mi |
| 1382 Bristol Ct Slidell, LA | 3.0 | 2.5 | 2399 | $2,100 | $0.88 | 25d | 1 | 1.31mi |
Listing history 11 events
-
2026-06-21days on market $235,000 Active 15 DOM
-
2026-06-18days on market $235,000 Active 12 DOM
-
2026-06-17days on market $235,000 Active 11 DOM
-
2026-06-16days on market $235,000 Active 10 DOM
-
2026-06-15days on market $235,000 Active 9 DOM
-
2026-06-13days on market $235,000 Active 7 DOM
-
2026-06-10days on market $235,000 Active 4 DOM
-
2026-06-09days on market $235,000 Active 3 DOM
-
2026-06-08days on market $235,000 Active 2 DOM
-
2026-06-07remarks 699-char remark
-
2026-06-07$235,000 Active 1 DOM
ⓘ Source: listings_history table (triggers on properties + properties_extension) + one-shot
backfill from property_details.listing_events for pre-trigger history.
Tax reassessment forecast LA · Resets to sale price
- Current annual tax
- $1,626 · $135/mo
- Projected year-2 tax
- $1,626 · $135/mo
- Expected delta
- $0/yr ($0/mo · 0.0%)
ⓘ Screening estimate from a state-policy table — verify with the county assessor before closing.
Climate risk First Street
- Flood 1/10 Low FEMA zone X · 0% chance over 30 yrs
- Wildfire 4/10 Moderate
- Heat 10/10 Extreme 7 d/yr ≥108°F today · 22 d/yr by 30 yrs out
- Wind 9/10 Extreme 99% chance of damaging wind over 30 yrs
- Air quality 2/10 Low 1 unhealthy d/yr today · 2 by 30 yrs out
Nearby sold comps map
Loading sold comps map…
Walkable amenities ~0.75 mi
Loading nearby amenities…
Taxation est. · year 1
- Rental income
- $25,778
- − Mortgage interest
- −$13,164
- − Property taxes
- −$1,626
- − Insurance
- −$1,175
- − Repairs & maintenance
- −$2,062
- − Management
- −$2,062
- − Depreciation
- −$6,836
- Taxable loss
- −$1,147
- Est. tax savings @ 24.0%
- +$275
- After-tax cash flow
- $3,051/yr
For passive investors: Depreciation is non-cash, so a rental often shows a tax loss while cash-flowing — sheltering income. Rental losses are passive: they offset passive income freely, and up to $25,000/yr can offset ordinary (W-2) income if you actively participate and your MAGI is under $100k (phasing out to $0 by $150k); unused losses carry forward. On sale, claimed depreciation is recaptured at up to 25%, and gains may owe capital-gains tax (a 1031 exchange can defer both). Figures are a year-1 estimate at your 24.0% rate — not tax advice; consult a CPA.
Schools (NCES district)
- District
- St. Tammany Parish
- NCES district ID
- 2201650
- Math proficiency
- 43% ▼ -32.00%
- Reading proficiency
- 55% ▼ -26.00%
- Median HH income
- $61,752
- Composite
- 43.04/100
- National rank
- #3098
- State rank
- #11 of 98 in LA
Livability — Slidell
- Score
- 70/100
- State rank
- #57
- US rank
- #7673
Category grades
Schools grade is shown separately in the Schools card above.
Census & demographics
- County
- Saint Tammany Parish · 228,296 people
- City population
- 95,511
- Metro
- New Orleans-Metairie, LA
- Population (ZIP)
- 21,669
- Household income
- $62,565
- Rent vs Own
- Severe rent burden
- 318.0
Population outlook (St. Tammany County) Hauer SSP2
- Today (2025)
- 286,725 people
- By 2030
- 304,175 · +6.1%
- By 2040
- 336,203 · +17.3%
- By 2050
- 364,590 · +27.2%
- By 2075
- 433,362 · +51.1%
- By 2100
- 470,333 · +64.0%
Race, ethnicity, and origin ACS 2023
- Neighborhood character
- Diverse neighborhood (Simpson 0.62)
- Race & ethnicity
- White 53% Black 29% Two or more races 11% Hispanic / Latino 10% Pacific Islander 2%
- Hispanic origin (detail)
- Mexican 3%
- Common ancestry
- Lithuanian 13% Slovak 1% Italian 1%
- Foreign-born
- 5% · Canada
- Languages at home
- 92% English-only · Spanish 6%
Political lean MEDSL · St. Tammany
- 2024 margin
- Solid R (+43.8) · D 27.3% · R 71.1% · Other 1.6%
- 2008→2024 swing
- +9.6pp toward D · 2008: -53.4pp · 2024: -43.8pp
- All cycles
- 2024: R+43.8 2020: R+44.2 2016: R+50.8 2012: R+52.2 2008: R+53.4
Not yet ingested
- Civics
- —
Market trends
- HPI YoY
- ▼ -93.87%
- Current HPI
- 130.56
- Rent YoY
- ▲ 5.91%
- Metro
- New Orleans-Metairie, LA
- State GDP YoY
- ▲ 3.29%
- F500 in state
- 10
Industry mix (Fortune 500 HQ in LA)
| Industry | F500 HQs | Revenue |
|---|---|---|
| Telecommunications | 2 | $23B |
|
||
| Utilities | 1 | $12B |
|
||
| Wholesale / Distribution | 1 | $5B |
|
||
| Advertising | 1 | $2B |
|
||
Price history
+32.0% since first listed10 events — show timeline
- 2026-06-04 Listed $235,000 GSREIN
- 2026-06-04 Listed $235,000 AcadianaMLS
- 2017-07-05 Sold (Public Records) $165,000 Public Records
- 2017-06-30 Sold (MLS) $165,000 GSREIN
- 2017-06-27 Pending — GSREIN
- 2017-05-19 Contingent — GSREIN
- 2017-05-04 Price Changed $178,000 GSREIN
- 2017-04-10 Price Changed $187,500 GSREIN
- 2017-03-27 Listed $199,000 GSREIN
- 2017-03-27 Listed $178,000 AcadianaMLS
Property tax history
-1.5%/yrLatest (2025): $1,626 · -3.9% YoY. Source: county tax records.
Cash-flow waterfall
monthlySold comps — $/sqft
last 12 mo · ≤1 miLoading sold comps…