100 Heron Bay Rd · Hemlock Farms, PA
Flood risk 1/10 · Minimal
- FEMA flood zone
- X (unshaded)
- Chance of flooding over 30 yrs
- 0.0%
- Est. flood insurance / yr
- $473 – $860
Fire risk 4/10 · Minor
- Est. fire insurance / yr
- $511 – $949
Heat risk 2/10 · Minimal
- Hot days now (above 91°F)
- 7 days/yr
- Hot days in 30 yrs
- 15 days/yr
Wind risk 3/10 · Minor
- Chance of severe wind over 30 yrs
- 6.0%
Air-quality risk 2/10 · Minimal
- Unhealthy air days now
- 1 days/yr
- Unhealthy air days in 30 yrs
- 2 days/yr
Risk factors via First Street. Map © Google.
Why this score? — see what drove the D- grade
The composite is a weighted blend of 9 inputs, each scored 0–100. Each bar is that input's sub-score; the figure is the points it added to the 100-point composite (weight × sub-score).
- Appreciation +10.0/10.0
- Cash flow +8.3/30.0
- Schools +4.2/10.0
- Condition / age +3.8/5.0
- Livability +3.4/5.0
- 1% rule +3.2/10.0
- Rent growth +2.5/5.0
- DSCR +2.3/10.0
- ARV discount +0.0/15.0
$498,000
🖨 Deal sheet (PDF) 📄 Offer letter ✓ Due diligence
Listing remarks
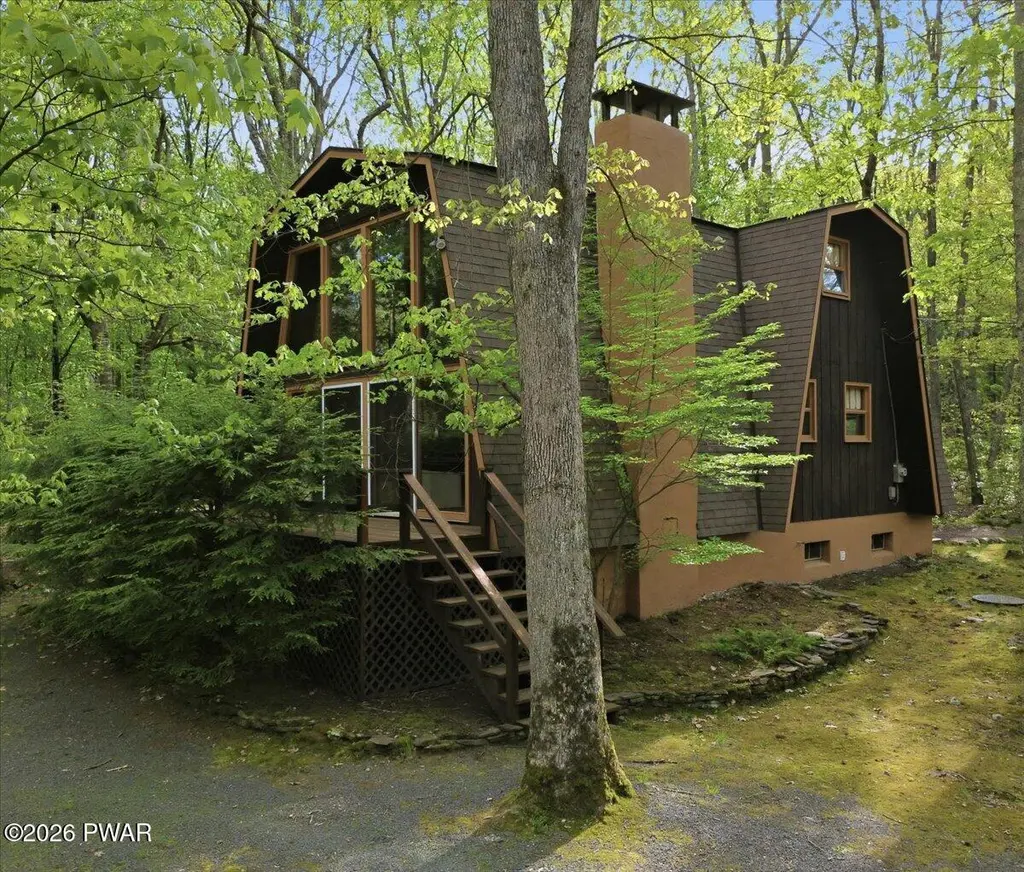
Classic Pocono home, with gambrel roofs, floor to ceiling glass windows with a winter lake view. Real stone fireplace, tongue and grove interior, hardwood floors, built in storage/shelves, this is a quality custom home! It sits on a double lot with matching garage, impeccably maintained, mostly finished basement with large Sauna room. Mature landscaping on a quiet road with central location to Hemlock Amenities.
Key facts
- Real stone fireplace
- Built in storage
- Gambrel roofs
Tags
Property features AI
Finance
- Other: Directions: Take Hemlock Farms Road, turn left on Forest Drive, turn right on Heron Bay to #100
- Financial info: Annual tax amount reported
- HOA & community: Homeowners association with an annual fee of $2,995 (approximately $249.58/month)
Exterior
- Parking: Garage with 1 parking space
- Home design: Single-family residential property in the Hemlock Farms subdivision; 1.1 acre lot; Above-grade finished area and additional finished space below grade
- Construction: Below-grade finished area (basement) exists
- Exterior features: Located on a community lake; Additional parcel included (Lot 16 house and Lot 15 garage)
Interior
- Bathrooms: 2 full bathrooms
- Interior features: Living room fireplace; Finished full basement with storage space; Total of 6 rooms
- Laundry & utility: Laundry room
Neighborhood map
What this means for you Summary
Snapshot
- This is a 2-bed/2.0-bath single-family listed at $498k. Condition is rated good.
Deal economics
- At list price, monthly cash flow is $-456 ($-5k/yr) — negative.
- To cash-flow at today's rent, offer at most $432k (13.2% below list).
- To meet the 1% rule (rent ≥ 1% of price), the offer needs to be $410k (17.8% below list).
- Recommended offer: $410k (17.8% below list) — sets the bar for 1% rule.
- Cap rate 5.2% vs local median 6.9% in Hemlock Farms — below-typical yield; the buyer is paying a premium for something (appreciation thesis, condition, location) that the cap rate doesn't capture.
Location & tenants
- Location reads 68/100 on livability (#884 in PA) — a middle-class / working-renter tenant base. Strengths: crime A+, housing A+, health & safety A+; Watch: amenities F, commute F.
- Wallenpaupack Area SD (rural): math 39% / reading 59% proficiency, ranked #192 of 539 in PA (top 36%) — families likely to look elsewhere, expect single-tenant / working-renter base with shorter leases.
- Zoned schools: Wallenpaupack South El Sch (math 47% / reading 52%, grade D, #654 of 1,518 statewide, top 47%, 255 students, 72% FRL); Wallenpaupack Area Ms (math 23% / reading 57%, grade F, #257 of 512 statewide, top 52%, 644 students, 59% FRL); Wallenpaupack Area Hs (math 74% / reading 67%, grade B+, #48 of 437 statewide, top 11%, 990 students, 62% FRL) — zoned schools average 64% FRL vs 44% district-wide (21 pts higher); higher-poverty schools than district average — tighter screening recommended.
- Market conditions: 375 active listings in the ZIP; 4 comparable units currently listed for rent nearby; rentals leasing fast (median 3d on market — plan ~1-2 weeks tenant-placement turnaround); 213 units permitted in Pike County in 2024 (0 in 5+ unit buildings).
Forward outlook
- In year one you build about $53k of equity ($3k loan paydown + $50k appreciation (10.0% local appreciation)).
- Pike County population projected at -25% by 2050 — secular population decline; favor cash flow + early exit over multi-decade hold.
- By year 2, paydown + projected appreciation supports a ~$86k cash-out refi (75% LTV) — recoverable capital for the next deal without selling this one.
Negotiation context
- It's been on market 32 days — a 3% lower offer ($483k) is reasonable based on typical stale-listing flexibility.
- 2 sale attempts with the ask held roughly flat each time — persistent listings suggest the price (not the market) is what's stuck; bring a comps-based counter.
Questions for the listing agent
- What do current leases actually rent for vs. the listed asking? Can we see a recent rent roll and the last 12 months of T-12 income?
- It's been on market 32 days. Have you received any prior offers? Is the seller open to a 18% concession, seller financing, or rate buy-down credit?
- Built in 1969 — when were the roof, HVAC, electrical panel, plumbing, and water heater last replaced?
- What does the HOA fee cover, when was the last increase, and are there any pending special assessments or reserve-fund shortfalls?
- Is there a deadline driving the sale (1031 exchange, divorce, estate, relocation)? That informs how much negotiation room exists.
- The area grade is low — what's the realistic commute time and amenity access for the typical tenant pool here? Any planned neighborhood developments (good or bad) we should know about?
- What's the average days-on-market for RENTAL listings here right now (not sales)? A rising rental-DOM trend means longer vacancies and softer asking-rent achievability than the comps imply.
- What's the recent tenant-quality profile in this submarket — average credit score on applications, eviction rate, late-payment / NSF rate, and stable-employment percentage? A property-management company in the area should have these aggregated.
- How much new for-sale + rental construction is in the pipeline within 1–3 miles? Heavy new supply typically softens prices + rents 12–24 months out; constrained supply supports both.
Investment metrics
- 1% rule
- 0.82% ✗
- Cap rate
- 5.19%
- Cash-on-cash
- -3.92%
- DSCR
- 0.83
- GRM
- 10.1
CMA / ARV
- ARV (on-the-fly)
- $365,472
- Comps found
- 12
Show comp detail 12 sales within ~0.75 mi
| Address | Dist | Beds/Ba | Sqft | Sold | Price | $/sf | Match |
|---|---|---|---|---|---|---|---|
| 809 Widgeon Ct | 0.21mi | 3/3.0 (+1) | 1,911 (-2%) | 6mo | $730,000 | $382 | 73 |
| 107 Long Spur Ln | 0.38mi | 3/2.5 (+1) | 2,010 (+3%) | 6mo | $430,000 | $214 | 65 |
| 806 Wren Ct | 0.21mi | 3/2.5 (+1) | 2,130 (+10%) | 4mo | $228,000 | $107 | 64 |
| 104 Summer Hill Rd | 0.52mi | 3/2.0 (+1) | 2,064 (+6%) | 1mo | $330,000 | $160 | 60 |
| 803 Fetlock Ct | 0.45mi | 3/2.0 (+1) | 1,837 (-6%) | 7mo | $290,000 | $158 | 59 |
| 107 Rimrock Ln | 0.64mi | 3/2.0 (+1) | 2,000 (+3%) | 5mo | $250,000 | $125 | 56 |
| 125 Broadmoor Dr | 0.44mi | 3/2.5 (+1) | 2,152 (+11%) | 5mo | $335,000 | $156 | 50 |
| 118 Ledgeway Ln | 0.38mi | 3/2.5 (+1) | 1,716 (-12%) | 8mo | $399,999 | $233 | 49 |
| 801 Saddlebrook Spur Spur | 0.52mi | 3/2.0 (+1) | 1,728 (-11%) | 4mo | $550,500 | $319 | 48 |
| 106 Fetlock Dr | 0.38mi | 3/3.0 (+1) | 1,700 (-13%) | 7mo | $255,000 | $150 | 46 |
| 119 Ridgeway Dr | 0.47mi | 3/2.5 (+1) | 1,662 (-14%) | 1mo | $549,000 | $330 | 46 |
| 140 Long Ridge Dr | 0.70mi | 3/2.0 (+1) | 2,153 (+11%) | 11mo | $405,000 | $188 | 35 |
Match score weights: distance 35% · size 25% · config 20% · recency 20%. Top-matched comps best support the ARV.
Projected returns pro-forma
10.0% appreciation · 3.0% rent growth · sell at horizon
- IRR
- 21.5%
- Equity multiple
- 2.74×
- Total profit
- $242,401
- Equity at exit
- $448,638
- IRR
- 19.4%
- Equity multiple
- 6.29×
- Total profit
- $737,095
- Equity at exit
- $967,504
Cash invested: $139,440 (down + closing). Projections, not guarantees.
Landlord ↔ Tenant lean methodology
- Overall (STATE)
- 62 Landlord-Friendly
- State Pennsylvania
- 62 Landlord-Friendly · EVEN
- County
- — inherits STATE
- City
- — inherits STATE
ZIP-level market 18428
- Home prices YoY
- 9.2%
- Active inventory
- 375
- Price-to-rent
- 10.1×
Monthly cashflow live
- Estimated rent
- $4,096 medium interval (Pro) →
- Mortgage (P&I)
- −$2,612
- Tax est. 1.5%
- −$622 /mo · $7,470/yr
- Insurance
- −$208
- HOA
- −$250
- Vacancy / Maint / Mgmt
- −$860
- Net cashflow
- $-456
Break-even live
Sensitivity live
| Price | -10% $-112 | -5% $-284 | +0% $-456 | +5% $-628 | +10% $-800 |
|---|---|---|---|---|---|
| Rent | -10% $-779 | -5% $-618 | +0% $-456 | +5% $-294 | +10% $-132 |
| Rate | -1.0pp $-205 | -0.5pp $-329 | base $-456 | +0.5pp $-585 | +1.0pp $-716 |
UW: 25.0% down · 7.5% · 30yr · 1.5% tax · 5.0% vac · 8.0% maint · 8.0% mgmt
Financing live
Cash to close
- Down payment
- $124,500
- Closing costs
- $14,940
- Reserves months
- —
- Total cash needed
- —
Loan-product check · same deal, 3 products live
Conventional
25% down · 7.5% · 30yr
- Down + closing
- —
- Monthly P&I
- —
- Monthly cashflow
- —
- DSCR
- —
- Eligible?
- —
Personal DTI + credit; lowest rate.
DSCR
20% down · 8.5% · 30yr
- Down + closing
- —
- Monthly P&I
- —
- Monthly cashflow
- —
- DSCR
- —
- Eligible?
- —
No personal income docs; deal must DSCR.
Hard money
10% down · 12.0% · 12mo
- Down + closing
- —
- Monthly P&I
- —
- Monthly cashflow
- —
- DSCR
- —
- Eligible?
- —
Short-term bridge; refi at stabilization.
Rent comps 4 comps
| Address | Beds | Baths | Sqft | Rent | $/sqft | DOM | Units | Dist |
|---|---|---|---|---|---|---|---|---|
| 101 Pommel Dr Hawley, PA | 3.0 | 2.0 | 1691 | $4,400 | $2.60 | 3d | 1 | 0.37mi |
| 402 Canoe Brook Dr Hawley, PA | 3.0 | 2.0 | 2055 | $3,500 | $1.70 | 0d | 1 | 0.96mi |
| 106 Corral Ln Hawley, PA | 3.0 | 2.0 | 2150 | $4,000 | $1.86 | 5d | 1 | 1.13mi |
| 113 Portage Ln Milford, PA | 3.0 | 2.0 | 1400 | $4,000 | $2.86 | 0d | 1 | 1.42mi |
HOA detail
- Monthly dues
- $250 · $3,000/yr
- Likely covers
- landscaping
Listing history 17 events
-
2026-06-21days on market $498,000 Active 32 DOM
-
2026-06-18days on market $498,000 Active 29 DOM
-
2026-06-17days on market $498,000 Active 28 DOM
-
2026-06-16days on market $498,000 Active 27 DOM
-
2026-06-15days on market $498,000 Active 26 DOM
-
2026-06-13days on market $498,000 Active 24 DOM
-
2026-06-13days on market $498,000 Active 23 DOM
-
2026-06-09days on market $498,000 Active 20 DOM
-
2026-06-08days on market $498,000 Active 19 DOM
-
2026-06-07days on market $498,000 Active 18 DOM
-
2026-06-04days on market $498,000 Active 15 DOM
-
2026-06-03days on market $498,000 Active 14 DOM
-
2026-06-02days on market $498,000 Active 13 DOM
-
2026-06-01days on market $498,000 Active 12 DOM
-
2026-05-31days on market $498,000 Active 11 DOM
-
2026-05-22status Active
-
2026-04-24$498,000 Active
ⓘ Source: listings_history table (triggers on properties + properties_extension) + one-shot
backfill from property_details.listing_events for pre-trigger history.
Climate risk First Street
- Flood 1/10 Low FEMA zone X (unshaded) · 0% chance over 30 yrs
- Wildfire 4/10 Moderate
- Heat 2/10 Low 7 d/yr ≥91°F today · 15 d/yr by 30 yrs out
- Wind 3/10 Moderate 6% chance of damaging wind over 30 yrs
- Air quality 2/10 Low 1 unhealthy d/yr today · 2 by 30 yrs out
Nearby sold comps map
Loading sold comps map…
Walkable amenities ~0.75 mi
Loading nearby amenities…
Taxation est. · year 1
- Rental income
- $49,149
- − Mortgage interest
- −$27,896
- − Property taxes
- −$7,470
- − Insurance
- −$2,490
- − Repairs & maintenance
- −$3,932
- − Management
- −$3,932
- − HOA
- −$3,000
- − Depreciation
- −$14,487
- Taxable loss
- −$14,058
- Est. tax savings @ 24.0%
- +$3,374
- After-tax cash flow
- $-2,097/yr
For passive investors: Depreciation is non-cash, so a rental often shows a tax loss while cash-flowing — sheltering income. Rental losses are passive: they offset passive income freely, and up to $25,000/yr can offset ordinary (W-2) income if you actively participate and your MAGI is under $100k (phasing out to $0 by $150k); unused losses carry forward. On sale, claimed depreciation is recaptured at up to 25%, and gains may owe capital-gains tax (a 1031 exchange can defer both). Figures are a year-1 estimate at your 24.0% rate — not tax advice; consult a CPA.
Condition & rehab AI · 12 photos
This charming Pocono home is in good condition with a good rehab level, featuring a well-maintained exterior, hardwood floors, and large windows with a winter lake view. It has potential for further updates to enhance its resale and rental value.
Value-add opportunities
- Resale Paint exterior — Enhances curb appeal and value
- Resale Replace gutters — Improves home's appearance and functionality
- Resale Update kitchen backsplash — Modernizes the space and adds value
- Resale Install new flooring — Enhances the living space and adds value
- Resale Update bathrooms — Modernizes the bathrooms and adds value
Renovation cost estimate screening
Value-add ROI direction
- Resale Paint exterior — Enhances curb appeal and value ↑
- Resale Replace gutters — Improves home's appearance and functionality ↑
- Resale Update kitchen backsplash — Modernizes the space and adds value ↑
- Resale Install new flooring — Enhances the living space and adds value ↑
- Resale Update bathrooms — Modernizes the bathrooms and adds value ↑
ⓘ Cost ranges are severity-bucket heuristics (US national rule-of-thumb). Get contractor quotes + a written scope before underwriting a rehab budget.
Schools (NCES district)
- District
- Wallenpaupack Area SD
- NCES district ID
- 4224750
- Math proficiency
- 39% ▼ -10.00%
- Reading proficiency
- 59% ▼ -5.00%
- Median HH income
- $51,027
- Composite
- 41.97/100
- National rank
- #3345
- State rank
- #192 of 539 in PA
Livability — Hemlock Farms
- Score
- 68/100
- State rank
- #884
- US rank
- #9421
Category grades
Schools grade is shown separately in the Schools card above.
Census & demographics
- Census place
- Hemlock Farms, PA
- Population (ZIP)
- 12,446
Population outlook (Pike County) Hauer SSP2
- Today (2025)
- 53,548 people
- By 2030
- 51,622 · -3.6%
- By 2040
- 46,490 · -13.2%
- By 2050
- 40,372 · -24.6%
- By 2075
- 31,951 · -40.3%
- By 2100
- 26,821 · -49.9%
Race, ethnicity, and origin ACS 2023
- Neighborhood character
- Predominantly White (85%)
- Race & ethnicity
- White 85% Hispanic / Latino 8% Two or more races 6% Black 1% Asian 1%
- Hispanic origin (detail)
- Puerto Rican 5%
- Common ancestry
- Romanian 5% Portuguese 3% Italian 2%
- Foreign-born
- 5% · Canada
- Languages at home
- 91% English-only · Spanish 5% Russian/Polish/Slavic 1% Other Asian/Pacific 1%
Political lean MEDSL · Pike
- 2024 margin
- Strong R (+24.1) · D 37.6% · R 61.6%
- 2008→2024 swing
- -19.8pp toward R · 2008: -4.2pp · 2024: -24.1pp
- All cycles
- 2024: R+24.1 2020: R+19.0 2016: R+26.0 2012: R+11.0 2008: R+4.2
Not yet ingested
- Civics
- —
Market trends
- HPI YoY
- ▲ 28.60%
- Current HPI
- 340.8254
- Rent YoY
- —
- Metro
- —
- State GDP YoY
- ▲ 1.68%
- F500 in state
- 34
Industry mix (Fortune 500 HQ in PA)
| Industry | F500 HQs | Revenue |
|---|---|---|
| Healthcare | 2 | $309B |
|
||
| Insurance | 2 | $27B |
|
||
| Telecommunications / Media | 1 | $124B |
|
||
| Industrial Distribution | 1 | $22B |
|
||
| Financial Services | 1 | $20B |
|
||
| Chemicals / Materials | 1 | $18B |
|
||
Price history
2 events — show timeline
- 2026-05-22 Relisted — PWMLS
- 2026-04-24 Listed $498,000 PWMLS
Cash-flow waterfall
monthlySold comps — $/sqft
last 12 mo · ≤1 miLoading sold comps…