 🏗️ New Construction
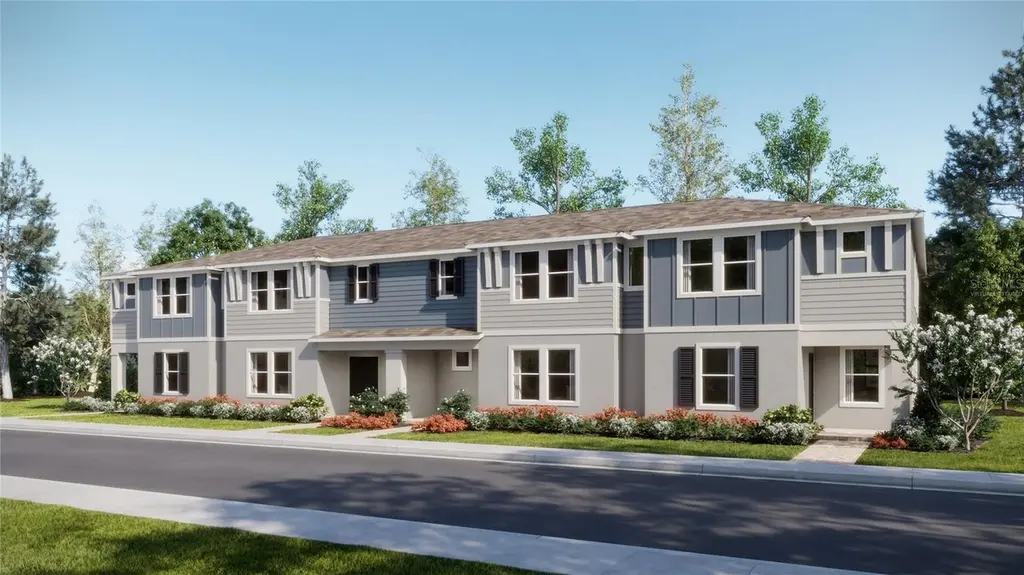
5194 Clay Whaley Rd · St. Cloud, FL
Flood risk No data
- FEMA flood zone
- —
- Chance of flooding over 30 yrs
- —
- Est. flood insurance / yr
- —
Fire risk No data
- Est. fire insurance / yr
- —
Heat risk No data
- Hot days now (above threshold)
- —
- Hot days in 30 yrs
- —
Wind risk No data
- Chance of severe wind over 30 yrs
- —
Air-quality risk No data
- Unhealthy air days now
- —
- Unhealthy air days in 30 yrs
- —
Risk factors via First Street. Map © Google.
Why this score? — see what drove the F grade
The composite is a weighted blend of 9 inputs, each scored 0–100. Each bar is that input's sub-score; the figure is the points it added to the 100-point composite (weight × sub-score).
- Cash flow +8.0/30.0
- ARV discount +7.5/15.0
- Schools +3.6/10.0
- 1% rule +3.4/10.0
- Rent growth +3.1/5.0
- Livability +2.5/5.0
- Condition / age +2.5/5.0
- DSCR +2.1/10.0
- Appreciation +0.0/10.0
$301,500
🖨 Deal sheet 📄 Offer letter ✓ Due diligence
Listing remarks
Under Construction. Welcome to the light & bright Meridian. This new two-story home is host to an inviting open-concept layout on the first floor, blending a modern kitchen, elegant dining room and comfortable living room for a seamless and modern lifestyle. All three bedrooms are located on the second level to maximize comfort and privacy, including a lavish owner’s suite with a full bathroom and walk-in closet. A two-car rear garage completes the home. Every home comes with Lennar’s Everything’s Included® promise, which includes new appliances as well as quartz countertops, and more in the price of your home. The Glades at Crossprairie is one of the most antici
Key facts
- Elegant dining room
- Full bathroom
- Modern kitchen
Tags
Neighborhood map
What this means for you Summary
Snapshot
- This is a 3-bed/2.5-bath land listed at $302k.
Deal economics
- At list price, monthly cash flow is $-303 ($-4k/yr) — negative.
- To cash-flow at today's rent, offer at most $258k (14.5% below list).
- To meet the 1% rule (rent ≥ 1% of price), the offer needs to be $253k (16.2% below list).
- Recommended offer: $253k (16.2% below list) — sets the bar for 1% rule.
- Cap rate 5.1% vs local median 4.0% in St. Cloud — meaningfully above typical; check what's discounted (condition, days-on-market, listing class) to confirm the premium yield is real.
Location & tenants
- Location reads: area grade F — affects rentability + tenant quality, not the cash-flow math above.
- Osceola (suburban): math 39% / reading 45% proficiency, ranked #60 of 73 in FL (top 82%) — families likely to look elsewhere, expect single-tenant / working-renter base with shorter leases; 60% free/reduced lunch — lower-income household profile, screen leases tightly.
- Zoned schools: Neptune Elementary School (math 42% / reading 44%, grade F, #1,366 of 2,144 statewide, top 64%, 993 students, 46% FRL); St. Cloud High School (math 32% / reading 50%, grade F, #289 of 667 statewide, top 44%, 2,264 students, 51% FRL).
- Market conditions: Rents rising (+2.3%/yr); 868 active listings in the ZIP; 29 comparable units currently listed for rent nearby; rentals at typical pace (median 24d on market — plan ~3-4 weeks tenant-placement turnaround); solid renter incomes; 8,813 units permitted in Osceola County in 2024 (3,072 in 5+ unit buildings).
- This rent runs 31% of the median local income ($98k/yr) — at the standard rent-burdened threshold; future hikes will face affordability resistance.
Forward outlook
- Local home prices are declining (-3.0%/yr); year-one equity from $2k of loan paydown is wiped out by about $9k of value loss. Plan a longer hold.
- Osceola County population projected at +73% by 2050 — long-run rental-demand tailwind backs the buy-and-hold thesis.
Negotiation context
- Only 7 days on market — expect competitive offers; lowballing is unlikely to land.
Questions for the listing agent
- What do current leases actually rent for vs. the listed asking? Can we see a recent rent roll and the last 12 months of T-12 income?
- What does the HOA fee cover, when was the last increase, and are there any pending special assessments or reserve-fund shortfalls?
- Is there a deadline driving the sale (1031 exchange, divorce, estate, relocation)? That informs how much negotiation room exists.
- The area grade is low — what's the realistic commute time and amenity access for the typical tenant pool here? Any planned neighborhood developments (good or bad) we should know about?
- What's the average days-on-market for RENTAL listings here right now (not sales)? A rising rental-DOM trend means longer vacancies and softer asking-rent achievability than the comps imply.
- What's the recent tenant-quality profile in this submarket — average credit score on applications, eviction rate, late-payment / NSF rate, and stable-employment percentage? A property-management company in the area should have these aggregated.
- How much new for-sale + rental construction is in the pipeline within 1–3 miles? Heavy new supply typically softens prices + rents 12–24 months out; constrained supply supports both.
Investment metrics
- 1% rule
- 0.84% ✗
- Cap rate
- 5.09%
- Cash-on-cash
- -4.30%
- DSCR
- 0.81
- GRM
- 9.9
CMA / ARV
No comps found within radius.
Projected returns pro-forma
-3.0% appreciation · 2.3% rent growth · sell at horizon
- IRR
- -24.4%
- Equity multiple
- 0.17×
- Total profit
- $-69,730
- Equity at exit
- $44,955
- IRR
- -21.9%
- Equity multiple
- -0.09×
- Total profit
- $-92,002
- Equity at exit
- $26,068
Cash invested: $84,420 (down + closing). Projections, not guarantees.
Landlord ↔ Tenant lean methodology
- Overall (STATE)
- 87 Strongly Landlord-Friendly
- State Florida
- 87 Strongly Landlord-Friendly · R+3
- County
- — inherits STATE
- City
- — inherits STATE
ZIP-level market 34772
- Home prices YoY
- -32.5%
- Rents YoY
- 2.3%
- Active inventory
- 868
- Price-to-rent
- 9.9×
Monthly cashflow live
- Estimated rent
- $2,528 high interval (Pro) →
- Mortgage (P&I)
- −$1,581
- Tax est. 1.5%
- −$377 /mo · $4,522/yr
- Insurance
- −$126
- HOA
- −$216
- Vacancy / Maint / Mgmt
- −$531
- Net cashflow
- $-303
Break-even live
UW: 25.0% down · 7.5% · 30yr · 1.5% tax · 5.0% vac · 8.0% maint · 8.0% mgmt
Financing live
Cash to close
- Down payment
- $75,375
- Closing costs
- $9,045
- Reserves months
- —
- Total cash needed
- —
Loan-product check · same deal, 3 products live
Conventional
25% down · 7.5% · 30yr
- Down + closing
- —
- Monthly P&I
- —
- Monthly cashflow
- —
- DSCR
- —
- Eligible?
- —
Personal DTI + credit; lowest rate.
DSCR
20% down · 8.5% · 30yr
- Down + closing
- —
- Monthly P&I
- —
- Monthly cashflow
- —
- DSCR
- —
- Eligible?
- —
No personal income docs; deal must DSCR.
Hard money
10% down · 12.0% · 12mo
- Down + closing
- —
- Monthly P&I
- —
- Monthly cashflow
- —
- DSCR
- —
- Eligible?
- —
Short-term bridge; refi at stabilization.
Rent comps 29 comps
| Address | Beds | Baths | Sqft | Rent | $/sqft | DOM | Units | Dist |
|---|---|---|---|---|---|---|---|---|
| 5176 Clay Whaley Rd Saint Cloud, FL | 3.0 | 2.5 | 1664 | $2,350 | $1.41 | 22d | 1 | 0.03mi |
| 5174 Clay Whaley Rd Saint Cloud, FL | 3.0 | 2.5 | 1664 | $2,290 | $1.38 | 24d | 1 | 0.03mi |
| 5172 Clay Whaley Rd Saint Cloud, FL | 3.0 | 2.5 | 1823 | $2,240 | $1.23 | 13d | 1 | 0.04mi |
| 5191 Loyalty Dr Saint Cloud, FL | 3.0 | 2.5 | 1782 | $2,250 | $1.26 | 24d | 1 | 0.05mi |
| 5195 Loyalty Dr Saint Cloud, FL | 4.0 | 2.5 | 2071 | $2,750 | $1.33 | 24d | 1 | 0.05mi |
| 5151 Loyalty Dr Saint Cloud, FL | 4.0 | 2.5 | 2071 | $2,750 | $1.33 | 24d | 1 | 0.08mi |
| 5115 Loyalty Dr Saint Cloud, FL | 4.0 | 2.5 | 2071 | $2,490 | $1.20 | 15d | 1 | 0.12mi |
| 5107 Loyalty Dr Saint Cloud, FL | 4.0 | 2.5 | 2071 | $2,500 | $1.21 | 22d | 1 | 0.13mi |
| 5100 Clay Whaley Rd Unit 5100 St Cloud, FL | 3.0 | 2.5 | 1823 | $2,250 | $1.23 | 24d | 1 | 0.13mi |
| 5134 Arrowfeather Ct Saint Cloud, FL | 3.0 | 2.0 | 1825 | $2,350 | $1.29 | 17d | 1 | 0.21mi |
| 5134 Arrowfeather Ct Unit A St Cloud, FL | 3.0 | 2.0 | 1825 | $2,350 | $1.29 | 16d | 1 | 0.21mi |
| 5153 Natalia Dr Saint Cloud, FL | 4.0 | 3.0 | 2175 | $2,900 | $1.33 | 24d | 1 | 0.22mi |
| 4377 Vibernum Ave Unit A St Cloud, FL | 3.0 | 2.0 | 1825 | $2,400 | $1.32 | 24d | 1 | 0.27mi |
| 5161 Marlberry Ct Saint Cloud, FL | 4.0 | 2.5 | 2071 | $2,500 | $1.21 | 3d | 1 | 0.27mi |
| 4371 Vibernum Ave Unit A St Cloud, FL | 3.0 | 2.0 | 1825 | $2,400 | $1.32 | 24d | 1 | 0.27mi |
| 4512 Homestead Trl Saint Cloud, FL | 4.0 | 2.5 | 2114 | $2,550 | $1.21 | 24d | 1 | 1.06mi |
| 4632 Homestead Trl Saint Cloud, FL | 4.0 | 2.5 | 2104 | $2,500 | $1.19 | 24d | 1 | 1.11mi |
| 4658 Homestead Trl Saint Cloud, FL | 4.0 | 2.5 | 2114 | $2,500 | $1.18 | 17d | 1 | 1.14mi |
| 4704 Homestead Trl Saint Cloud, FL | 4.0 | 2.5 | 2011 | $2,600 | $1.29 | 11d | 1 | 1.23mi |
| 4724 Homestead Trl Saint Cloud, FL | 4.0 | 2.5 | 2114 | $2,550 | $1.21 | 24d | 1 | 1.26mi |
| 4651 Sidesaddle Trl Saint Cloud, FL | 3.0 | 2.0 | 1695 | $2,195 | $1.29 | 17d | 1 | 1.26mi |
| 4536 Burrowing Owl Loop Saint Cloud, FL | 3.0 | 2.5 | 1808 | $2,650 | $1.47 | 24d | 1 | 1.31mi |
| 4501 Burrowing Owl Loop Saint Cloud, FL | 3.0 | 2.5 | 1560 | $2,200 | $1.41 | 17d | 1 | 1.31mi |
| 4329 Eagle Trail Bnd Saint Cloud, FL | 3.0 | 2.5 | 1560 | $2,100 | $1.35 | 22d | 1 | 1.38mi |
| 4469 Eagle Trail Bnd Saint Cloud, FL | 3.0 | 2.5 | 1566 | $2,200 | $1.40 | 24d | 1 | 1.41mi |
| 4367 Ranch House Rd Saint Cloud, FL | 3.0 | 2.5 | 1560 | $2,050 | $1.31 | 24d | 1 | 1.42mi |
| 4358 Restful Fallow Cv Saint Cloud, FL | 3.0 | 2.5 | 1560 | $2,300 | $1.47 | 24d | 1 | 1.43mi |
| 4348 Ranch House Rd Saint Cloud, FL | 3.0 | 2.5 | 1808 | $2,200 | $1.22 | 24d | 1 | 1.44mi |
| 4346 Restful Fallow Cv Saint Cloud, FL | 3.0 | 2.5 | 1560 | $2,300 | $1.47 | 24d | 1 | 1.44mi |
HOA detail
- Monthly dues
- $216 · $2,592/yr
Listing history 3 events
-
2026-04-23status Pending
-
2026-04-20price $301,500
-
2026-04-16$300,500 Active
ⓘ Source: listings_history table (triggers on properties + properties_extension) + one-shot
backfill from property_details.listing_events for pre-trigger history.
Nearby sold comps map
Loading sold comps map…
Walkable amenities ~0.75 mi
Loading nearby amenities…
Taxation est. · year 1
- Rental income
- $30,333
- − Mortgage interest
- −$16,889
- − Property taxes
- −$4,522
- − Insurance
- −$1,508
- − Repairs & maintenance
- −$2,427
- − Management
- −$2,427
- − HOA
- −$2,592
- − Depreciation
- −$8,771
- Taxable loss
- −$8,802
- Est. tax savings @ 24.0%
- +$2,112
- After-tax cash flow
- $-1,520/yr
For passive investors: Depreciation is non-cash, so a rental often shows a tax loss while cash-flowing — sheltering income. Rental losses are passive: they offset passive income freely, and up to $25,000/yr can offset ordinary (W-2) income if you actively participate and your MAGI is under $100k (phasing out to $0 by $150k); unused losses carry forward. On sale, claimed depreciation is recaptured at up to 25%, and gains may owe capital-gains tax (a 1031 exchange can defer both). Figures are a year-1 estimate at your 24.0% rate — not tax advice; consult a CPA.
Schools (NCES district)
- District
- Osceola
- NCES district ID
- 1201470
- Math proficiency
- 39% ▼ -9.00%
- Reading proficiency
- 45% ▼ -4.00%
- Median HH income
- $45,528
- Composite
- 35.7/100
- National rank
- #4865
- State rank
- #60 of 73 in FL
Livability — St. Cloud
No livability data for this city. (Only ~50 U.S. cities are tracked.)
Census & demographics
- Census place
- St. Cloud, FL
- County
- Osceola County · 410,217 people
- City population
- 29,247
- Metro
- Orlando-Kissimmee-Sanford, FL
- Population (ZIP)
- 35,390
- Household income
- $97,868
- Rent vs Own
- Severe rent burden
- 443.0
Population outlook (Osceola County) Hauer SSP2
- Today (2025)
- 447,624 people
- By 2030
- 511,823 · +14.3%
- By 2040
- 642,986 · +43.6%
- By 2050
- 774,552 · +73.0%
- By 2075
- 1,078,144 · +140.9%
- By 2100
- 1,269,660 · +183.6%
Race, ethnicity, and origin ACS 2023
- Neighborhood character
- Diverse neighborhood (Simpson 0.62)
- Race & ethnicity
- White 44% Hispanic / Latino 44% Two or more races 19% Black 4% Asian 2%
- Hispanic origin (detail)
- Puerto Rican 20% Cuban 2% Dominican 6%
- Common ancestry
- Lithuanian 2% Slovak 1% Iranian 1%
- Foreign-born
- 18% · Canada, Jamaica
- Languages at home
- 60% English-only · Spanish 36% German/W. Germanic 1% Other Indo-European 1%
Political lean MEDSL · Osceola
- 2024 margin
- Toss-up / Even · D 48.7% · R 50.2% · Other 1.1%
- 2008→2024 swing
- -21.2pp toward R · 2008: 19.7pp · 2024: -1.4pp
- All cycles
- 2024: R+1.4 2020: D+13.8 2016: D+25.0 2012: D+24.5 2008: D+19.7
Not yet ingested
- Civics
- —
Market trends
- HPI YoY
- ▼ -132.55%
- Current HPI
- 274.6517
- Rent YoY
- ▲ 2.30%
- Metro
- Orlando-Kissimmee-Sanford, FL
- State GDP YoY
- ▲ 3.28%
- F500 in state
- 36
Industry mix (Fortune 500 HQ in FL)
| Industry | F500 HQs | Revenue |
|---|---|---|
| Industrial Technology | 2 | $29B |
|
||
| Insurance | 2 | $17B |
|
||
| Retail | 1 | $60B |
|
||
| Technology Distribution | 1 | $58B |
|
||
| Homebuilding | 1 | $35B |
|
||
| Technology Manufacturing | 1 | $35B |
|
||
Price history
+0.3% since first listed3 events — show timeline
- 2026-04-23 Pending — Stellar MLS as Distributed by MLS Grid
- 2026-04-20 Price Changed $301,500 Stellar MLS as Distributed by MLS Grid
- 2026-04-16 Listed $300,500 Stellar MLS as Distributed by MLS Grid
Cash-flow waterfall
monthlySold comps — $/sqft
last 12 mo · ≤1 miLoading sold comps…