165 Newbury #7 · Peabody, MA
Flood risk 1/10 · Minimal
- FEMA flood zone
- X (unshaded)
- Chance of flooding over 30 yrs
- 0.0%
- Est. flood insurance / yr
- $507 – $1,088
Fire risk 1/10 · Minimal
- Est. fire insurance / yr
- $915 – $1,699
Heat risk 5/10 · Moderate
- Hot days now (above 97°F)
- 7 days/yr
- Hot days in 30 yrs
- 15 days/yr
Wind risk 6/10 · Moderate
- Chance of severe wind over 30 yrs
- 64.0%
Air-quality risk 3/10 · Minor
- Unhealthy air days now
- 3 days/yr
- Unhealthy air days in 30 yrs
- 3 days/yr
Risk factors via First Street. Map © Google.
Why this score? — see what drove the C grade
The composite is a weighted blend of 9 inputs, each scored 0–100. Each bar is that input's sub-score; the figure is the points it added to the 100-point composite (weight × sub-score).
- Cash flow +27.4/30.0
- DSCR +9.6/10.0
- 1% rule +7.5/10.0
- Condition / age +5.0/5.0
- Livability +4.0/5.0
- Schools +3.1/10.0
- Rent growth +2.3/5.0
- ARV discount +0.0/15.0
- Appreciation +0.0/10.0
$249,900
🖨 Deal sheet (PDF) 📄 Offer letter ✓ Due diligence
Listing remarks
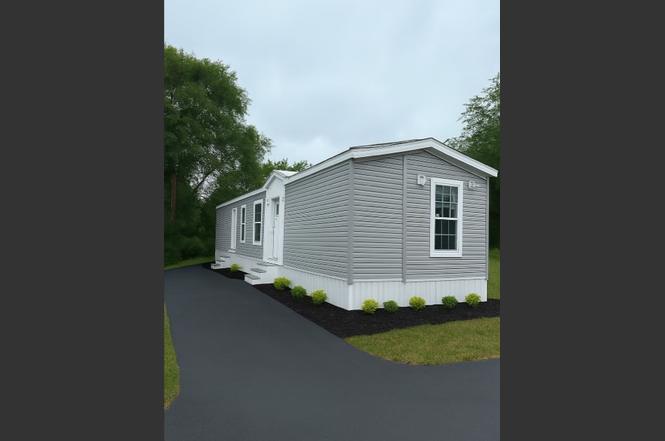
NEW CONSTRUCTION IN PEABODY NEWEST DEVELOPMENT GREAT PRICE FOR BRAND NEW UNIT WITH 2 BEDROOMS AND 2 FULL BATHS, LITTLE TRAILOR PARK SPECTACULAR BRAND NEW HOME IN A BEAUTIFUL NEW DEVELOPMENT IN PEABODY. THIS SPACIOUS 2 BEDROOM 2 BATH UNIT FEATURES A BRIGHT OPEN LAYOUT, A NCELY LANDSCAPED YARD, PARKING AND MUCH MORE. .QUALITY THROUOUT THIS NEW HOME. DONT MISS OUT ON THIS INCREDIBLE OPPORTUNITY PARK RENT ONLY 179 A MONTH INCLUDES, TAXES, WATER AND SEWER , RUBBISH REMOVAL, SNOW PLOWING AND COMMON AREA MAINTENANCE. 64X14 TITAN ASCEND THIS IS AS GOOD AS IT GETS IN PEABODY. . ROOM SIZES APPROX. SOME PHOTOS ARE NOT OF ACTUAL UNIT. .. ONE YEARS MANUFACTURES WARRANTY INCLUDED
Key facts
- New construction
- Landscaped yard
- Parking
Tags
Property features AI
Finance
- HOA & community: Community offers public transportation, shopping, tennis courts, parks, walk/jog trails, stables, golf, medical facility, laundromat, conservation area, highway access, and schools
Exterior
- Parking: 2 open/off-street parking spaces
- Utilities: Public water; Public sewer; Electric with circuit breakers
- Home design: Mobile Home; Single-level (entry at first floor)
- Construction: Approximately built (year source: owner); Irregular foundation
- Exterior features: Public road frontage; Paved driveway and off-street open parking
Interior
- Kitchen: Range; Dishwasher; Refrigerator
- Bedrooms: Master bedroom on the first floor (approx. 12 x 13); Second bedroom on the first floor (approx. 11 x 12); Additional bedroom on the first floor
- Bathrooms: 2 full bathrooms; Master bathroom included
- Heating & cooling: Forced air heating; Propane heating
- Interior features: Total of 4 rooms
Neighborhood map
What this means for you Summary
Snapshot
- This is a 2-bed/2.0-bath manufactured listed at $250k. Condition is rated excellent.
Deal economics
- At list price, monthly cash flow is $734 ($9k/yr) — positive.
- The deal already cash-flows at list — no discount required.
- Meets the 1% rule at list price ($3k rent vs $250k).
- Cap rate 9.8% vs local median 3.4% in Peabody — top-decile yield for the area; either an underpriced asset or a hidden risk that comps aren't pricing in. Stress-test before assuming the spread holds.
Location & tenants
- Location reads 79/100 on livability (#44 in MA, #2,070 nationally) — a middle-class / working-renter tenant base. Strengths: commute A+, employment A+, health & safety A+; Watch: amenities D+, cost of living F.
- Peabody (suburban): math 29% / reading 40% proficiency, ranked #233 of 302 in MA (top 77%) — families likely to look elsewhere, expect single-tenant / working-renter base with shorter leases.
- Zoned schools: J Henry Higgins Middle (math 28% / reading 36%, grade F, #199 of 305 statewide, top 66%, 1,346 students, 0% FRL); Peabody Veterans Memorial High (math 46% / reading 59%, grade C-, #173 of 343 statewide, top 51%, 1,476 students, 0% FRL) — zoned schools average 0% FRL vs 30% district-wide (30 pts lower); this property's tenant base skews higher-income than the district average.
- Market conditions: Rents soft (-0.9%/yr); 48 active listings in the ZIP; 6 comparable units currently listed for rent nearby; rentals leasing fast (median 0d on market — plan ~1-2 weeks tenant-placement turnaround); solid renter incomes; 1,032 units permitted in Essex County in 2024 (590 in 5+ unit buildings).
- This rent runs 39% of the median local income ($97k/yr) — at the standard rent-burdened threshold; future hikes will face affordability resistance.
Forward outlook
- Local home prices are declining (-3.0%/yr); year-one equity from $2k of loan paydown is wiped out by about $7k of value loss. Plan a longer hold.
- Essex County population projected at +15% by 2050 — long-run rental-demand tailwind backs the buy-and-hold thesis.
Negotiation context
- Only 10 days on market — expect competitive offers; lowballing is unlikely to land.
Risks & watch-outs
- Climate carrying-cost: major wind risk, 64% chance of damaging wind over 30y; extreme-heat days projected 7→15/yr by 2055 (HVAC capex compounding) — expect insurance premiums to compound above CPI over the hold.
Questions for the listing agent
- Is there a deadline driving the sale (1031 exchange, divorce, estate, relocation)? That informs how much negotiation room exists.
- What's the average days-on-market for RENTAL listings here right now (not sales)? A rising rental-DOM trend means longer vacancies and softer asking-rent achievability than the comps imply.
- What's the recent tenant-quality profile in this submarket — average credit score on applications, eviction rate, late-payment / NSF rate, and stable-employment percentage? A property-management company in the area should have these aggregated.
- How much new for-sale + rental construction is in the pipeline within 1–3 miles? Heavy new supply typically softens prices + rents 12–24 months out; constrained supply supports both.
Investment metrics
- 1% rule
- 1.25% ✓
- Cap rate
- 9.82%
- Cash-on-cash
- 12.59%
- DSCR
- 1.56
- GRM
- 6.7
CMA / ARV
- ARV (on-the-fly)
- $191,400
- Comps found
- 3
Show comp detail 3 sales within ~0.75 mi
| Address | Dist | Beds/Ba | Sqft | Sold | Price | $/sf | Match |
|---|---|---|---|---|---|---|---|
| 165 Newbury #5 | 0.00mi | 2/2.0 | 870 (0%) | 5mo | $269,900 | $310 | 96 |
| 165 Newbury St #2 | 0.00mi | 3/1.0 (+1) | 930 (+7%) | 5mo | $143,000 | $154 | 75 |
| 161 Newbury St #11 | 0.09mi | 2/1.0 | 1,000 (+15%) | 16mo | $220,000 | $220 | 53 |
Match score weights: distance 35% · size 25% · config 20% · recency 20%. Top-matched comps best support the ARV.
Projected returns pro-forma
-3.0% appreciation · 0.0% rent growth · sell at horizon
- IRR
- -1.1%
- Equity multiple
- 0.96×
- Total profit
- $-2,813
- Equity at exit
- $37,261
- IRR
- 5.1%
- Equity multiple
- 1.32×
- Total profit
- $22,673
- Equity at exit
- $21,607
Cash invested: $69,972 (down + closing). Projections, not guarantees.
Landlord ↔ Tenant lean methodology
- Overall (STATE)
- 20 Strongly Tenant-Friendly
- State Massachusetts
- 20 Strongly Tenant-Friendly · D+15
- County
- — inherits STATE
- City
- — inherits STATE
ZIP-level market 01960
- Rents YoY
- -0.9%
- Active inventory
- 48
- Price-to-rent
- 6.7×
Monthly cashflow live
- Estimated rent
- $3,116 high interval (Pro) →
- Mortgage (P&I)
- −$1,311
- Tax est. 1.5%
- −$312 /mo · $3,748/yr
- Insurance
- −$104
- HOA
- −$0
- Vacancy / Maint / Mgmt
- −$654
- Net cashflow
- $734
Break-even live
Sensitivity live
| Price | -10% $907 | -5% $821 | +0% $734 | +5% $648 | +10% $562 |
|---|---|---|---|---|---|
| Rent | -10% $488 | -5% $611 | +0% $734 | +5% $857 | +10% $980 |
| Rate | -1.0pp $860 | -0.5pp $798 | base $734 | +0.5pp $669 | +1.0pp $604 |
UW: 25.0% down · 7.5% · 30yr · 1.5% tax · 5.0% vac · 8.0% maint · 8.0% mgmt
Financing live
Cash to close
- Down payment
- $62,475
- Closing costs
- $7,497
- Reserves months
- —
- Total cash needed
- —
Loan-product check · same deal, 3 products live
Conventional
25% down · 7.5% · 30yr
- Down + closing
- —
- Monthly P&I
- —
- Monthly cashflow
- —
- DSCR
- —
- Eligible?
- —
Personal DTI + credit; lowest rate.
DSCR
20% down · 8.5% · 30yr
- Down + closing
- —
- Monthly P&I
- —
- Monthly cashflow
- —
- DSCR
- —
- Eligible?
- —
No personal income docs; deal must DSCR.
Hard money
10% down · 12.0% · 12mo
- Down + closing
- —
- Monthly P&I
- —
- Monthly cashflow
- —
- DSCR
- —
- Eligible?
- —
Short-term bridge; refi at stabilization.
Rent comps 6 comps
| Address | Beds | Baths | Sqft | Rent | $/sqft | DOM | Units | Dist |
|---|---|---|---|---|---|---|---|---|
| 128 Newbury St Peabody, MA | 3.0 | 1.0–2.0 | 955 | $3,554 | $3.72 | 0d | 14 | 0.42mi |
| 7 Dearborn Rd Peabody, MA | 1.0–2.0 | 1.0–2.0 | 1105 | $3,632 | $3.29 | 0d | 13 | 1.07mi |
| 2 Hotel Ave Peabody, MA | 1.0–3.0 | 1.0–2.0 | 1050 | $2,975 | $2.83 | 0d | 3 | 1.10mi |
| 286 Newbury St Unit 114 Peabody, MA | 3.0 | 1.0 | 1100 | $2,400 | $2.18 | 45d | 1 | 1.12mi |
| 1000 Crane Brook Way Peabody, MA | 1.0–3.0 | 1.0–2.0 | 1136 | $3,184 | $2.80 | 0d | 23 | 1.14mi |
| 19 Magnolia Way Peabody, MA | 1.0–3.0 | 1.0–2.0 | 1034 | $3,248 | $3.14 | 0d | 29 | 1.18mi |
Listing history 8 events
-
2026-06-21days on market $249,900 Active 10 DOM
-
2026-06-18days on market $249,900 Active 7 DOM
-
2026-06-17days on market $249,900 Active 6 DOM
-
2026-06-16days on market $249,900 Active 5 DOM
-
2026-06-15statusdays on market $249,900 Active 4 DOM
-
2026-06-13days on market $249,900 New 2 DOM
-
2026-06-13remarks 684-char remark
-
2026-06-13$249,900 New 1 DOM
ⓘ Source: listings_history table (triggers on properties + properties_extension) + one-shot
backfill from property_details.listing_events for pre-trigger history.
Climate risk First Street
- Flood 1/10 Low FEMA zone X (unshaded) · 0% chance over 30 yrs
- Wildfire 1/10 Low
- Heat 5/10 Major 7 d/yr ≥97°F today · 15 d/yr by 30 yrs out
- Wind 6/10 Major 64% chance of damaging wind over 30 yrs
- Air quality 3/10 Moderate 3 unhealthy d/yr today · 3 by 30 yrs out
Nearby sold comps map
Loading sold comps map…
Walkable amenities ~0.75 mi
Loading nearby amenities…
Taxation est. · year 1
- Rental income
- $37,386
- − Mortgage interest
- −$13,998
- − Property taxes
- −$3,748
- − Insurance
- −$1,250
- − Repairs & maintenance
- −$2,991
- − Management
- −$2,991
- − Depreciation
- −$7,270
- Taxable income
- $5,138
- Est. tax owed @ 24.0%
- −$1,233
- After-tax cash flow
- $7,578/yr
For passive investors: Depreciation is non-cash, so a rental often shows a tax loss while cash-flowing — sheltering income. Rental losses are passive: they offset passive income freely, and up to $25,000/yr can offset ordinary (W-2) income if you actively participate and your MAGI is under $100k (phasing out to $0 by $150k); unused losses carry forward. On sale, claimed depreciation is recaptured at up to 25%, and gains may owe capital-gains tax (a 1031 exchange can defer both). Figures are a year-1 estimate at your 24.0% rate — not tax advice; consult a CPA.
Condition & rehab AI · 13 photos
This manufactured home is in excellent condition with modern finishes and a well-maintained exterior. Minor touch-ups to the exterior siding and landscaping could further enhance its appeal.
Value-add opportunities
- Resale Painting the exterior siding — Fresh paint can enhance curb appeal and property value
- Rental Landscaping improvements — A well-maintained yard can attract more renters and increase rental value
Renovation cost estimate screening
Value-add ROI direction
- Resale Painting the exterior siding — Fresh paint can enhance curb appeal and property value ↑
- Rental Landscaping improvements — A well-maintained yard can attract more renters and increase rental value ↑
ⓘ Cost ranges are severity-bucket heuristics (US national rule-of-thumb). Get contractor quotes + a written scope before underwriting a rehab budget.
Schools (NCES district)
- District
- Peabody
- NCES district ID
- 2509360
- Math proficiency
- 29% ▼ -13.00%
- Reading proficiency
- 40% ▼ -5.00%
- Median HH income
- $64,022
- Composite
- 31.23/100
- National rank
- #6033
- State rank
- #233 of 302 in MA
Livability — Peabody
- Score
- 79/100
- State rank
- #44
- US rank
- #2070
Category grades
Schools grade is shown separately in the Schools card above.
Census & demographics
- Census place
- Peabody, MA
- County
- Essex County · 632,995 people
- City population
- 54,474
- Metro
- Boston-Cambridge-Newton, MA-NH
- Population (ZIP)
- 54,474
- Household income
- $96,501
- Rent vs Own
- Severe rent burden
- 2570.0
Population outlook (Essex County) Hauer SSP2
- Today (2025)
- 840,920 people
- By 2030
- 872,201 · +3.7%
- By 2040
- 927,918 · +10.3%
- By 2050
- 970,206 · +15.4%
- By 2075
- 1,077,993 · +28.2%
- By 2100
- 1,103,053 · +31.2%
Race, ethnicity, and origin ACS 2023
- Neighborhood character
- Predominantly White (77%)
- Race & ethnicity
- White 77% Hispanic / Latino 12% Two or more races 10% Black 4% Asian 2%
- Hispanic origin (detail)
- Puerto Rican 2% Dominican 6%
- Common ancestry
- Russian 6% Lithuanian 4% Romanian 3%
- Foreign-born
- 17% · Canada, China
- Languages at home
- 76% English-only · Other Indo-European 11% Spanish 8% French/Haitian/Cajun 2%
Political lean MEDSL · Essex
- 2024 margin
- Strong D (+20.3) · D 59.2% · R 38.9% · Other 1.9%
- 2008→2024 swing
- 0.0pp no change · 2008: 20.3pp · 2024: 20.3pp
- All cycles
- 2024: D+20.3 2020: D+29.1 2016: D+22.5 2012: D+16.2 2008: D+20.3
Not yet ingested
- Civics
- —
Market trends
- HPI YoY
- ▼ -565.60%
- Current HPI
- 285.9699
- Rent YoY
- ▼ -0.91%
- Metro
- Boston-Cambridge-Newton, MA-NH
- State GDP YoY
- ▲ 2.28%
- F500 in state
- 38
Industry mix (Fortune 500 HQ in MA)
| Industry | F500 HQs | Revenue |
|---|---|---|
| Technology | 3 | $17B |
|
||
| Insurance | 2 | $84B |
|
||
| Retail | 2 | $76B |
|
||
| Life Sciences | 1 | $43B |
|
||
| Energy Technology | 1 | $31B |
|
||
| Aerospace / Defense | 1 | $18B |
|
||
Price history
1 event — show timeline
- 2026-06-11 Listed $249,900 MLS PIN
Cash-flow waterfall
monthlySold comps — $/sqft
last 12 mo · ≤1 miLoading sold comps…