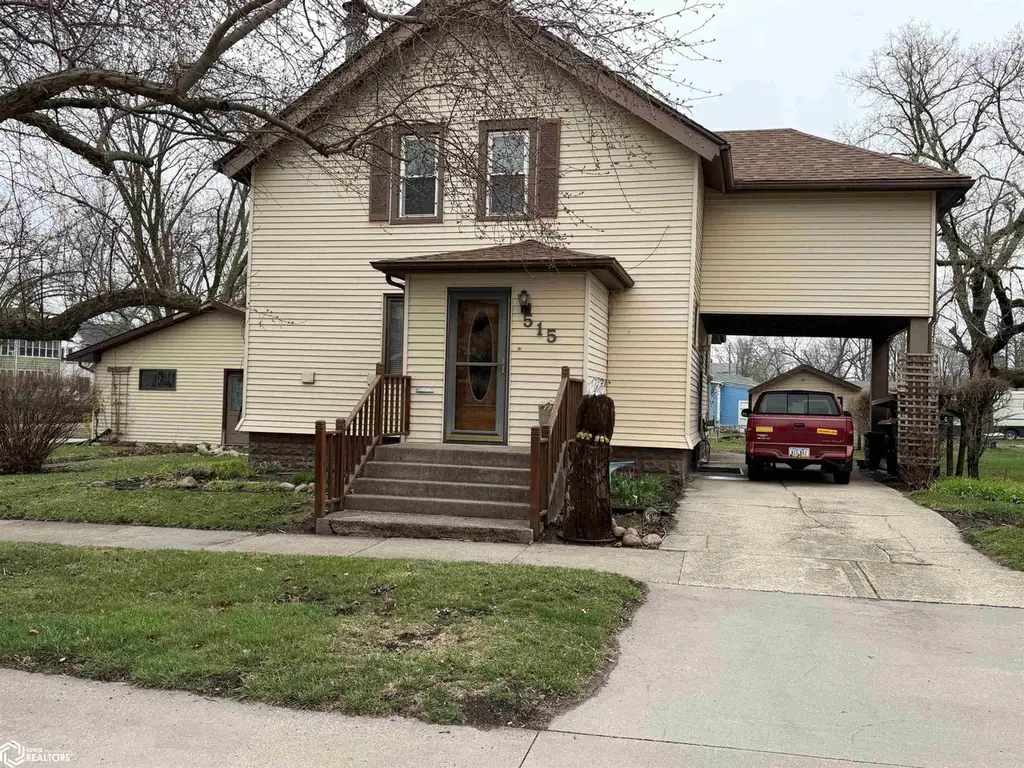
515 NW 3rd St · Eagle Grove, IA
Flood risk 1/10 · Minimal
- FEMA flood zone
- X (unshaded)
- Chance of flooding over 30 yrs
- 0.0%
- Est. flood insurance / yr
- $473 – $860
Fire risk 1/10 · Minimal
- Est. fire insurance / yr
- $902 – $1,676
Heat risk 2/10 · Minimal
- Hot days now (above 100°F)
- 7 days/yr
- Hot days in 30 yrs
- 16 days/yr
Wind risk 2/10 · Minimal
- Chance of severe wind over 30 yrs
- —
Air-quality risk 1/10 · Minimal
- Unhealthy air days now
- 0 days/yr
- Unhealthy air days in 30 yrs
- 0 days/yr
Risk factors via First Street. Map © Google.
Why this score? — see what drove the C- grade
The composite is a weighted blend of 9 inputs, each scored 0–100. Each bar is that input's sub-score; the figure is the points it added to the 100-point composite (weight × sub-score).
- Cash flow +19.3/30.0
- ARV discount +7.4/15.0
- DSCR +6.1/10.0
- 1% rule +4.6/10.0
- Schools +4.5/10.0
- Livability +3.9/5.0
- Rent growth +2.5/5.0
- Condition / age +2.5/5.0
- Appreciation +0.0/10.0
$124,000
🖨 Deal sheet (PDF) 📄 Offer letter ✓ Due diligence
Listing remarks
Very well maintained 4 bedroom house with large 3 stall detached garage. This home features nice semi-open concept kitchen with oak cabinets. The dining room has newer flooring with access to the back deck and screen in deck. Both are very nice for morning coffee or evening relaxing. New roof in 2025 and the maintenance free metal siding make this a perfect home for everyone. There is a storage shed for the mower or extra space for kids toys and lots of parking with the covered carport, and 3 stall garage with concrete driveway. Close to schools for the kids. Give us a call today for your private showing. 24 hrs notice for all showings.
Key facts
- Oak cabinets
- Screen in deck
- Back deck
Tags
Neighborhood map
What this means for you Summary
Snapshot
- This is a 4-bed/3.0-bath single-family listed at $124k.
Deal economics
- At list price, monthly cash flow is $137 ($2k/yr) — positive.
- The deal already cash-flows at list — no discount required.
- To meet the 1% rule (rent ≥ 1% of price), the offer needs to be $119k (4.3% below list).
- Recommended offer: $119k (4.3% below list) — sets the bar for 1% rule.
Location & tenants
- Location reads 78/100 on livability (#144 in IA, #2,591 nationally) — a middle-class / working-renter tenant base. Strengths: crime A+, cost of living A+, housing A+; Watch: amenities F, commute F.
- Eagle Grove Community School District (rural): math 50% / reading 56% proficiency, ranked #274 of 289 in IA (top 95%) — acceptable for families but not a draw, mixed tenant base, ~2y average lease.
- Zoned schools: Eagle Grove Elementary (math 57% / reading 37%, grade D-, #530 of 616 statewide, top 88%, 430 students, 64% FRL); Robert Blue School (math 51% / reading 59%, grade B-, #201 of 246 statewide, top 82%, 271 students, 67% FRL); Eagle Grove High School (math 42% / reading 62%, grade D+, #299 of 336 statewide, top 91%, 299 students, 62% FRL).
- Market conditions: 38 active listings in the ZIP; 2 comparable units currently listed for rent nearby; 23 units permitted in Wright County in 2024 (10 in 5+ unit buildings).
Forward outlook
- Local home prices are declining (-3.0%/yr); year-one equity from $857 of loan paydown is wiped out by about $4k of value loss. Plan a longer hold.
- Wright County population projected at -15% by 2050 — secular population decline; favor cash flow + early exit over multi-decade hold.
Negotiation context
- Only 11 days on market — expect competitive offers; lowballing is unlikely to land.
Risks & watch-outs
- Watch-outs: built in 1900 — expect roof / HVAC / electrical / plumbing capex.
Questions for the listing agent
- Built in 1900 — when were the roof, HVAC, electrical panel, plumbing, and water heater last replaced?
- Is there a deadline driving the sale (1031 exchange, divorce, estate, relocation)? That informs how much negotiation room exists.
- What's the average days-on-market for RENTAL listings here right now (not sales)? A rising rental-DOM trend means longer vacancies and softer asking-rent achievability than the comps imply.
- What's the recent tenant-quality profile in this submarket — average credit score on applications, eviction rate, late-payment / NSF rate, and stable-employment percentage? A property-management company in the area should have these aggregated.
- How much new for-sale + rental construction is in the pipeline within 1–3 miles? Heavy new supply typically softens prices + rents 12–24 months out; constrained supply supports both.
Investment metrics
- 1% rule
- 0.96% ✗
- Cap rate
- 7.62%
- Cash-on-cash
- 4.74%
- DSCR
- 1.21
- GRM
- 8.7
CMA / ARV
- ARV (on-the-fly)
- $123,648
- Comps found
- 10
Show comp detail 10 sales within ~0.75 mi
| Address | Dist | Beds/Ba | Sqft | Sold | Price | $/sf | Match |
|---|---|---|---|---|---|---|---|
| 515 NW 3rd St | 0.00mi | 4/1.5 | 1,344 (0%) | 1mo | $116,000 | $86 | 93 |
| 509 N Lincoln Ave | 0.11mi | 3/2.0 (-1) | 1,306 (-3%) | 8mo | $75,000 | $57 | 75 |
| 415 N Garfield Ave | 0.12mi | 3/2.0 (-1) | 1,449 (+8%) | 6mo | $169,000 | $117 | 68 |
| 105 Broadway Dr | 0.59mi | 3/2.0 (-1) | 1,350 (+0%) | 10mo | $172,000 | $127 | 55 |
| 610 SW 3rd St | 0.47mi | 4/1.0 | 1,436 (+7%) | 7mo | $92,000 | $64 | 53 |
| 608 N Lincoln Ave | 0.20mi | 3/1.0 (-1) | 1,194 (-11%) | 10mo | $70,001 | $59 | 51 |
| 1001 Southwest 2nd St | 0.49mi | 3/2.0 (-1) | 1,222 (-9%) | 3mo | $114,000 | $93 | 50 |
| 1002 NW 1st St | 0.38mi | 3/1.5 (-1) | 1,416 (+5%) | 16mo | $129,900 | $92 | 49 |
| 119 N Fort Ave | 0.36mi | 3/1.0 (-1) | 1,215 (-10%) | 23mo | $110,000 | $91 | 35 |
| 1315 W Broadway St | 0.65mi | 3/2.0 (-1) | 1,184 (-12%) | 14mo | $160,000 | $135 | 29 |
Match score weights: distance 35% · size 25% · config 20% · recency 20%. Top-matched comps best support the ARV.
Projected returns pro-forma
-3.0% appreciation · 3.0% rent growth · sell at horizon
- IRR
- -8.9%
- Equity multiple
- 0.67×
- Total profit
- $-11,370
- Equity at exit
- $18,489
- IRR
- 0.5%
- Equity multiple
- 1.04×
- Total profit
- $1,286
- Equity at exit
- $10,721
Cash invested: $34,720 (down + closing). Projections, not guarantees.
Landlord ↔ Tenant lean methodology
- Overall (STATE)
- 83 Strongly Landlord-Friendly
- State Iowa
- 83 Strongly Landlord-Friendly · R+6
- County
- — inherits STATE
- City
- — inherits STATE
ZIP-level market 50533
- Home prices YoY
- -15.6%
- Active inventory
- 38
- Price-to-rent
- 8.7×
Monthly cashflow live
- Estimated rent
- $1,187 medium interval (Pro) →
- Mortgage (P&I)
- −$650
- Tax from tax record
- −$98 /mo · $1,182/yr
- Insurance
- −$52
- HOA
- −$0
- Vacancy / Maint / Mgmt
- −$249
- Net cashflow
- $137
Break-even live
Sensitivity live
| Price | -10% $207 | -5% $172 | +0% $137 | +5% $102 | +10% $67 |
|---|---|---|---|---|---|
| Rent | -10% $43 | -5% $90 | +0% $137 | +5% $184 | +10% $231 |
| Rate | -1.0pp $200 | -0.5pp $169 | base $137 | +0.5pp $105 | +1.0pp $72 |
UW: 25.0% down · 7.5% · 30yr · 1.5% tax · 5.0% vac · 8.0% maint · 8.0% mgmt
Financing live
Cash to close
- Down payment
- $31,000
- Closing costs
- $3,720
- Reserves months
- —
- Total cash needed
- —
Loan-product check · same deal, 3 products live
Conventional
25% down · 7.5% · 30yr
- Down + closing
- —
- Monthly P&I
- —
- Monthly cashflow
- —
- DSCR
- —
- Eligible?
- —
Personal DTI + credit; lowest rate.
DSCR
20% down · 8.5% · 30yr
- Down + closing
- —
- Monthly P&I
- —
- Monthly cashflow
- —
- DSCR
- —
- Eligible?
- —
No personal income docs; deal must DSCR.
Hard money
10% down · 12.0% · 12mo
- Down + closing
- —
- Monthly P&I
- —
- Monthly cashflow
- —
- DSCR
- —
- Eligible?
- —
Short-term bridge; refi at stabilization.
Rent comps 2 comps
| Address | Beds | Baths | Sqft | Rent | $/sqft | DOM | Units | Dist |
|---|---|---|---|---|---|---|---|---|
| 515 Nickellane Ave Eagle Grove, IA | 3.0 | 2.0 | 1692 | $1,200 | $0.71 | 45d | 1 | 0.22mi |
| 515 NE 1st St Eagle Grove, IA | 3.0 | 1.5 | 1214 | $1,150 | $0.95 | 45d | 1 | 0.70mi |
Listing history 2 events
-
2026-04-17status Pending
-
2026-04-03$124,000 Active
ⓘ Source: listings_history table (triggers on properties + properties_extension) + one-shot
backfill from property_details.listing_events for pre-trigger history.
Tax reassessment forecast IA · Partial reset (capped growth)
- Current annual tax
- $1,182 · $98/mo
- Projected year-2 tax
- $1,564 · $130/mo
- Expected delta
- +$382/yr (+$32/mo · 32.4%)
ⓘ Screening estimate from a state-policy table — verify with the county assessor before closing.
Climate risk First Street
- Flood 1/10 Low FEMA zone X (unshaded) · 0% chance over 30 yrs
- Wildfire 1/10 Low
- Heat 2/10 Low 7 d/yr ≥100°F today · 16 d/yr by 30 yrs out
- Wind 2/10 Low
- Air quality 1/10 Low 0 unhealthy d/yr today · 0 by 30 yrs out
Nearby sold comps map
Loading sold comps map…
Walkable amenities ~0.75 mi
Loading nearby amenities…
Taxation est. · year 1
- Rental income
- $14,243
- − Mortgage interest
- −$6,946
- − Property taxes
- −$1,182
- − Insurance
- −$620
- − Repairs & maintenance
- −$1,139
- − Management
- −$1,139
- − Depreciation
- −$3,607
- Taxable loss
- −$391
- Est. tax savings @ 24.0%
- +$94
- After-tax cash flow
- $1,741/yr
For passive investors: Depreciation is non-cash, so a rental often shows a tax loss while cash-flowing — sheltering income. Rental losses are passive: they offset passive income freely, and up to $25,000/yr can offset ordinary (W-2) income if you actively participate and your MAGI is under $100k (phasing out to $0 by $150k); unused losses carry forward. On sale, claimed depreciation is recaptured at up to 25%, and gains may owe capital-gains tax (a 1031 exchange can defer both). Figures are a year-1 estimate at your 24.0% rate — not tax advice; consult a CPA.
Schools (NCES district)
- District
- Eagle Grove Community School District
- NCES district ID
- 1909990
- Math proficiency
- 50% ▼ -5.00%
- Reading proficiency
- 56% ▼ -1.00%
- Median HH income
- $46,241
- Composite
- 44.89/100
- National rank
- #2716
- State rank
- #274 of 289 in IA
Livability — Eagle Grove
- Score
- 78/100
- State rank
- #144
- US rank
- #2591
Category grades
Schools grade is shown separately in the Schools card above.
Census & demographics
- Census place
- Eagle Grove, IA
- City population
- 3,994
- Population (ZIP)
- 3,994
Population outlook (Wright County) Hauer SSP2
- Today (2025)
- 12,154 people
- By 2030
- 11,770 · -3.2%
- By 2040
- 10,981 · -9.7%
- By 2050
- 10,313 · -15.1%
- By 2075
- 9,217 · -24.2%
- By 2100
- 8,084 · -33.5%
Race, ethnicity, and origin ACS 2023
- Neighborhood character
- Majority White (62%)
- Race & ethnicity
- White 62% Hispanic / Latino 32% Two or more races 16% Asian 2%
- Hispanic origin (detail)
- Mexican 25%
- Common ancestry
- Portuguese 9% Lithuanian 3% Italian 2%
- Foreign-born
- 9% · Canada
- Languages at home
- 72% English-only · Spanish 24% Other Asian/Pacific 3% German/W. Germanic 1%
Political lean MEDSL · Wright
- 2024 margin
- Solid R (+36.5) · D 31.0% · R 67.5% · Other 1.4%
- 2008→2024 swing
- -35.0pp toward R · 2008: -1.5pp · 2024: -36.5pp
- All cycles
- 2024: R+36.5 2020: R+34.2 2016: R+31.9 2012: R+8.3 2008: R+1.5
Not yet ingested
- Civics
- —
Market trends
- HPI YoY
- ▼ -32.82%
- Current HPI
- 177.4331
- Rent YoY
- —
- Metro
- —
- State GDP YoY
- ▲ 2.48%
- F500 in state
- 4
Industry mix (Fortune 500 HQ in IA)
| Industry | F500 HQs | Revenue |
|---|---|---|
| Financial Services | 1 | $16B |
|
||
| Retail / Convenience | 1 | $15B |
|
||
Price history
2 events — show timeline
- 2026-04-17 Pending — IAR
- 2026-04-03 Listed $124,000 IAR
Property tax history
+3.7%/yrLatest (2025): $1,182 · -7.1% YoY. Source: county tax records.
Cash-flow waterfall
monthlySold comps — $/sqft
last 12 mo · ≤1 miLoading sold comps…