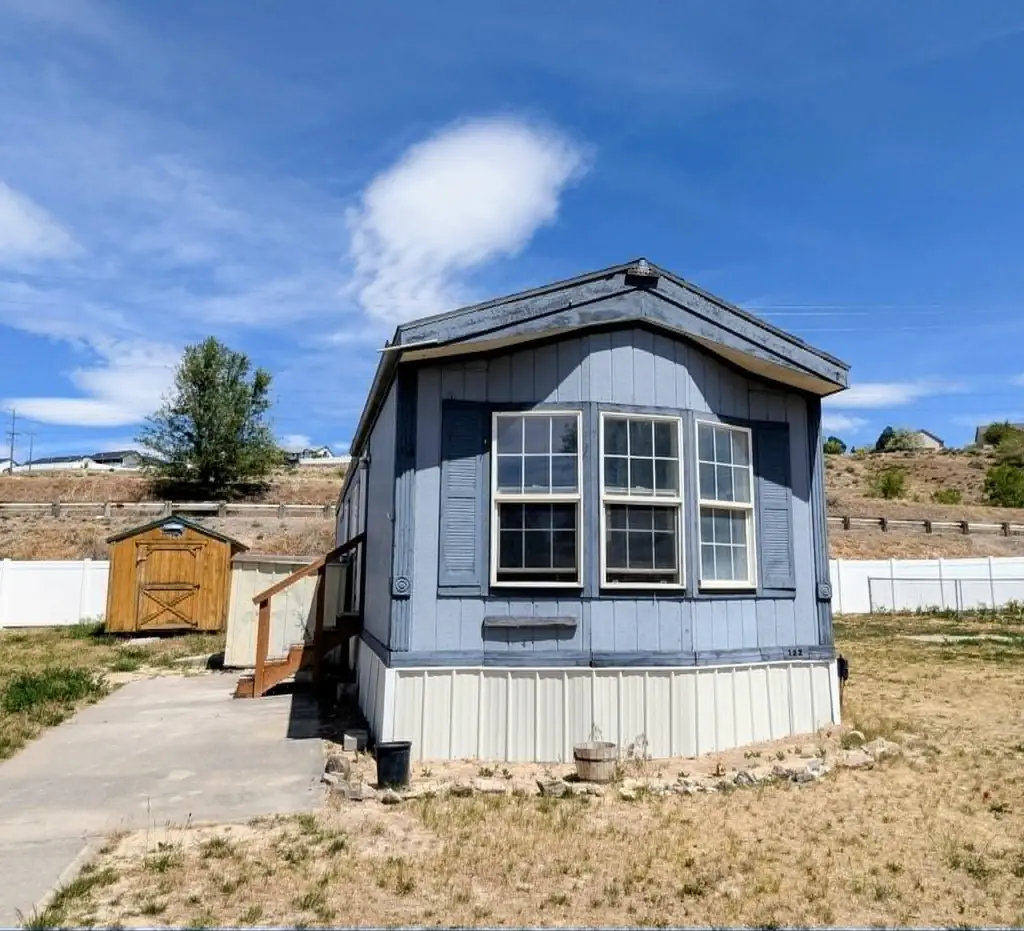
1550 Yellowstone Ave #122 · Pocatello, ID
Flood risk No data
- FEMA flood zone
- —
- Chance of flooding over 30 yrs
- —
- Est. flood insurance / yr
- —
Fire risk No data
- Est. fire insurance / yr
- —
Heat risk No data
- Hot days now (above threshold)
- —
- Hot days in 30 yrs
- —
Wind risk No data
- Chance of severe wind over 30 yrs
- —
Air-quality risk No data
- Unhealthy air days now
- —
- Unhealthy air days in 30 yrs
- —
Risk factors via First Street. Map © Google.
Why this score? — see what drove the B grade
The composite is a weighted blend of 9 inputs, each scored 0–100. Each bar is that input's sub-score; the figure is the points it added to the 100-point composite (weight × sub-score).
- Cash flow +30.0/30.0
- 1% rule +10.0/10.0
- DSCR +10.0/10.0
- ARV discount +7.5/15.0
- Schools +4.3/10.0
- Livability +4.2/5.0
- Rent growth +3.3/5.0
- Condition / age +2.5/5.0
- Appreciation +0.0/10.0
$39,797
🖨 Deal sheet 📄 Offer letter ✓ Due diligence
Listing remarks
Welcome home to this bright and inviting 1994 Fleetwood manufactured home. This home offers 2 bedrooms, 1 bathroom, and 672 square feet of comfortable living space. Centrally located near shopping and schools, this home combines convenience with comfort. The open floor plan makes great use of the space, while vaulted ceilings throughout create an airy, spacious atmosphere. Recent updates include fresh paint, LVP flooring, and updated skirting. Lot rent is $595 per month. A wonderful opportunity for more affordable living in a convenient location!
Key facts
- Open floor plan
- Recent updates
- Fresh paint
Tags
Property features AI
Exterior
- Utilities: Public water; Public sewer
- Home design: Manufactured home (manufactured without land); Residential property
- Construction: Wood siding
- Exterior features: Shed(s)
Interior
- Kitchen: Range; Oven; Refrigerator
- Bedrooms: 2 bedrooms on the main level
- Bathrooms: 1 full bathroom on the main level
- Heating & cooling: Electric forced-air heating
- Interior features: Vaulted ceilings
Neighborhood map
What this means for you Summary
Snapshot
- This is a 2-bed/1.0-bath manufactured listed at $40k.
Deal economics
- At list price, monthly cash flow is $538 ($6k/yr) — positive.
- The deal already cash-flows at list — no discount required.
- Meets the 1% rule at list price ($982 rent vs $40k).
- Recommended offer: $39k (1.5% below list) — sets the bar for market timing.
Location & tenants
- Location reads 84/100 on livability (#7 in ID, #758 nationally) — a professional / high-income tenant draw. Strengths: commute A+, cost of living A+, housing A+; Watch: amenities C-, employment D.
- Pocatello District (urban): math 45% / reading 58% proficiency, ranked #26 of 92 in ID (top 28%) — acceptable for families but not a draw, mixed tenant base, ~2y average lease.
- Zoned schools: Syringa Elementary School (math 43% / reading 57%, grade D+, #147 of 357 statewide, top 41%, 356 students, 45% FRL); Alameda Middle School (math 46% / reading 57%, grade C, #28 of 109 statewide, top 25%, 645 students, 40% FRL); Century High School (math 41% / reading 71%, grade C, #24 of 169 statewide, top 14%, 1,092 students, 33% FRL) — zoned schools at 39% FRL track the district average.
- Market conditions: Rents rising (+3.4%/yr); 365 active listings in the ZIP; 325 units permitted in Bannock County in 2024 (6 in 5+ unit buildings).
- This rent is only 18% of the median local income ($66k/yr) — well below the 30% rent-burden line; pricing power to push rent on renewal without tenant pushback.
Forward outlook
- Local home prices are declining (-3.0%/yr); year-one equity from $275 of loan paydown is wiped out by about $1k of value loss. Plan a longer hold.
- At projected returns (-3.0% appreciation + 3.4% rent growth), your $11k cash investment doubles in ~2 years — after that, you're playing with house money.
Negotiation context
- It's been on market 24 days — a 2% lower offer ($39k) is reasonable based on typical stale-listing flexibility.
Questions for the listing agent
- Is there a deadline driving the sale (1031 exchange, divorce, estate, relocation)? That informs how much negotiation room exists.
- What's the average days-on-market for RENTAL listings here right now (not sales)? A rising rental-DOM trend means longer vacancies and softer asking-rent achievability than the comps imply.
- What's the recent tenant-quality profile in this submarket — average credit score on applications, eviction rate, late-payment / NSF rate, and stable-employment percentage? A property-management company in the area should have these aggregated.
- How much new for-sale + rental construction is in the pipeline within 1–3 miles? Heavy new supply typically softens prices + rents 12–24 months out; constrained supply supports both.
Investment metrics
- 1% rule
- 2.47% ✓
- Cap rate
- 22.52%
- Cash-on-cash
- 57.96%
- DSCR
- 3.58
- GRM
- 3.4
CMA / ARV
No comps found within radius.
Projected returns pro-forma
-3.0% appreciation · 3.37% rent growth · sell at horizon
- IRR
- 56.9%
- Equity multiple
- 3.53×
- Total profit
- $28,191
- Equity at exit
- $5,934
- IRR
- 61.9%
- Equity multiple
- 7.30×
- Total profit
- $70,173
- Equity at exit
- $3,441
Cash invested: $11,143 (down + closing). Projections, not guarantees.
Landlord ↔ Tenant lean methodology
- Overall (STATE)
- 91 Strongly Landlord-Friendly
- State Idaho
- 91 Strongly Landlord-Friendly · R+18
- County
- — inherits STATE
- City
- — inherits STATE
ZIP-level market 83201
- Rents YoY
- 3.4%
- Active inventory
- 365
- Price-to-rent
- 3.4×
Monthly cashflow live
- Estimated rent
- $982 medium interval (Pro) →
- Mortgage (P&I)
- −$209
- Tax from tax record
- −$12 /mo · $145/yr
- Insurance
- −$17
- HOA
- −$0
- Vacancy / Maint / Mgmt
- −$206
- Net cashflow
- $538
Break-even live
UW: 25.0% down · 7.5% · 30yr · 1.5% tax · 5.0% vac · 8.0% maint · 8.0% mgmt
Financing live
Cash to close
- Down payment
- $9,949
- Closing costs
- $1,194
- Reserves months
- —
- Total cash needed
- —
Loan-product check · same deal, 3 products live
Conventional
25% down · 7.5% · 30yr
- Down + closing
- —
- Monthly P&I
- —
- Monthly cashflow
- —
- DSCR
- —
- Eligible?
- —
Personal DTI + credit; lowest rate.
DSCR
20% down · 8.5% · 30yr
- Down + closing
- —
- Monthly P&I
- —
- Monthly cashflow
- —
- DSCR
- —
- Eligible?
- —
No personal income docs; deal must DSCR.
Hard money
10% down · 12.0% · 12mo
- Down + closing
- —
- Monthly P&I
- —
- Monthly cashflow
- —
- DSCR
- —
- Eligible?
- —
Short-term bridge; refi at stabilization.
Listing history 18 events
-
2026-06-19days on market $39,797 Active 24 DOM
-
2026-06-18days on market $39,797 Active 23 DOM
-
2026-06-17price $39,797 Active 22 DOM
-
2026-06-17days on market $45,997 Active 22 DOM
-
2026-06-16days on market $45,997 Active 21 DOM
-
2026-06-15days on market $45,997 Active 20 DOM
-
2026-06-14days on market $45,997 Active 18 DOM
-
2026-06-13days on market $45,997 Active 17 DOM
-
2026-06-10days on market $45,997 Active 15 DOM
-
2026-06-09days on market $45,997 Active 14 DOM
-
2026-06-08days on market $45,997 Active 13 DOM
-
2026-06-07days on market $45,997 Active 12 DOM
-
2026-06-03days on market $45,997 Active 8 DOM
-
2026-06-02days on market $45,997 Active 7 DOM
-
2026-06-01days on market $45,997 Active 6 DOM
-
2026-05-31days on market $45,997 Active 5 DOM
-
2026-05-30days on market $45,997 Active 4 DOM
-
2026-05-27$45,997 Active
ⓘ Source: listings_history table (triggers on properties + properties_extension) + one-shot
backfill from property_details.listing_events for pre-trigger history.
Tax reassessment forecast ID · Resets to sale price
- Current annual tax
- $145 · $12/mo
- Projected year-2 tax
- $275 · $23/mo
- Expected delta
- +$130/yr (+$11/mo · 89.4%)
ⓘ Screening estimate from a state-policy table — verify with the county assessor before closing.
Nearby sold comps map
Loading sold comps map…
Walkable amenities ~0.75 mi
Loading nearby amenities…
Taxation est. · year 1
- Rental income
- $11,781
- − Mortgage interest
- −$2,229
- − Property taxes
- −$145
- − Insurance
- −$199
- − Repairs & maintenance
- −$943
- − Management
- −$943
- − Depreciation
- −$1,158
- Taxable income
- $6,165
- Est. tax owed @ 24.0%
- −$1,480
- After-tax cash flow
- $4,979/yr
For passive investors: Depreciation is non-cash, so a rental often shows a tax loss while cash-flowing — sheltering income. Rental losses are passive: they offset passive income freely, and up to $25,000/yr can offset ordinary (W-2) income if you actively participate and your MAGI is under $100k (phasing out to $0 by $150k); unused losses carry forward. On sale, claimed depreciation is recaptured at up to 25%, and gains may owe capital-gains tax (a 1031 exchange can defer both). Figures are a year-1 estimate at your 24.0% rate — not tax advice; consult a CPA.
Schools (NCES district)
- District
- Pocatello District
- NCES district ID
- 1602640
- Math proficiency
- 45% ▼ -6.00%
- Reading proficiency
- 58% ▼ -1.00%
- Median HH income
- $44,478
- Composite
- 43.46/100
- National rank
- #3003
- State rank
- #26 of 92 in ID
Livability — Pocatello
- Score
- 84/100
- State rank
- #7
- US rank
- #758
Category grades
Schools grade is shown separately in the Schools card above.
Census & demographics
- Census place
- Pocatello, ID
- County
- Bannock County · 82,995 people
- City population
- 58,482
- Metro
- Pocatello, ID
- Population (ZIP)
- 39,902
- Household income
- $66,357
- Rent vs Own
- Severe rent burden
- 1417.0
Population outlook (Bannock County) Hauer SSP2
- Today (2025)
- 86,173 people
- By 2030
- 86,575 · +0.5%
- By 2040
- 86,235 · +0.1%
- By 2050
- 86,090 · -0.1%
- By 2075
- 85,032 · -1.3%
- By 2100
- 85,103 · -1.2%
Race, ethnicity, and origin ACS 2023
- Neighborhood character
- Predominantly White (81%)
- Race & ethnicity
- White 81% Hispanic / Latino 10% Two or more races 6% Asian 3% Black 1% Native American 1%
- Hispanic origin (detail)
- Mexican 6%
- Common ancestry
- Slovak 5% Italian 4% Portuguese 2%
- Foreign-born
- 4% · Canada
- Languages at home
- 94% English-only · Spanish 3% Other Asian/Pacific 1% Other Indo-European 1%
Political lean MEDSL · Bannock
- 2024 margin
- Strong R (+25.1) · D 35.8% · R 60.9% · Other 3.3%
- 2008→2024 swing
- -12.1pp toward R · 2008: -13.0pp · 2024: -25.1pp
- All cycles
- 2024: R+25.1 2020: R+21.9 2016: R+20.5 2012: R+22.1 2008: R+13.0
Not yet ingested
- Civics
- —
Market trends
- HPI YoY
- ▼ -183.96%
- Current HPI
- 229.6427
- Rent YoY
- ▲ 3.37%
- Metro
- Pocatello, ID
- State GDP YoY
- ▲ 4.51%
- F500 in state
- 6
Industry mix (Fortune 500 HQ in ID)
| Industry | F500 HQs | Revenue |
|---|---|---|
| Retail | 1 | $79B |
|
||
| Technology | 1 | $25B |
|
||
| Food / Agriculture | 1 | $6B |
|
||
Price history
1 event — show timeline
- 2026-05-27 Listed $45,997 PCTMLS
Cash-flow waterfall
monthlySold comps — $/sqft
last 12 mo · ≤1 miLoading sold comps…