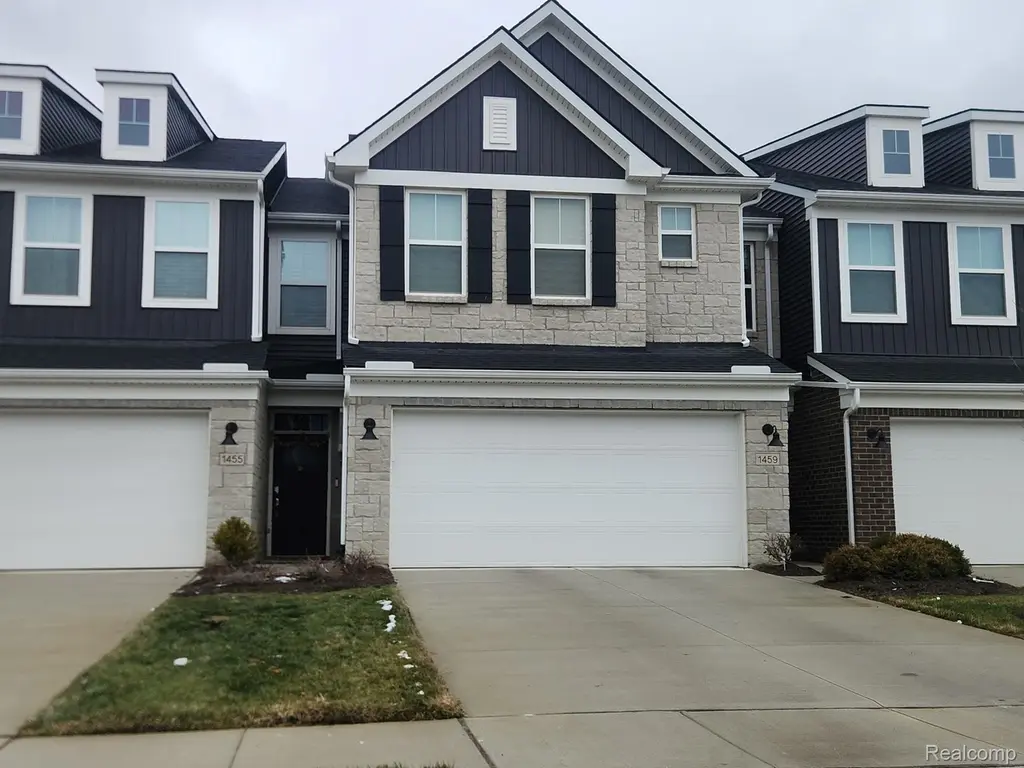
1459 Arcadia Dr · Milford, MI
Flood risk No data
- FEMA flood zone
- —
- Chance of flooding over 30 yrs
- —
- Est. flood insurance / yr
- —
Fire risk No data
- Est. fire insurance / yr
- —
Heat risk No data
- Hot days now (above threshold)
- —
- Hot days in 30 yrs
- —
Wind risk No data
- Chance of severe wind over 30 yrs
- —
Air-quality risk No data
- Unhealthy air days now
- —
- Unhealthy air days in 30 yrs
- —
Risk factors via First Street. Map © Google.
Why this score? — see what drove the D+ grade
The composite is a weighted blend of 9 inputs, each scored 0–100. Each bar is that input's sub-score; the figure is the points it added to the 100-point composite (weight × sub-score).
- ARV discount +13.9/15.0
- Cash flow +12.4/30.0
- Schools +4.4/10.0
- Livability +4.4/5.0
- 1% rule +4.1/10.0
- Condition / age +4.0/5.0
- DSCR +3.7/10.0
- Rent growth +2.5/5.0
- Appreciation +0.0/10.0
$389,900
🖨 Deal sheet (PDF) 📄 Offer letter ✓ Due diligence
Listing remarks MLS
Come see this move in ready condo located in Milford. This 2,000 sqft home features 3 bedrooms and 2.5 baths. Open floor plan with granite counter tops/island in the kitchen. Master bedroom includes en suite bath , walk in closet and extended sitting area. 2nd floor laundry and attached 2 car garage. BATVAI Property being sold in "AS-IS" condition. This is property is under FREDDIE MAC FIRST LOOK INITIATIVE 4/7/2026-5/7/2026. See the attached submission documents.
Key facts
- Open floor plan
- Island in kitchen
- Granite counter tops
Tags
Neighborhood map
What this means for you Summary
Snapshot
- This is a 3-bed/2.5-bath condo listed at $390k. Condition is rated good.
Deal economics
- At list price, monthly cash flow is $-67 ($-809/yr) — negative.
- To cash-flow at today's rent, offer at most $378k (3.1% below list).
- To meet the 1% rule (rent ≥ 1% of price), the offer needs to be $354k (9.2% below list).
- Recommended offer: $354k (9.2% below list) — sets the bar for 1% rule.
- Cap rate 6.1% vs local median 2.1% in Milford — top-decile yield for the area; either an underpriced asset or a hidden risk that comps aren't pricing in. Stress-test before assuming the spread holds.
Location & tenants
- Location reads 87/100 on livability (#17 in MI, #275 nationally) — a professional / high-income tenant draw. Strengths: crime A+, amenities A+, employment A+; Watch: commute F.
- Huron Valley Schools (suburban): math 42% / reading 56% proficiency, ranked #87 of 540 in MI (top 16%) — families likely to look elsewhere, expect single-tenant / working-renter base with shorter leases.
- Market conditions: 180 active listings in the ZIP; 3 comparable units currently listed for rent nearby; rentals leasing fast (median 0d on market — plan ~1-2 weeks tenant-placement turnaround); 2,614 units permitted in Oakland County in 2024 (721 in 5+ unit buildings).
Forward outlook
- Local home prices are declining (-3.0%/yr); year-one equity from $3k of loan paydown is wiped out by about $12k of value loss. Plan a longer hold.
- Oakland County population projected at +10% by 2050 — modest demand growth; plan on rents tracking national, not racing it.
Negotiation context
- It's been on market 71 days — a 6% lower offer ($367k) is reasonable based on typical stale-listing flexibility.
- 4 sale attempts since 2y ago with the ask held roughly flat each time — persistent listings suggest the price (not the market) is what's stuck; bring a comps-based counter.
Questions for the listing agent
- What do current leases actually rent for vs. the listed asking? Can we see a recent rent roll and the last 12 months of T-12 income?
- It's been on market 71 days. Have you received any prior offers? Is the seller open to a 9% concession, seller financing, or rate buy-down credit?
- What does the HOA fee cover, when was the last increase, and are there any pending special assessments or reserve-fund shortfalls?
- Any open or pending special assessments — roof, HVAC, plumbing, elevator, façade? What's the per-unit balance and payoff schedule, and is the seller paying it off at close or rolling it to the buyer?
- Why hasn't it sold? Are there any deal-killer items the seller is aware of (foundation, flood, title, zoning, code violations)?
- Is there a deadline driving the sale (1031 exchange, divorce, estate, relocation)? That informs how much negotiation room exists.
- Schools are B-rated — typically a magnet for longer-tenancy family renters. What's the average tenant stay here, and is there a school-zone premium baked into asking?
- The area grade is low — what's the realistic commute time and amenity access for the typical tenant pool here? Any planned neighborhood developments (good or bad) we should know about?
- What's the average days-on-market for RENTAL listings here right now (not sales)? A rising rental-DOM trend means longer vacancies and softer asking-rent achievability than the comps imply.
- What's the recent tenant-quality profile in this submarket — average credit score on applications, eviction rate, late-payment / NSF rate, and stable-employment percentage? A property-management company in the area should have these aggregated.
- How much new apartment / multifamily construction is in the pipeline within 1–3 miles? Heavy new supply (>2% of stock underway) typically softens rents 12–24 months out; light construction supports rent growth.
Investment metrics
- 1% rule
- 0.91% ✗
- Cap rate
- 6.09%
- Cash-on-cash
- -0.74%
- DSCR
- 0.97
- GRM
- 9.2
CMA / ARV
- ARV (median comp)
- $454,273
- List price
- $389,900
- Delta
- -14.17%
- Verdict
- UNDERPRICED
- Comps
- 20 within 1.0 mi
Projected returns pro-forma
-3.0% appreciation · 3.0% rent growth · sell at horizon
- IRR
- -17.5%
- Equity multiple
- 0.38×
- Total profit
- $-67,315
- Equity at exit
- $58,135
- IRR
- -9.4%
- Equity multiple
- 0.42×
- Total profit
- $-63,504
- Equity at exit
- $33,711
Cash invested: $109,172 (down + closing). Projections, not guarantees.
Landlord ↔ Tenant lean methodology
- Overall (STATE)
- 62 Landlord-Friendly
- State Michigan
- 62 Landlord-Friendly · EVEN
- County
- — inherits STATE
- City
- — inherits STATE
ZIP-level market 48381
- Active inventory
- 180
- Price-to-rent
- 9.2×
Monthly cashflow live
- Estimated rent
- $3,539 medium interval (Pro) →
- Mortgage (P&I)
- −$2,045
- Tax from tax record
- −$416 /mo · $4,997/yr
- Insurance
- −$162
- HOA
- −$240
- Vacancy / Maint / Mgmt
- −$743
- Net cashflow
- $-67
Break-even live
Sensitivity live
| Price | -10% $153 | -5% $43 | +0% $-67 | +5% $-178 | +10% $-288 |
|---|---|---|---|---|---|
| Rent | -10% $-347 | -5% $-207 | +0% $-67 | +5% $72 | +10% $212 |
| Rate | -1.0pp $129 | -0.5pp $32 | base $-67 | +0.5pp $-168 | +1.0pp $-271 |
UW: 25.0% down · 7.5% · 30yr · 1.5% tax · 5.0% vac · 8.0% maint · 8.0% mgmt
Financing live
Cash to close
- Down payment
- $97,475
- Closing costs
- $11,697
- Reserves months
- —
- Total cash needed
- —
Loan-product check · same deal, 3 products live
Conventional
25% down · 7.5% · 30yr
- Down + closing
- —
- Monthly P&I
- —
- Monthly cashflow
- —
- DSCR
- —
- Eligible?
- —
Personal DTI + credit; lowest rate.
DSCR
20% down · 8.5% · 30yr
- Down + closing
- —
- Monthly P&I
- —
- Monthly cashflow
- —
- DSCR
- —
- Eligible?
- —
No personal income docs; deal must DSCR.
Hard money
10% down · 12.0% · 12mo
- Down + closing
- —
- Monthly P&I
- —
- Monthly cashflow
- —
- DSCR
- —
- Eligible?
- —
Short-term bridge; refi at stabilization.
Rent comps 3 comps
| Address | Beds | Baths | Sqft | Rent | $/sqft | DOM | Units | Dist |
|---|---|---|---|---|---|---|---|---|
| 1445 Superior Dr Milford, MI | 3.0 | 2.5 | 2079 | $3,050 | $1.47 | 18d | 1 | 0.05mi |
| 4881 Marquette Dr Milford, MI | 4.0 | 2.5 | 2400 | $4,100 | $1.71 | 0d | 1 | 0.09mi |
| 57490 Lyon Crossing Blvd New Hudson, MI | 1.0–3.0 | 1.0–2.0 | 1151 | $3,125 | $2.72 | 0d | 21 | 0.62mi |
HOA detail condo
- Monthly dues
- $240 · $2,880/yr
- Assessments
- None detected in remarks — confirm with the listing agent.
Listing history 22 events
-
2026-06-18days on market $389,900 Active 71 DOM
-
2026-06-17days on market $389,900 Active 70 DOM
-
2026-06-16days on market $389,900 Active 69 DOM
-
2026-06-15days on market $389,900 Active 68 DOM
-
2026-06-13days on market $389,900 Active 66 DOM
-
2026-06-13days on market $389,900 Active 65 DOM
-
2026-06-09days on market $389,900 Active 62 DOM
-
2026-06-08days on market $389,900 Active 61 DOM
-
2026-06-07days on market $389,900 Active 60 DOM
-
2026-06-04days on market $389,900 Active 57 DOM
-
2026-06-03days on market $389,900 Active 56 DOM
-
2026-06-02days on market $389,900 Active 55 DOM
-
2026-06-01days on market $389,900 Active 54 DOM
-
2026-05-31days on market $389,900 Active 53 DOM
-
2026-04-09$399,900 Active 481-char remark
Show marketing remark (481 chars)
Come see this move in ready condo located in Milford. This 2,000 sqft home features 3 bedrooms and 2.5 baths. Open floor plan with granite counter tops/island in the kitchen. Master bedroom includes en suite bath , walk in closet and extended sitting area. 2nd floor laundry and attached 2 car garage. BATVAI Property being sold in "AS-IS" condition. This is property is under FREDDIE MAC FIRST LOOK INITIATIVE 4/7/2026-5/7/2026. See the attached submission documents.
-
2026-04-07$399,900 Active 478-char remark
Show marketing remark (478 chars)
Come see this move in ready condo located in Milford. This 2,000 sqft home features 3 bedrooms and 2.5 baths. Open floor plan with granite counter tops/island in the kitchen. Master bedroom includes en suite bath , walk in closet and extended sitting area. 2nd floor laundry and attached 2 car garage. BATVAI Property being sold in "AS-IS" condition. This is property is under FREDDIE MAC FIRST LOOK INITIATIVE 4/7/2026-5/7/2026. See the attached submission documents.
-
2024-07-30soldstatus $426,815 Sold
-
2024-07-30soldstatus $426,815 Closed
-
2024-02-27status Pending
-
2024-02-27status Pending
-
2024-01-29$429,990 Active
-
2024-01-29$429,990 Active
ⓘ Source: listings_history table (triggers on properties + properties_extension) + one-shot
backfill from property_details.listing_events for pre-trigger history.
Tax reassessment forecast MI · Partial reset (capped growth)
- Current annual tax
- $4,997 · $416/mo
- Projected year-2 tax
- $5,501 · $458/mo
- Expected delta
- +$504/yr (+$42/mo · 10.1%)
ⓘ Screening estimate from a state-policy table — verify with the county assessor before closing.
Nearby sold comps map
Loading sold comps map…
Walkable amenities ~0.75 mi
Loading nearby amenities…
Taxation est. · year 1
- Rental income
- $42,473
- − Mortgage interest
- −$21,840
- − Property taxes
- −$4,997
- − Insurance
- −$1,950
- − Repairs & maintenance
- −$3,398
- − Management
- −$3,398
- − HOA
- −$2,880
- − Depreciation
- −$11,343
- Taxable loss
- −$7,332
- Est. tax savings @ 24.0%
- +$1,760
- After-tax cash flow
- $951/yr
For passive investors: Depreciation is non-cash, so a rental often shows a tax loss while cash-flowing — sheltering income. Rental losses are passive: they offset passive income freely, and up to $25,000/yr can offset ordinary (W-2) income if you actively participate and your MAGI is under $100k (phasing out to $0 by $150k); unused losses carry forward. On sale, claimed depreciation is recaptured at up to 25%, and gains may owe capital-gains tax (a 1031 exchange can defer both). Figures are a year-1 estimate at your 24.0% rate — not tax advice; consult a CPA.
Condition & rehab AI · 12 photos
This move-in ready condo is in good condition with modern finishes and a clean, fresh appearance. Minor updates to exterior paint and landscaping can further enhance its value.
Value-add opportunities
- Both Painting exterior and interior walls — Fresh paint enhances curb appeal and interior aesthetics
- Both Landscaping and curb appeal improvements — Enhances curb appeal and can attract more buyers
- Both Add smart home features — Improves convenience and can increase property value
- Both Install smart thermostat — Saves energy and can increase property value
Renovation cost estimate screening
Value-add ROI direction
- Both Painting exterior and interior walls — Fresh paint enhances curb appeal and interior aesthetics ↑
- Both Landscaping and curb appeal improvements — Enhances curb appeal and can attract more buyers ↑
- Both Add smart home features — Improves convenience and can increase property value ↑
- Both Install smart thermostat — Saves energy and can increase property value ↑
ⓘ Cost ranges are severity-bucket heuristics (US national rule-of-thumb). Get contractor quotes + a written scope before underwriting a rehab budget.
Schools (NCES district)
- District
- Huron Valley Schools
- NCES district ID
- 2618990
- Math proficiency
- 42% ▼ -8.00%
- Reading proficiency
- 56% ▼ -3.00%
- Median HH income
- $76,011
- Composite
- 44.39/100
- National rank
- #2815
- State rank
- #87 of 540 in MI
Livability — Milford
- Score
- 87/100
- State rank
- #17
- US rank
- #275
Category grades
Schools grade is shown separately in the Schools card above.
Census & demographics
- Population (ZIP)
- 13,737
Population outlook (Oakland County) Hauer SSP2
- Today (2025)
- 1,335,747 people
- By 2030
- 1,375,100 · +2.9%
- By 2040
- 1,435,385 · +7.5%
- By 2050
- 1,469,250 · +10.0%
- By 2075
- 1,531,946 · +14.7%
- By 2100
- 1,450,485 · +8.6%
Race, ethnicity, and origin ACS 2023
- Neighborhood character
- Predominantly White (89%)
- Race & ethnicity
- White 89% Two or more races 7% Hispanic / Latino 4% Asian 1%
- Common ancestry
- Romanian 11% Iranian 4% Slovak 3%
- Foreign-born
- 3% · Canada, China
- Languages at home
- 96% English-only · Other Indo-European 1% Spanish 1% German/W. Germanic 1%
Political lean MEDSL · Oakland
- 2024 margin
- D (+10.6) · D 54.4% · R 43.8% · Other 1.9%
- 2008→2024 swing
- -3.9pp toward R · 2008: 14.5pp · 2024: 10.6pp
- All cycles
- 2024: D+10.6 2020: D+14.1 2016: D+8.1 2012: D+8.1 2008: D+14.5
Not yet ingested
- Civics
- —
Market trends
- HPI YoY
- ▼ -303.22%
- Current HPI
- 200.4953
- Rent YoY
- —
- Metro
- —
- State GDP YoY
- ▲ 1.37%
- F500 in state
- 28
Industry mix (Fortune 500 HQ in MI)
| Industry | F500 HQs | Revenue |
|---|---|---|
| Automotive Parts | 3 | $48B |
|
||
| Automotive | 2 | $372B |
|
||
| Chemicals | 1 | $45B |
|
||
| Automotive Retail | 1 | $29B |
|
||
| Healthcare / Medical Devices | 1 | $23B |
|
||
| Automotive Technology | 1 | $20B |
|
||
Price history
-7.0% since first listed8 events — show timeline
- 2026-04-09 Listed $399,900 REALCOMP
- 2026-04-07 Listed $399,900 MiRealSource-MiMLS
- 2024-07-30 Sold (MLS) $426,815 MiRealSource-MiMLS
- 2024-07-30 Sold (MLS) $426,815 REALCOMP
- 2024-02-27 Pending — MiRealSource-MiMLS
- 2024-02-27 Pending — REALCOMP
- 2024-01-29 Listed $429,990 MiRealSource-MiMLS
- 2024-01-29 Listed $429,990 REALCOMP
Property tax history
+118.8%/yrLatest (2025): $4,997 · +266.1% YoY. Source: county tax records.
Cash-flow waterfall
monthlySold comps — $/sqft
last 12 mo · ≤1 miLoading sold comps…