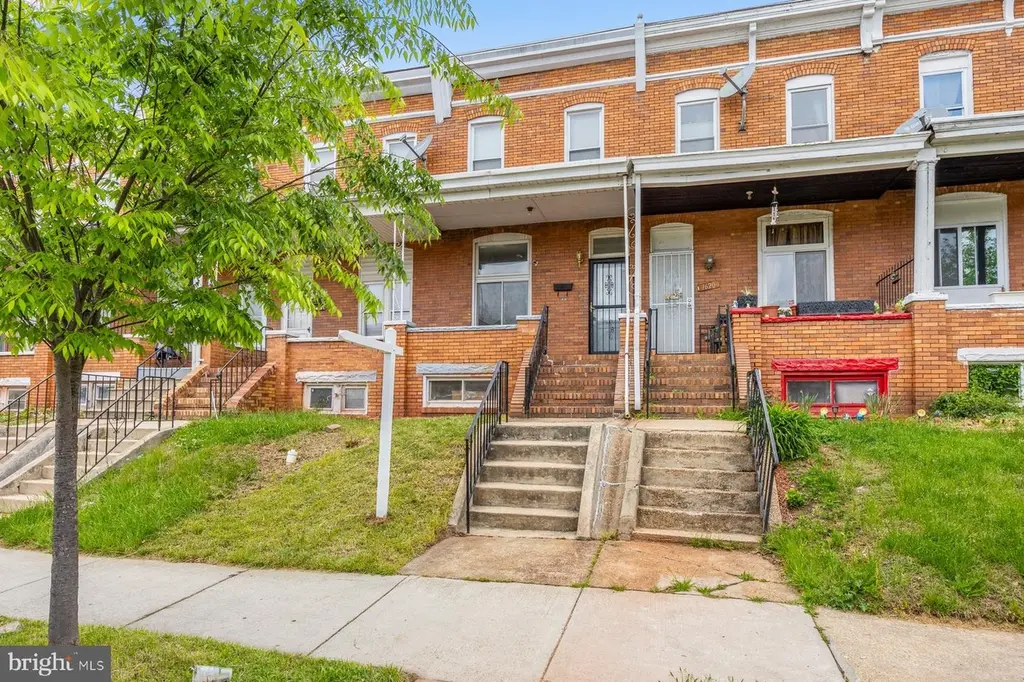
1618 E 29th St · Baltimore, MD
Flood risk 1/10 · Minimal
- FEMA flood zone
- X (unshaded)
- Chance of flooding over 30 yrs
- 0.0%
- Est. flood insurance / yr
- $473 – $860
Fire risk 1/10 · Minimal
- Est. fire insurance / yr
- $755 – $1,403
Heat risk 7/10 · Major
- Hot days now (above 103°F)
- 7 days/yr
- Hot days in 30 yrs
- 15 days/yr
Wind risk 6/10 · Moderate
- Chance of severe wind over 30 yrs
- 27.0%
Air-quality risk 4/10 · Minor
- Unhealthy air days now
- 6 days/yr
- Unhealthy air days in 30 yrs
- 7 days/yr
Risk factors via First Street. Map © Google.
Why this score? — see what drove the B grade
The composite is a weighted blend of 9 inputs, each scored 0–100. Each bar is that input's sub-score; the figure is the points it added to the 100-point composite (weight × sub-score).
- Cash flow +29.5/30.0
- ARV discount +15.0/15.0
- DSCR +10.0/10.0
- 1% rule +8.1/10.0
- Livability +3.8/5.0
- Rent growth +2.9/5.0
- Condition / age +2.5/5.0
- Schools +1.0/10.0
- Appreciation +0.0/10.0
$140,000
🖨 Deal sheet (PDF) 📄 Offer letter ✓ Due diligence
Listing remarks MLS
Great opportunity in Baltimore City’s Coldstream Homestead Montebello neighborhood! This 3-bedroom, 2-bath brick rowhome is currently set up as a single-family home but offers excellent potential for additional income or future flexibility. Featuring a functional layout and solid structure, this property is perfect for a homeowner looking to build equity or an investor seeking their next rental or value-add project. With two electric meters already in place, there is potential for multi-unit use (buyer to verify). The home also includes basement area and is conveniently located near major commuter routes, shopping, and local amenities. Priced to sell and full of potential—don’t miss this opportunity!
Key facts
- Built 1922
- Listed 44 days
Property features AI
Exterior
- Parking: On-street parking
- Utilities: Public water; Public sewer; Natural gas service
- Home design: Interior townhouse/rowhouse; Fee simple ownership; Year built per assessor
- Construction: Brick construction; Other foundation type; Above- and below-grade structures noted
- Exterior features: Located within city limits
Interior
- Bedrooms: Three bedrooms on the first upper level
- Bathrooms: Two full bathrooms (one on main level, one on first upper level)
- Heating & cooling: Forced air heating; Natural gas hot water
- Interior features: Partial basement; Living area is an estimated value
Neighborhood map
What this means for you Summary
Snapshot
- This is a 3-bed/2.0-bath townhouse listed at $140k.
Deal economics
- At list price, monthly cash flow is $502 ($6k/yr) — positive.
- The deal already cash-flows at list — no discount required.
- Meets the 1% rule at list price ($2k rent vs $140k).
- Recommended offer: $136k (3.0% below list) — sets the bar for market timing.
- Cap rate 10.6% vs local median 6.0% in Baltimore — top-decile yield for the area; either an underpriced asset or a hidden risk that comps aren't pricing in. Stress-test before assuming the spread holds.
Location & tenants
- Location reads 76/100 on livability (#90 in MD, #3,396 nationally) — a middle-class / working-renter tenant base. Strengths: amenities A+, commute A+, housing A+; Watch: schools D, crime F.
- Baltimore City Public Schools (urban): math 7% / reading 16% proficiency, ranked #24 of 24 in MD (top 100%) — low school quality limits family demand, transient renter base, plan for 1-2y turnover; 79% free/reduced lunch — lower-income household profile, screen leases tightly.
- Market conditions: Rents rising (+1.6%/yr); 330 active listings in the ZIP; 40 comparable units currently listed for rent nearby; rentals at typical pace (median 25d on market — plan ~3-4 weeks tenant-placement turnaround); 48% of comp listings sitting > 30 days — soft ceiling on asking rent; 1,273 units permitted in Baltimore city in 2024 (1,104 in 5+ unit buildings).
- This rent runs 35% of the median local income ($62k/yr) — at the standard rent-burdened threshold; future hikes will face affordability resistance.
Forward outlook
- Local home prices are declining (-3.0%/yr); year-one equity from $968 of loan paydown is wiped out by about $4k of value loss. Plan a longer hold.
- Baltimore County population projected to shrink 4% by 2050 — rents likely to lag national; underwrite the cash flow, not the appreciation.
- At projected returns (-3.0% appreciation + 1.6% rent growth), your $39k cash investment doubles in ~9 years — after that, you're playing with house money.
Negotiation context
- It's been on market 44 days — a 3% lower offer ($136k) is reasonable based on typical stale-listing flexibility.
- 3 sale attempts since 4y ago with the ask held roughly flat each time — persistent listings suggest the price (not the market) is what's stuck; bring a comps-based counter.
- Current owner paid $25k; list at $140k implies a 460% gain — meaningful room to come down on a strong offer.
Risks & watch-outs
- Watch-outs: built in 1922 — expect roof / HVAC / electrical / plumbing capex.
- Climate carrying-cost: major wind risk, 27% chance of damaging wind over 30y; extreme-heat days projected 7→15/yr by 2055 (HVAC capex compounding) — expect insurance premiums to compound above CPI over the hold.
Questions for the listing agent
- It's been on market 44 days. Have you received any prior offers? Is the seller open to a 3% concession, seller financing, or rate buy-down credit?
- Built in 1922 — when were the roof, HVAC, electrical panel, plumbing, and water heater last replaced?
- Is there a deadline driving the sale (1031 exchange, divorce, estate, relocation)? That informs how much negotiation room exists.
- Schools are D-rated, which usually means shorter tenancies and higher turnover. Who's the typical renter profile here, and what's been the actual vacancy rate?
- Crime grade is F in this area — have there been break-ins, vandalism, or insurance claims at this property in the last 3 years? What carrier currently insures it and at what premium?
- What's the average days-on-market for RENTAL listings here right now (not sales)? A rising rental-DOM trend means longer vacancies and softer asking-rent achievability than the comps imply.
- What's the recent tenant-quality profile in this submarket — average credit score on applications, eviction rate, late-payment / NSF rate, and stable-employment percentage? A property-management company in the area should have these aggregated.
- How much new for-sale + rental construction is in the pipeline within 1–3 miles? Heavy new supply typically softens prices + rents 12–24 months out; constrained supply supports both.
Investment metrics
- 1% rule
- 1.31% ✓
- Cap rate
- 10.60%
- Cash-on-cash
- 15.37%
- DSCR
- 1.68
- GRM
- 6.3
CMA / ARV
- ARV (median comp)
- $204,832
- List price
- $140,000
- Delta
- -31.65%
- Verdict
- UNDERPRICED
- Comps
- 20 within 1.0 mi
Show comp detail 12 sales within ~0.75 mi
| Address | Dist | Beds/Ba | Sqft | Sold | Price | $/sf | Match |
|---|---|---|---|---|---|---|---|
| 1812 E 28th St | 0.13mi | 3/1.5 | 1,580 (+5%) | 5mo | $150,000 | $95 | 79 |
| 1841 E 30th St | 0.16mi | 3/1.5 | 1,400 (-7%) | 4mo | $175,000 | $125 | 76 |
| 1723 E 32nd St | 0.14mi | 3/2.0 | 1,280 (-15%) | 2mo | $128,000 | $100 | 67 |
| 1632 E 31st St | 0.10mi | 3/1.0 | 1,280 (-15%) | 0mo | $94,500 | $74 | 67 |
| 1809 E 32nd St | 0.17mi | 3/1.5 | 1,280 (-15%) | 1mo | $82,000 | $64 | 65 |
| 831 E 33rd St | 0.65mi | 3/2.0 | 1,470 (-2%) | 2mo | $300,000 | $204 | 64 |
| 1707 E 32nd St | 0.13mi | 3/3.0 | 1,280 (-15%) | 7mo | $260,000 | $203 | 60 |
| 2545 Cecil Ave | 0.52mi | 3/2.5 | 1,318 (-12%) | 1mo | $215,000 | $163 | 53 |
| 2560 Cecil Ave | 0.50mi | 3/3.0 | 1,300 (-13%) | 3mo | $210,000 | $162 | 48 |
| 3314 Ellerslie Ave | 0.69mi | 4/3.5 (+1) | 1,440 (-4%) | 6mo | $339,000 | $235 | 45 |
| 3712 Monterey Rd | 0.67mi | 3/2.0 | 1,705 (+14%) | 5mo | $254,000 | $149 | 42 |
| 3626 Kimble Rd | 0.73mi | 3/1.0 | 1,280 (-15%) | 2mo | $310,000 | $242 | 36 |
Match score weights: distance 35% · size 25% · config 20% · recency 20%. Top-matched comps best support the ARV.
Projected returns pro-forma
-3.0% appreciation · 1.63% rent growth · sell at horizon
- IRR
- 4.6%
- Equity multiple
- 1.17×
- Total profit
- $6,819
- Equity at exit
- $20,874
- IRR
- 12.8%
- Equity multiple
- 1.95×
- Total profit
- $37,219
- Equity at exit
- $12,105
Cash invested: $39,200 (down + closing). Projections, not guarantees.
Landlord ↔ Tenant lean methodology
- Overall (CITY)
- 12 Strongly Tenant-Friendly
- State Maryland
- 27 Tenant-Leaning · D+14
- County
- — inherits STATE
- City Baltimore
- 12 Strongly Tenant-Friendly · D+58
ZIP-level market 21218
- Rents YoY
- 1.6%
- Active inventory
- 330
- Price-to-rent
- 6.3×
Monthly cashflow live
- Estimated rent
- $1,837 high interval (Pro) →
- Mortgage (P&I)
- −$734
- Tax from tax record
- −$157 /mo · $1,881/yr
- Insurance
- −$58
- HOA
- −$0
- Vacancy / Maint / Mgmt
- −$386
- Net cashflow
- $502
Break-even live
Sensitivity live
| Price | -10% $581 | -5% $542 | +0% $502 | +5% $463 | +10% $423 |
|---|---|---|---|---|---|
| Rent | -10% $357 | -5% $430 | +0% $502 | +5% $575 | +10% $647 |
| Rate | -1.0pp $573 | -0.5pp $538 | base $502 | +0.5pp $466 | +1.0pp $429 |
UW: 25.0% down · 7.5% · 30yr · 1.5% tax · 5.0% vac · 8.0% maint · 8.0% mgmt
Financing live
Cash to close
- Down payment
- $35,000
- Closing costs
- $4,200
- Reserves months
- —
- Total cash needed
- —
Loan-product check · same deal, 3 products live
Conventional
25% down · 7.5% · 30yr
- Down + closing
- —
- Monthly P&I
- —
- Monthly cashflow
- —
- DSCR
- —
- Eligible?
- —
Personal DTI + credit; lowest rate.
DSCR
20% down · 8.5% · 30yr
- Down + closing
- —
- Monthly P&I
- —
- Monthly cashflow
- —
- DSCR
- —
- Eligible?
- —
No personal income docs; deal must DSCR.
Hard money
10% down · 12.0% · 12mo
- Down + closing
- —
- Monthly P&I
- —
- Monthly cashflow
- —
- DSCR
- —
- Eligible?
- —
Short-term bridge; refi at stabilization.
Rent comps 40 comps
| Address | Beds | Baths | Sqft | Rent | $/sqft | DOM | Units | Dist |
|---|---|---|---|---|---|---|---|---|
| 1802 E 28th St Baltimore, MD | 3.0 | 1.0 | 1300 | $1,600 | $1.23 | 25d | 1 | 0.10mi |
| 1832 E 28th St Baltimore, MD | 3.0 | 1.0 | 1066 | $1,495 | $1.40 | 25d | 1 | 0.14mi |
| 1702 E 32nd St Baltimore, MD | 3.0 | 2.0 | 1344 | $2,300 | $1.71 | 45d | 1 | 0.14mi |
| 1519 E 28th St Baltimore, MD | 3.0 | 2.0 | 1100 | $1,350 | $1.23 | 45d | 1 | 0.15mi |
| 1539 Abbotston St Baltimore, MD | 3.0 | 2.0 | 1800 | $1,995 | $1.11 | 45d | 1 | 0.22mi |
| 1539 Abbotston St Baltimore, MD | 3.0 | 2.0 | 1900 | $1,899 | $1.00 | 5d | 1 | 0.22mi |
| 3213 The Alameda Baltimore, MD | 2.0 | 1.0 | 1708 | $1,295 | $0.76 | 4d | 1 | 0.22mi |
| 2606 Cecil Ave Baltimore, MD | 2.0 | 1.5 | 1200 | $1,500 | $1.25 | 45d | 1 | 0.47mi |
| 1502 Fernley Rd Baltimore, MD | 3.0 | 2.0 | 1350 | $2,800 | $2.07 | 45d | 1 | 0.48mi |
| 936 Montpelier St Baltimore, MD | 2.0 | 1.0 | 1260 | $1,450 | $1.15 | 25d | 1 | 0.63mi |
| 3222 Ellerslie Ave Baltimore, MD | 4.0 | 1.5 | 1550 | $1,950 | $1.26 | 45d | 1 | 0.66mi |
| 1607 Cliftview Ave Baltimore, MD | 3.0 | 1.0 | 1200 | $1,475 | $1.23 | 45d | 1 | 0.71mi |
| 724 E 35th St Baltimore, MD | 3.0 | 1.5 | 1368 | $2,000 | $1.46 | 16d | 1 | 0.83mi |
| 616 Montpelier St Baltimore, MD | 3.0 | 1.0 | 1150 | $1,750 | $1.52 | 12d | 1 | 0.84mi |
| 721 E 36th St Unit Na Baltimore, MD | 2.0 | 1.0 | 1156 | $1,650 | $1.43 | 45d | 1 | 0.87mi |
| 519 E 28th St Baltimore, MD | 3.0 | 2.0 | 1500 | $2,000 | $1.33 | 5d | 1 | 0.88mi |
| 2113 Belair Rd Baltimore, MD | 3.0 | 1.0 | 1344 | $1,795 | $1.34 | 45d | 1 | 0.90mi |
| 4006 Loch Raven Blvd Baltimore, MD | 3.0 | 2.5 | 2016 | $2,695 | $1.34 | 19d | 1 | 0.93mi |
| 3213 Elmley Ave Baltimore, MD | 2.0 | 1.0 | 1188 | $1,395 | $1.17 | 45d | 1 | 0.93mi |
| 3005 Belair Rd Baltimore, MD | 3.0 | 2.0 | 2000 | $1,600 | $0.80 | 19d | 1 | 0.96mi |
| 3436 Cardenas Ave Baltimore, MD | 2.0 | 1.0 | 1146 | $1,395 | $1.22 | 45d | 1 | 0.96mi |
| 3222 Lyndale Ave Unit 1 Baltimore, MD | 3.0 | 1.5 | 1500 | $2,200 | $1.47 | 13d | 1 | 0.96mi |
| 1814 E Lafayette Ave Baltimore, MD | 4.0 | 2.0 | 1200 | $1,995 | $1.66 | 25d | 1 | 0.97mi |
| 3721 Ellerslie Ave Baltimore, MD | 1.0–3.0 | 1.0–2.0 | 894 | $1,603 | $1.79 | 3d | 1 | 0.97mi |
| 3515 Parklawn Ave Baltimore, MD | 3.0 | 2.0 | 1240 | $1,700 | $1.37 | 4d | 1 | 0.97mi |
| 1539 Ralworth Rd Baltimore, MD | 3.0 | 2.0 | 1580 | $1,950 | $1.23 | 16d | 1 | 0.98mi |
| 424 Ilchester Ave Baltimore, MD | 3.0 | 3.0 | 1976 | $1,800 | $0.91 | 16d | 1 | 1.00mi |
| 2828 Lake Ave Baltimore, MD | 3.0 | 2.0 | 1164 | $1,850 | $1.59 | 5d | 1 | 1.01mi |
| 450 E Lorraine Ave Baltimore, MD | 3.0 | 1.0 | 1344 | $1,695 | $1.26 | 45d | 1 | 1.01mi |
| 1333 E North Ave Baltimore, MD | 4.0 | 2.5 | 1860 | $2,200 | $1.18 | 25d | 1 | 1.01mi |
| 1829 N Port St Baltimore, MD | 3.0 | 1.5 | 2000 | $1,625 | $0.81 | 45d | 1 | 1.01mi |
| 1803 N Dallas St Baltimore, MD | 2.0 | 2.5 | 1250 | $2,100 | $1.68 | 25d | 1 | 1.01mi |
| 646 Cokesbury Ave Baltimore, MD | 2.0 | 1.5 | 1200 | $1,299 | $1.08 | 45d | 1 | 1.02mi |
| 1514 E Lafayette Ave Baltimore, MD | 3.0 | 1.5 | 1215 | $2,000 | $1.65 | 25d | 1 | 1.03mi |
| 1512 E Lafayette Ave Baltimore, MD | 3.0 | 2.5 | 1476 | $1,950 | $1.32 | 45d | 1 | 1.03mi |
| 3529 Greenmount Ave Baltimore, MD | 3.0 | 2.0 | 1316 | $1,575 | $1.20 | 45d | 1 | 1.03mi |
| 402 E 28th St Baltimore, MD | 3.0 | 1.0 | 1436 | $2,200 | $1.53 | 45d | 1 | 1.03mi |
| 428 E Lorraine Ave Unit 1 Baltimore, MD | 3.0 | 1.5 | 1344 | $1,875 | $1.40 | 45d | 1 | 1.03mi |
| 428 E Lorraine Ave Baltimore, MD | 3.0 | 2.0 | 1344 | $1,875 | $1.40 | 25d | 1 | 1.03mi |
| 1617 Argonne Dr Baltimore, MD | 4.0 | 2.0 | 1200 | $2,550 | $2.12 | 45d | 1 | 1.04mi |
Listing history 20 events
-
2026-06-21days on market $140,000 Active 44 DOM
-
2026-06-18days on market $140,000 Active 41 DOM
-
2026-06-17days on market $140,000 Active 40 DOM
-
2026-06-16days on market $140,000 Active 39 DOM
-
2026-06-15days on market $140,000 Active 38 DOM
Show marketing remark (728 chars)
Great opportunity in Baltimore City’s Coldstream Homestead Montebello neighborhood! This 3-bedroom, 2-bath brick rowhome is currently set up as a single-family home but offers excellent potential for additional income or future flexibility. Featuring a functional layout and solid structure, this property is perfect for a homeowner looking to build equity or an investor seeking their next rental or value-add project. With two electric meters already in place, there is potential for multi-unit use (buyer to verify). The home also includes basement area and is conveniently located near major commuter routes, shopping, and local amenities. Priced to sell and full of potential—don’t miss this opportunity!
-
2026-06-13days on market $140,000 Active 36 DOM
-
2026-06-09days on market $140,000 Active 32 DOM
-
2026-06-08days on market $140,000 Active 31 DOM
-
2026-06-07days on market $140,000 Active 30 DOM
-
2026-06-04days on market $140,000 Active 27 DOM
-
2026-06-03days on market $140,000 Active 26 DOM
-
2026-06-02days on market $140,000 Active 25 DOM
-
2026-06-01days on market $140,000 Active 24 DOM
-
2026-05-31days on market $140,000 Active 23 DOM
-
2026-05-08$140,000 Active 728-char remark
-
2026-04-28historical $140,000 728-char remark
-
2022-04-01status Pending
-
2022-04-01$172,000 Active
-
2022-04-01historical
-
1981-02-05soldstatus $25,000
ⓘ Source: listings_history table (triggers on properties + properties_extension) + one-shot
backfill from property_details.listing_events for pre-trigger history.
Tax reassessment forecast MD · Partial reset (capped growth)
- Current annual tax
- $1,881 · $157/mo
- Projected year-2 tax
- $1,881 · $157/mo
- Expected delta
- $0/yr ($0/mo · 0.0%)
ⓘ Screening estimate from a state-policy table — verify with the county assessor before closing.
Climate risk First Street
- Flood 1/10 Low FEMA zone X (unshaded) · 0% chance over 30 yrs
- Wildfire 1/10 Low
- Heat 7/10 Severe 7 d/yr ≥103°F today · 15 d/yr by 30 yrs out
- Wind 6/10 Major 27% chance of damaging wind over 30 yrs
- Air quality 4/10 Moderate 6 unhealthy d/yr today · 7 by 30 yrs out
Nearby sold comps map
Loading sold comps map…
Walkable amenities ~0.75 mi
Loading nearby amenities…
Taxation est. · year 1
- Rental income
- $22,048
- − Mortgage interest
- −$7,842
- − Property taxes
- −$1,881
- − Insurance
- −$700
- − Repairs & maintenance
- −$1,764
- − Management
- −$1,764
- − Depreciation
- −$4,073
- Taxable income
- $4,024
- Est. tax owed @ 24.0%
- −$966
- After-tax cash flow
- $5,061/yr
For passive investors: Depreciation is non-cash, so a rental often shows a tax loss while cash-flowing — sheltering income. Rental losses are passive: they offset passive income freely, and up to $25,000/yr can offset ordinary (W-2) income if you actively participate and your MAGI is under $100k (phasing out to $0 by $150k); unused losses carry forward. On sale, claimed depreciation is recaptured at up to 25%, and gains may owe capital-gains tax (a 1031 exchange can defer both). Figures are a year-1 estimate at your 24.0% rate — not tax advice; consult a CPA.
Schools (NCES district)
- District
- Baltimore City Public Schools
- NCES district ID
- 2400090
- Math proficiency
- 7% ▼ -9.00%
- Reading proficiency
- 16% ▼ -5.00%
- Median HH income
- $42,108
- Composite
- 10.08/100
- National rank
- #9805
- State rank
- #24 of 24 in MD
Livability — Baltimore
- Score
- 76/100
- State rank
- #90
- US rank
- #3396
Category grades
Schools grade is shown separately in the Schools card above.
Census & demographics
- Census place
- Baltimore, MD
- County
- Baltimore City · 558,601 people
- City population
- 588,727
- Metro
- Baltimore-Columbia-Towson, MD
- Population (ZIP)
- 44,014
- Household income
- $62,488
- Rent vs Own
- Severe rent burden
- 2564.0
Population outlook (Baltimore County) Hauer SSP2
- Today (2025)
- 624,249 people
- By 2030
- 621,541 · -0.4%
- By 2040
- 609,756 · -2.3%
- By 2050
- 597,249 · -4.3%
- By 2075
- 552,236 · -11.5%
- By 2100
- 513,934 · -17.7%
Race, ethnicity, and origin ACS 2023
- Neighborhood character
- Diverse neighborhood (Simpson 0.58)
- Race & ethnicity
- Black 60% White 26% Two or more races 6% Hispanic / Latino 5% Asian 5%
- Hispanic origin (detail)
- Common ancestry
- Romanian 2% Italian 1% Scotch-Irish 1%
- Foreign-born
- 10% · Canada, China, South Korea
- Languages at home
- 87% English-only · Spanish 4% French/Haitian/Cajun 2% Chinese 2%
Political lean MEDSL · Baltimore
- 2024 margin
- Solid D (+73.0) · D 85.2% · R 12.2% · Other 2.6%
- 2008→2024 swing
- -2.5pp toward R · 2008: 75.5pp · 2024: 73.0pp
- All cycles
- 2024: D+73.0 2020: D+76.6 2016: D+74.6 2012: D+76.4 2008: D+75.5
Not yet ingested
- Civics
- —
Market trends
- HPI YoY
- ▼ -463.14%
- Current HPI
- 292.3986
- Rent YoY
- ▲ 1.63%
- Metro
- Baltimore-Columbia-Towson, MD
- State GDP YoY
- ▲ 2.97%
- F500 in state
- 12
Industry mix (Fortune 500 HQ in MD)
| Industry | F500 HQs | Revenue |
|---|---|---|
| Aerospace / Defense | 1 | $71B |
|
||
| Utilities | 1 | $25B |
|
||
| Hotels | 1 | $24B |
|
||
| Consumer Goods | 1 | $7B |
|
||
| Real Estate | 1 | $6B |
|
||
| Chemicals | 1 | $2B |
|
||
Price history
+460.0% since first listed7 events — show timeline
- 2026-06-15 Listed $140,000 BRIGHT MLS
- 2026-05-08 Listed $140,000 BRIGHT MLS
- 2026-04-28 Coming Soon $140,000 BRIGHT MLS
- 2022-04-01 Pending — BRIGHT MLS
- 2022-04-01 Listed $172,000 BRIGHT MLS
- 2022-04-01 Listing Removed — BRIGHT MLS
- 1981-02-05 Sold (Public Records) $25,000 Public Records
Property tax history
+6.1%/yrLatest (2025): $1,881 · +22.5% YoY. Source: county tax records.
Cash-flow waterfall
monthlySold comps — $/sqft
last 12 mo · ≤1 miLoading sold comps…