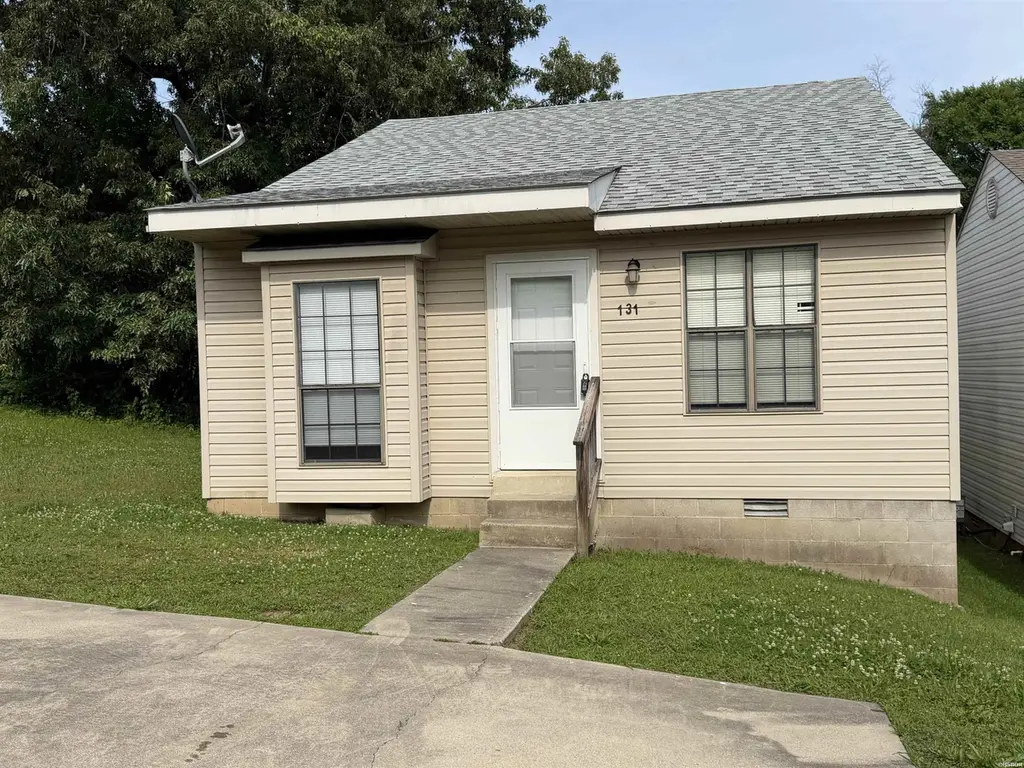
131 Rocky Reef Cir · Hot Springs, AR
Flood risk 1/10 · Minimal
- FEMA flood zone
- X (unshaded)
- Chance of flooding over 30 yrs
- 0.0%
- Est. flood insurance / yr
- $507 – $1,088
Fire risk 2/10 · Minimal
- Est. fire insurance / yr
- $1,499 – $2,785
Heat risk 6/10 · Moderate
- Hot days now (above 111°F)
- 7 days/yr
- Hot days in 30 yrs
- 21 days/yr
Wind risk 4/10 · Minor
- Chance of severe wind over 30 yrs
- 9.0%
Air-quality risk 1/10 · Minimal
- Unhealthy air days now
- 0 days/yr
- Unhealthy air days in 30 yrs
- 0 days/yr
Risk factors via First Street. Map © Google.
Why this score? — see what drove the C grade
The composite is a weighted blend of 9 inputs, each scored 0–100. Each bar is that input's sub-score; the figure is the points it added to the 100-point composite (weight × sub-score).
- Cash flow +28.3/30.0
- DSCR +10.0/10.0
- 1% rule +6.7/10.0
- Rent growth +4.1/5.0
- Livability +3.2/5.0
- Condition / age +2.5/5.0
- Schools +2.0/10.0
- ARV discount +0.0/15.0
- Appreciation +0.0/10.0
$123,000
🖨 Deal sheet 📄 Offer letter ✓ Due diligence
Listing remarks MLS
This cute 3 Bedroom 2 Bath single family home is ready for its new owner. This is the perfect starter home or a great investment opportunity. Don't miss out on this one.
Key facts
- 2,613 sq ft lot
- Built 1988
- Listed 9 days
Property features AI
Finance
- Other: Located in Rocky Reef #1 subdivision; Located in Garland County, Hot Springs National Park, AR
Exterior
- Parking: Parking pads
- Utilities: Public sewer; Municipal electric service (Entergy)
- Home design: Inside city limits
- Construction: Metal/vinyl siding; Architectural shingle roof; Slab and crawl space foundation
- Exterior features: Level lot in a subdivision; Paved road access; 30 x 96 lot (approximately)
Interior
- Kitchen: Electric range; Dishwasher
- Flooring: Carpet; Tile
- Bathrooms: 2 full bathrooms
- Heating & cooling: Central heating; Central cooling
- Interior features: Carpet and tile flooring; Den/family room; Laundry room
- Laundry & utility: Laundry room
Neighborhood map
What this means for you Summary
Snapshot
- This is a 3-bed/2.0-bath single-family listed at $123k.
Deal economics
- At list price, monthly cash flow is $396 ($5k/yr) — positive.
- The deal already cash-flows at list — no discount required.
- Meets the 1% rule at list price ($1k rent vs $123k).
- Cap rate 10.2% vs local median 2.8% in Hot Springs — top-decile yield for the area; either an underpriced asset or a hidden risk that comps aren't pricing in. Stress-test before assuming the spread holds.
Location & tenants
- Location reads 65/100 on livability (#140 in AR) — a middle-class / working-renter tenant base. Strengths: cost of living A+, housing A+, health & safety A-; Watch: schools D, crime F, amenities F.
- Hot Springs School District (urban): math 24% / reading 25% proficiency, ranked #195 of 238 in AR (top 82%) — low school quality limits family demand, transient renter base, plan for 1-2y turnover; 72% free/reduced lunch — lower-income household profile, screen leases tightly.
- Market conditions: Rents rising fast (+6.4%/yr); 986 active listings in the ZIP; 3 comparable units currently listed for rent nearby; rentals lingering (median 44d on market — plan ~5-8 weeks vacancy on turnover, expect pricing pressure); 100% of comp listings sitting > 30 days — soft ceiling on asking rent; 117 units permitted in Garland County in 2024 (24 in 5+ unit buildings).
- This rent runs 31% of the median local income ($56k/yr) — at the standard rent-burdened threshold; future hikes will face affordability resistance.
Forward outlook
- Local home prices are declining (-3.0%/yr); year-one equity from $850 of loan paydown is wiped out by about $4k of value loss. Plan a longer hold.
- Garland County population projected at +7% by 2050 — modest demand growth; plan on rents tracking national, not racing it.
- At projected returns (-3.0% appreciation + 6.4% rent growth), your $34k cash investment doubles in ~7 years — after that, you're playing with house money.
Negotiation context
- Only 9 days on market — expect competitive offers; lowballing is unlikely to land.
- 3 sale attempts since 14y ago with the ask held roughly flat each time — persistent listings suggest the price (not the market) is what's stuck; bring a comps-based counter.
- Current owner paid $94k; 30% above their basis — modest negotiation headroom, anchor on the comps not their cost.
Risks & watch-outs
- Climate carrying-cost: extreme-heat days projected 7→21/yr by 2055 (HVAC capex compounding) — expect insurance premiums to compound above CPI over the hold.
Questions for the listing agent
- Is there a deadline driving the sale (1031 exchange, divorce, estate, relocation)? That informs how much negotiation room exists.
- Schools are D-rated, which usually means shorter tenancies and higher turnover. Who's the typical renter profile here, and what's been the actual vacancy rate?
- Crime grade is F in this area — have there been break-ins, vandalism, or insurance claims at this property in the last 3 years? What carrier currently insures it and at what premium?
- What's the average days-on-market for RENTAL listings here right now (not sales)? A rising rental-DOM trend means longer vacancies and softer asking-rent achievability than the comps imply.
- What's the recent tenant-quality profile in this submarket — average credit score on applications, eviction rate, late-payment / NSF rate, and stable-employment percentage? A property-management company in the area should have these aggregated.
- How much new for-sale + rental construction is in the pipeline within 1–3 miles? Heavy new supply typically softens prices + rents 12–24 months out; constrained supply supports both.
Investment metrics
- 1% rule
- 1.17% ✓
- Cap rate
- 10.15%
- Cash-on-cash
- 13.79%
- DSCR
- 1.61
- GRM
- 7.1
CMA / ARV
- ARV (median comp)
- $94,973
- List price
- $123,000
- Delta
- 29.51%
- Verdict
- OVERPRICED
- Comps
- 20 within 1.0 mi
Show comp detail 7 sales within ~0.75 mi
| Address | Dist | Beds/Ba | Sqft | Sold | Price | $/sf | Match |
|---|---|---|---|---|---|---|---|
| 131 Rocky Reef Cir | 0.00mi | 3/2.0 | 984 (0%) | 1mo | $94,500 | $96 | 99 |
| 139 Rocky Reef Cir | 0.02mi | 3/2.0 | 984 (0%) | 19mo | $77,900 | $79 | 83 |
| 208 Rocky Reef Cir | 0.04mi | 2/2.0 (-1) | 1,038 (+6%) | 4mo | $118,000 | $114 | 81 |
| 149 Rocky Reef Cir | 0.05mi | 2/2.0 (-1) | 1,014 (+3%) | 16mo | $66,500 | $66 | 74 |
| 145 Rocky Reed Cir | 0.04mi | 2/2.0 (-1) | 1,010 (+3%) | 20mo | $80,000 | $79 | 72 |
| 147 Rocky Reef Cir | 0.05mi | 2/2.0 (-1) | 1,010 (+3%) | 20mo | $80,000 | $79 | 72 |
| 206 Rocky Reef Cir | 0.05mi | 2/2.0 (-1) | 931 (-5%) | 21mo | $90,000 | $97 | 66 |
Match score weights: distance 35% · size 25% · config 20% · recency 20%. Top-matched comps best support the ARV.
Projected returns pro-forma
-3.0% appreciation · 6.43% rent growth · sell at horizon
- IRR
- 7.4%
- Equity multiple
- 1.30×
- Total profit
- $10,348
- Equity at exit
- $18,340
- IRR
- 19.3%
- Equity multiple
- 2.85×
- Total profit
- $63,819
- Equity at exit
- $10,635
Cash invested: $34,440 (down + closing). Projections, not guarantees.
Landlord ↔ Tenant lean methodology
- Overall (STATE)
- 92 Strongly Landlord-Friendly
- State Arkansas
- 92 Strongly Landlord-Friendly · R+14
- County
- — inherits STATE
- City
- — inherits STATE
ZIP-level market 71913
- Home prices YoY
- -33.9%
- Rents YoY
- 6.4%
- Active inventory
- 986
- Price-to-rent
- 7.1×
Monthly cashflow live
- Estimated rent
- $1,434 medium interval (Pro) →
- Mortgage (P&I)
- −$645
- Tax from tax record
- −$41 /mo · $490/yr
- Insurance
- −$51
- HOA
- −$0
- Vacancy / Maint / Mgmt
- −$301
- Net cashflow
- $396
Break-even live
UW: 25.0% down · 7.5% · 30yr · 1.5% tax · 5.0% vac · 8.0% maint · 8.0% mgmt
Financing live
Cash to close
- Down payment
- $30,750
- Closing costs
- $3,690
- Reserves months
- —
- Total cash needed
- —
Loan-product check · same deal, 3 products live
Conventional
25% down · 7.5% · 30yr
- Down + closing
- —
- Monthly P&I
- —
- Monthly cashflow
- —
- DSCR
- —
- Eligible?
- —
Personal DTI + credit; lowest rate.
DSCR
20% down · 8.5% · 30yr
- Down + closing
- —
- Monthly P&I
- —
- Monthly cashflow
- —
- DSCR
- —
- Eligible?
- —
No personal income docs; deal must DSCR.
Hard money
10% down · 12.0% · 12mo
- Down + closing
- —
- Monthly P&I
- —
- Monthly cashflow
- —
- DSCR
- —
- Eligible?
- —
Short-term bridge; refi at stabilization.
Rent comps 3 comps
| Address | Beds | Baths | Sqft | Rent | $/sqft | DOM | Units | Dist |
|---|---|---|---|---|---|---|---|---|
| 389 Lake Hamilton Dr Hot Springs National Park, AR | 1.0–3.0 | 1.0–2.5 | 1137 | $1,750 | $1.54 | 44d | 16 | 0.86mi |
| 200 Lakeland Dr Hot Springs National Park, AR | 1.0–3.0 | 1.0–2.0 | 888 | $1,155 | $1.30 | 44d | 10 | 1.06mi |
| 180 Lakeland Dr Hot Springs, AR | 2.0 | 2.0 | 1116 | $1,500 | $1.34 | 44d | 1 | 1.10mi |
Listing history 10 events
-
2026-05-14status Under Contract 205-char remark
-
2026-05-05$123,000 Active 169-char remark
Show marketing remark (169 chars)
This cute 3 Bedroom 2 Bath single family home is ready for its new owner. This is the perfect starter home or a great investment opportunity. Don't miss out on this one.
-
2026-04-21$123,000 New Listing 205-char remark
-
2013-04-29soldstatus $53,000
-
2013-04-28soldstatus $53,000
Show marketing remark (114 chars)
Investor or Owner Occupant! Solid rental history of $595 monthly. Location close to everything. See Agent Remarks.
-
2013-02-22historical
Show marketing remark (114 chars)
Investor or Owner Occupant! Solid rental history of $595 monthly. Location close to everything. See Agent Remarks.
-
2012-09-17$55,000
Show marketing remark (114 chars)
Investor or Owner Occupant! Solid rental history of $595 monthly. Location close to everything. See Agent Remarks.
-
1997-11-07soldstatus $6,000
-
1996-02-20soldstatus $12,000
-
1992-01-08soldstatus $14,999
ⓘ Source: listings_history table (triggers on properties + properties_extension) + one-shot
backfill from property_details.listing_events for pre-trigger history.
Tax reassessment forecast AR · Resets to sale price
- Current annual tax
- $490 · $41/mo
- Projected year-2 tax
- $787 · $66/mo
- Expected delta
- +$297/yr (+$25/mo · 60.7%)
ⓘ Screening estimate from a state-policy table — verify with the county assessor before closing.
Climate risk First Street
- Flood 1/10 Low FEMA zone X (unshaded) · 0% chance over 30 yrs
- Wildfire 2/10 Low
- Heat 6/10 Major 7 d/yr ≥111°F today · 21 d/yr by 30 yrs out
- Wind 4/10 Moderate 9% chance of damaging wind over 30 yrs
- Air quality 1/10 Low 0 unhealthy d/yr today · 0 by 30 yrs out
Nearby sold comps map
Loading sold comps map…
Walkable amenities ~0.75 mi
Loading nearby amenities…
Taxation est. · year 1
- Rental income
- $17,208
- − Mortgage interest
- −$6,890
- − Property taxes
- −$490
- − Insurance
- −$615
- − Repairs & maintenance
- −$1,377
- − Management
- −$1,377
- − Depreciation
- −$3,578
- Taxable income
- $2,882
- Est. tax owed @ 24.0%
- −$692
- After-tax cash flow
- $4,058/yr
For passive investors: Depreciation is non-cash, so a rental often shows a tax loss while cash-flowing — sheltering income. Rental losses are passive: they offset passive income freely, and up to $25,000/yr can offset ordinary (W-2) income if you actively participate and your MAGI is under $100k (phasing out to $0 by $150k); unused losses carry forward. On sale, claimed depreciation is recaptured at up to 25%, and gains may owe capital-gains tax (a 1031 exchange can defer both). Figures are a year-1 estimate at your 24.0% rate — not tax advice; consult a CPA.
Schools (NCES district)
- District
- Hot Springs School District
- NCES district ID
- 0507890
- Math proficiency
- 24% ▼ -15.00%
- Reading proficiency
- 25% ▼ -12.00%
- Median HH income
- $28,817
- Composite
- 19.62/100
- National rank
- #8746
- State rank
- #195 of 238 in AR
Livability — Hot Springs
- Score
- 65/100
- State rank
- #140
- US rank
- #12498
Category grades
Schools grade is shown separately in the Schools card above.
Census & demographics
- Census place
- Hot Springs, AR
- County
- Garland County · 76,414 people
- City population
- 76,414
- Metro
- Hot Springs, AR
- Population (ZIP)
- 47,477
- Household income
- $56,010
- Rent vs Own
- Severe rent burden
- 1442.0
Population outlook (Garland County) Hauer SSP2
- Today (2025)
- 100,343 people
- By 2030
- 101,880 · +1.5%
- By 2040
- 104,804 · +4.4%
- By 2050
- 107,292 · +6.9%
- By 2075
- 113,182 · +12.8%
- By 2100
- 112,247 · +11.9%
Race, ethnicity, and origin ACS 2023
- Neighborhood character
- Predominantly White (79%)
- Race & ethnicity
- White 79% Hispanic / Latino 8% Black 8% Two or more races 6% Asian 1%
- Hispanic origin (detail)
- Mexican 6%
- Common ancestry
- Italian 3% Lithuanian 2% Slovak 2%
- Foreign-born
- 5% · Canada
- Languages at home
- 91% English-only · Spanish 7% Other Indo-European 1%
Political lean MEDSL · Garland
- 2024 margin
- Solid R (+36.2) · D 30.8% · R 67.0% · Other 2.2%
- 2008→2024 swing
- -11.3pp toward R · 2008: -25.0pp · 2024: -36.2pp
- All cycles
- 2024: R+36.2 2020: R+34.0 2016: R+34.1 2012: R+29.9 2008: R+25.0
Not yet ingested
- Civics
- —
Market trends
- HPI YoY
- ▼ -137.67%
- Current HPI
- 268.5228
- Rent YoY
- ▲ 6.43%
- Metro
- Hot Springs, AR
- State GDP YoY
- ▲ 3.80%
- F500 in state
- 10
Industry mix (Fortune 500 HQ in AR)
| Industry | F500 HQs | Revenue |
|---|---|---|
| Retail | 1 | $681B |
|
||
| Food / Agriculture | 1 | $53B |
|
||
| Retail / Energy | 1 | $22B |
|
||
| Transportation / Logistics | 1 | $12B |
|
||
| Energy | 1 | $4B |
|
||
Price history
+530.0% since first listed13 events — show timeline
- 2026-06-05 Sold (Public Records) $94,500 Public Records
- 2026-06-01 Sold (MLS) $94,500 HSBOR
- 2026-06-01 Sold (MLS) $94,500 CARMLS
- 2026-05-14 Pending — CARMLS
- 2026-05-05 Listed $123,000 HSBOR
- 2026-04-21 Listed $123,000 CARMLS
- 2013-04-29 Sold (Public Records) $53,000 Public Records
- 2013-04-28 Sold (MLS) $53,000 CARMLS
- 2013-02-22 Listing Removed — CARMLS
- 2012-09-17 Listed $55,000 CARMLS
- 1997-11-07 Sold (Public Records) $6,000 Public Records
- 1996-02-20 Sold (Public Records) $12,000 Public Records
- 1992-01-08 Sold (Public Records) $14,999 Public Records
Property tax history
+13.8%/yrLatest (2025): $490 · -1.3% YoY. Source: county tax records.
Cash-flow waterfall
monthlySold comps — $/sqft
last 12 mo · ≤1 miLoading sold comps…