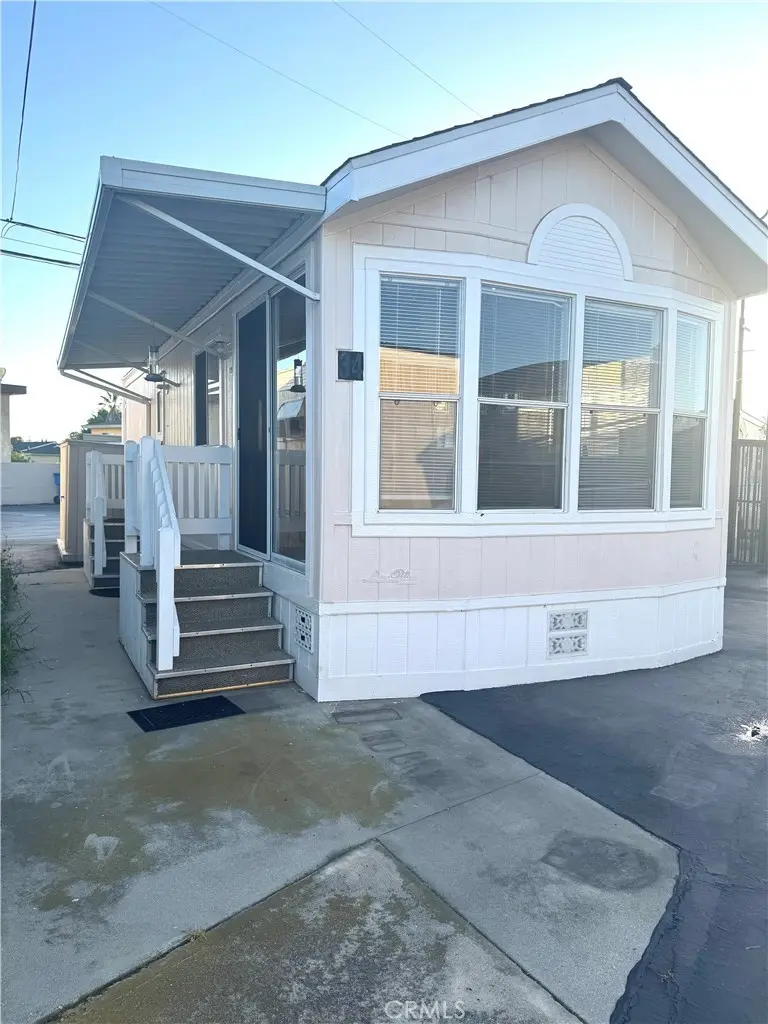
20315 Denker Ave #34 · Los Angeles, CA
Flood risk 3/10 · Minor
- FEMA flood zone
- X (unshaded)
- Chance of flooding over 30 yrs
- 0.12%
- Est. flood insurance / yr
- $507 – $1,088
Fire risk 1/10 · Minimal
- Est. fire insurance / yr
- $659 – $1,223
Heat risk 4/10 · Minor
- Hot days now (above 87°F)
- 7 days/yr
- Hot days in 30 yrs
- 21 days/yr
Wind risk 1/10 · Minimal
- Chance of severe wind over 30 yrs
- —
Air-quality risk 5/10 · Moderate
- Unhealthy air days now
- 7 days/yr
- Unhealthy air days in 30 yrs
- 7 days/yr
Risk factors via First Street. Map © Google.
Why this score? — see what drove the C grade
The composite is a weighted blend of 9 inputs, each scored 0–100. Each bar is that input's sub-score; the figure is the points it added to the 100-point composite (weight × sub-score).
- Cash flow +27.1/30.0
- DSCR +9.4/10.0
- 1% rule +7.3/10.0
- Schools +3.6/10.0
- Livability +3.4/5.0
- Rent growth +3.3/5.0
- Condition / age +2.8/5.0
- ARV discount +0.0/15.0
- Appreciation +0.0/10.0
$130,000
🖨 Deal sheet 📄 Offer letter ✓ Due diligence
Listing remarks
This cozy 1-bedroom, 1-bathroom manufactured house located in the city of Torrance. The home offers a fresh, modern living space perfectly suited for a streamlined lifestyle. Key Interior Features an Open Living & Dining with a functional layout that seamlessly connects the living room to the kitchen with a center island, perfect for meal prep or casual dining, along with a dedicated eating area. Currently undergoing though a new waterproof flooring installation throughout, ensuring both durability and a contemporary aesthetic. New blinds throughout, allowing for plenty of natural light while maintaining your privacy. And for your convenience, a new AC and heating system has been inst
Key facts
- Waterproof flooring
- Open living
- Functional layout
Tags
Property features AI
Finance
- Other: Manager approval required; Directions: GPS; access road with maintained, paved surface
- Financial info: Monthly land lease of $1,000 (park-managed land lease)
- HOA & community: Park name: ABC Wishing Well; Onsite property management; Street lighting; Pets permitted with rules and breed restrictions; Association notes include pet rules, weight limit, and sewer
Exterior
- Parking: Assigned parking; Two uncovered parking spaces
- Security: On-site resident manager; Carbon monoxide and smoke detectors
- Utilities: District/public water; Sewer paid / public sewer (connected); Standard electric service (electricity on property and connected); Natural gas available and connected; Cable available; Telephone in street; Water connected
- Home design: Single-story home; One level; Entry at floor level; Updated/remodeled condition; Has a view; Mobile home remains on site (model CCH, 12' x 34')
- Construction: Raised foundation; Construction materials listed as unknown
- Exterior features: Shingle roof; Awning; Patio; One shed; No landscaping; Lot-level/flat; Near public transit
Interior
- Kitchen: Remodeled kitchen; Kitchen island; Formica and laminate counters; Self-cleaning oven; Range/stove hood; Gas & electric range; Water heater unit
- Bedrooms: All bedrooms on ground floor; Main floor bedroom
- Flooring: Laminate flooring
- Bathrooms: One full bathroom with shower-tub combination; Bathtub; Low-flow shower; Low-flow toilet(s)
- Heating & cooling: Combination heating; Electric cooling; Evaporative cooling
- Interior features: Unfurnished; High ceilings (9 feet+); Open floor plan; Storage space; Formica counters; Sliding glass door(s); Panel doors; Blinds; Window screens; Linen closet/storage; Carbon monoxide detector(s); Smoke detector; Resident manager
- Laundry & utility: Community laundry
Neighborhood map
What this means for you Summary
Snapshot
- This is a 1-bed/1.0-bath manufactured listed at $130k. Condition is rated average.
Deal economics
- At list price, monthly cash flow is $369 ($4k/yr) — positive.
- The deal already cash-flows at list — no discount required.
- Meets the 1% rule at list price ($2k rent vs $130k).
- Recommended offer: $126k (3.0% below list) — sets the bar for market timing.
- Cap rate 9.7% vs local median 2.1% in Los Angeles — top-decile yield for the area; either an underpriced asset or a hidden risk that comps aren't pricing in. Stress-test before assuming the spread holds.
Location & tenants
- Location reads 68/100 on livability (#273 in CA) — a middle-class / working-renter tenant base. Strengths: amenities A+, commute A+, employment B; Watch: health & safety C-, schools D+, crime F.
- Los Angeles Unified (urban): math 29% / reading 54% proficiency, ranked #223 of 517 in CA (top 43%) — families likely to look elsewhere, expect single-tenant / working-renter base with shorter leases; 67% free/reduced lunch — lower-income household profile, screen leases tightly.
- Market conditions: Rents rising (+3.2%/yr); 96 active listings in the ZIP; 2 comparable units currently listed for rent nearby; solid renter incomes; 19,697 units permitted in Los Angeles County in 2024 (9,426 in 5+ unit buildings).
Forward outlook
- Local home prices are declining (-3.0%/yr); year-one equity from $899 of loan paydown is wiped out by about $4k of value loss. Plan a longer hold.
- Los Angeles County population projected at +9% by 2050 — modest demand growth; plan on rents tracking national, not racing it.
- At projected returns (-3.0% appreciation + 3.2% rent growth), your $36k cash investment doubles in ~9 years — after that, you're playing with house money.
Negotiation context
- It's been on market 52 days — a 3% lower offer ($126k) is reasonable based on typical stale-listing flexibility.
Questions for the listing agent
- It's been on market 52 days. Have you received any prior offers? Is the seller open to a 3% concession, seller financing, or rate buy-down credit?
- Is there a deadline driving the sale (1031 exchange, divorce, estate, relocation)? That informs how much negotiation room exists.
- Schools are D-rated, which usually means shorter tenancies and higher turnover. Who's the typical renter profile here, and what's been the actual vacancy rate?
- Crime grade is F in this area — have there been break-ins, vandalism, or insurance claims at this property in the last 3 years? What carrier currently insures it and at what premium?
- What's the average days-on-market for RENTAL listings here right now (not sales)? A rising rental-DOM trend means longer vacancies and softer asking-rent achievability than the comps imply.
- What's the recent tenant-quality profile in this submarket — average credit score on applications, eviction rate, late-payment / NSF rate, and stable-employment percentage? A property-management company in the area should have these aggregated.
- How much new for-sale + rental construction is in the pipeline within 1–3 miles? Heavy new supply typically softens prices + rents 12–24 months out; constrained supply supports both.
Investment metrics
- 1% rule
- 1.23% ✓
- Cap rate
- 9.70%
- Cash-on-cash
- 12.17%
- DSCR
- 1.54
- GRM
- 6.8
CMA / ARV
- ARV (median comp)
- $105,910
- List price
- $130,000
- Delta
- 22.75%
- Verdict
- OVERPRICED
- Comps
- 2 within 1.0 mi
Show comp detail 1 sale within ~0.75 mi
| Address | Dist | Beds/Ba | Sqft | Sold | Price | $/sf | Match |
|---|---|---|---|---|---|---|---|
| 20315 Denker Ave #28 | 0.00mi | 1/1.0 | 456 (+12%) | 6mo | $130,000 | $285 | 75 |
Match score weights: distance 35% · size 25% · config 20% · recency 20%. Top-matched comps best support the ARV.
Projected returns pro-forma
-3.0% appreciation · 3.25% rent growth · sell at horizon
- IRR
- 2.0%
- Equity multiple
- 1.08×
- Total profit
- $2,866
- Equity at exit
- $19,383
- IRR
- 11.9%
- Equity multiple
- 1.95×
- Total profit
- $34,526
- Equity at exit
- $11,240
Cash invested: $36,400 (down + closing). Projections, not guarantees.
Landlord ↔ Tenant lean methodology
- Overall (CITY)
- 0 Strongly Tenant-Friendly
- State California
- 18 Strongly Tenant-Friendly · D+13
- County
- — inherits STATE
- City Los Angeles
- 0 Strongly Tenant-Friendly · D+22
ZIP-level market 90501
- Rents YoY
- 3.2%
- Active inventory
- 96
- Price-to-rent
- 6.8×
Monthly cashflow live
- Estimated rent
- $1,604 medium interval (Pro) →
- Mortgage (P&I)
- −$682
- Tax est. 1.5%
- −$162 /mo · $1,950/yr
- Insurance
- −$54
- HOA
- −$0
- Vacancy / Maint / Mgmt
- −$337
- Net cashflow
- $369
Break-even live
UW: 25.0% down · 7.5% · 30yr · 1.5% tax · 5.0% vac · 8.0% maint · 8.0% mgmt
Financing live
Cash to close
- Down payment
- $32,500
- Closing costs
- $3,900
- Reserves months
- —
- Total cash needed
- —
Loan-product check · same deal, 3 products live
Conventional
25% down · 7.5% · 30yr
- Down + closing
- —
- Monthly P&I
- —
- Monthly cashflow
- —
- DSCR
- —
- Eligible?
- —
Personal DTI + credit; lowest rate.
DSCR
20% down · 8.5% · 30yr
- Down + closing
- —
- Monthly P&I
- —
- Monthly cashflow
- —
- DSCR
- —
- Eligible?
- —
No personal income docs; deal must DSCR.
Hard money
10% down · 12.0% · 12mo
- Down + closing
- —
- Monthly P&I
- —
- Monthly cashflow
- —
- DSCR
- —
- Eligible?
- —
Short-term bridge; refi at stabilization.
Rent comps 2 comps
| Address | Beds | Baths | Sqft | Rent | $/sqft | DOM | Units | Dist |
|---|---|---|---|---|---|---|---|---|
| 1646 Cabrillo Ave Unit 240 Torrance, CA | — | 1.0 | 300 | $1,006 | $3.35 | 43d | 1 | 1.15mi |
| 1646 Cabrillo Ave Unit 228 Torrance, CA | — | 1.0 | 375 | $1,102 | $2.94 | 24d | 1 | 1.15mi |
Listing history 14 events
-
2026-06-18days on market $130,000 Active 52 DOM
-
2026-06-17days on market $130,000 Active 51 DOM
-
2026-06-16days on market $130,000 Active 50 DOM
-
2026-06-15days on market $130,000 Active 49 DOM
-
2026-06-13days on market $130,000 Active 47 DOM
-
2026-06-09days on market $130,000 Active 43 DOM
-
2026-06-08days on market $130,000 Active 42 DOM
-
2026-06-07days on market $130,000 Active 41 DOM
-
2026-06-04days on market $130,000 Active 38 DOM
-
2026-06-03days on market $130,000 Active 37 DOM
-
2026-06-02days on market $130,000 Active 36 DOM
-
2026-06-01days on market $130,000 Active 35 DOM
-
2026-05-31days on market $130,000 Active 34 DOM
-
2026-04-27$130,000 Active 1269-char remark
ⓘ Source: listings_history table (triggers on properties + properties_extension) + one-shot
backfill from property_details.listing_events for pre-trigger history.
Climate risk First Street
- Flood 3/10 Moderate FEMA zone X (unshaded) · 12% chance over 30 yrs
- Wildfire 1/10 Low
- Heat 4/10 Moderate 7 d/yr ≥87°F today · 21 d/yr by 30 yrs out
- Wind 1/10 Low
- Air quality 5/10 Major 7 unhealthy d/yr today · 7 by 30 yrs out
Nearby sold comps map
Loading sold comps map…
Walkable amenities ~0.75 mi
Loading nearby amenities…
Taxation est. · year 1
- Rental income
- $19,252
- − Mortgage interest
- −$7,282
- − Property taxes
- −$1,950
- − Insurance
- −$650
- − Repairs & maintenance
- −$1,540
- − Management
- −$1,540
- − Depreciation
- −$3,782
- Taxable income
- $2,508
- Est. tax owed @ 24.0%
- −$602
- After-tax cash flow
- $3,826/yr
For passive investors: Depreciation is non-cash, so a rental often shows a tax loss while cash-flowing — sheltering income. Rental losses are passive: they offset passive income freely, and up to $25,000/yr can offset ordinary (W-2) income if you actively participate and your MAGI is under $100k (phasing out to $0 by $150k); unused losses carry forward. On sale, claimed depreciation is recaptured at up to 25%, and gains may owe capital-gains tax (a 1031 exchange can defer both). Figures are a year-1 estimate at your 24.0% rate — not tax advice; consult a CPA.
Condition & rehab AI · 12 photos
This 1-bedroom, 1-bathroom manufactured home offers a fresh, modern living space with average condition. It requires cosmetic updates to kitchen cabinets, bathroom fixtures, and HVAC unit to enhance its resale and rental value.
Repairs flagged
- Minor kitchen cabinets — existing cabinets need updating
- Minor bathroom fixtures — existing fixtures need updating
- Minor HVAC unit — existing AC unit needs cleaning
Value-add opportunities
- Resale new kitchen cabinets — modern cabinets improve aesthetics and functionality
- Resale new bathroom fixtures — updated fixtures enhance the bathroom's appeal
- Rental new HVAC unit — modern AC unit improves comfort and energy efficiency
Renovation cost estimate screening
| Repair item | Severity | Est. cost |
|---|---|---|
| kitchen cabinets · existing cabinets need updating | Minor | $500–3,000 |
| bathroom fixtures · existing fixtures need updating | Minor | $500–3,000 |
| HVAC unit · existing AC unit needs cleaning | Minor | $500–3,000 |
| Total estimated repair cost · 3 items | $1,500–9,000 |
Value-add ROI direction
- Resale new kitchen cabinets — modern cabinets improve aesthetics and functionality ↑
- Resale new bathroom fixtures — updated fixtures enhance the bathroom's appeal ↑
- Rental new HVAC unit — modern AC unit improves comfort and energy efficiency ↑
ⓘ Cost ranges are severity-bucket heuristics (US national rule-of-thumb). Get contractor quotes + a written scope before underwriting a rehab budget.
Schools (NCES district)
- District
- Los Angeles Unified
- NCES district ID
- 0622710
- Math proficiency
- 29% ▼ -4.00%
- Reading proficiency
- 54% ▲ 10.00%
- Median HH income
- $50,403
- Composite
- 35.67/100
- National rank
- #4875
- State rank
- #223 of 517 in CA
Livability — Los Angeles
- Score
- 68/100
- State rank
- #273
- US rank
- #9237
Category grades
Schools grade is shown separately in the Schools card above.
Census & demographics
- Census place
- Los Angeles, CA
- County
- Los Angeles County · 9,444,647 people
- City population
- 3,838,149
- Metro
- Los Angeles-Long Beach-Anaheim, CA
- Population (ZIP)
- 41,787
- Household income
- $92,923
- Rent vs Own
- Severe rent burden
- 1972.0
Population outlook (Los Angeles County) Hauer SSP2
- Today (2025)
- 10,940,515 people
- By 2030
- 11,256,481 · +2.9%
- By 2040
- 11,729,929 · +7.2%
- By 2050
- 11,948,407 · +9.2%
- By 2075
- 11,818,114 · +8.0%
- By 2100
- 10,842,928 · -0.9%
Race, ethnicity, and origin ACS 2023
- Neighborhood character
- Diverse neighborhood (Simpson 0.70)
- Race & ethnicity
- Hispanic / Latino 43% Asian 27% White 20% Two or more races 15% Black 5%
- Hispanic origin (detail)
- Mexican 34%
- Common ancestry
- Slovak 1% Lithuanian 1% British 1%
- Foreign-born
- 33% · Canada, South Korea, China
- Languages at home
- 46% English-only · Spanish 32% Other Asian/Pacific 5% Korean 5%
Political lean MEDSL · Los Angeles
- 2024 margin
- Solid D (+32.9) · D 64.8% · R 31.9% · Other 3.3%
- 2008→2024 swing
- -7.4pp toward R · 2008: 40.4pp · 2024: 32.9pp
- All cycles
- 2024: D+32.9 2020: D+44.2 2016: D+48.0 2012: D+40.0 2008: D+40.4
Not yet ingested
- Civics
- —
Market trends
- HPI YoY
- ▼ -755.95%
- Current HPI
- 334.9041
- Rent YoY
- ▲ 3.25%
- Metro
- Los Angeles-Long Beach-Anaheim, CA
- State GDP YoY
- ▲ 3.21%
- F500 in state
- 116
Industry mix (Fortune 500 HQ in CA)
| Industry | F500 HQs | Revenue |
|---|---|---|
| Technology | 27 | $1,492B |
|
||
| Financial Services | 3 | $174B |
|
||
| Retail | 3 | $44B |
|
||
| Insurance | 3 | $26B |
|
||
| Media / Entertainment | 2 | $115B |
|
||
| Pharmaceuticals / Biotech | 2 | $62B |
|
||
Price history
1 event — show timeline
- 2026-04-27 Listed $130,000 CRMLS
Cash-flow waterfall
monthlySold comps — $/sqft
last 12 mo · ≤1 miLoading sold comps…