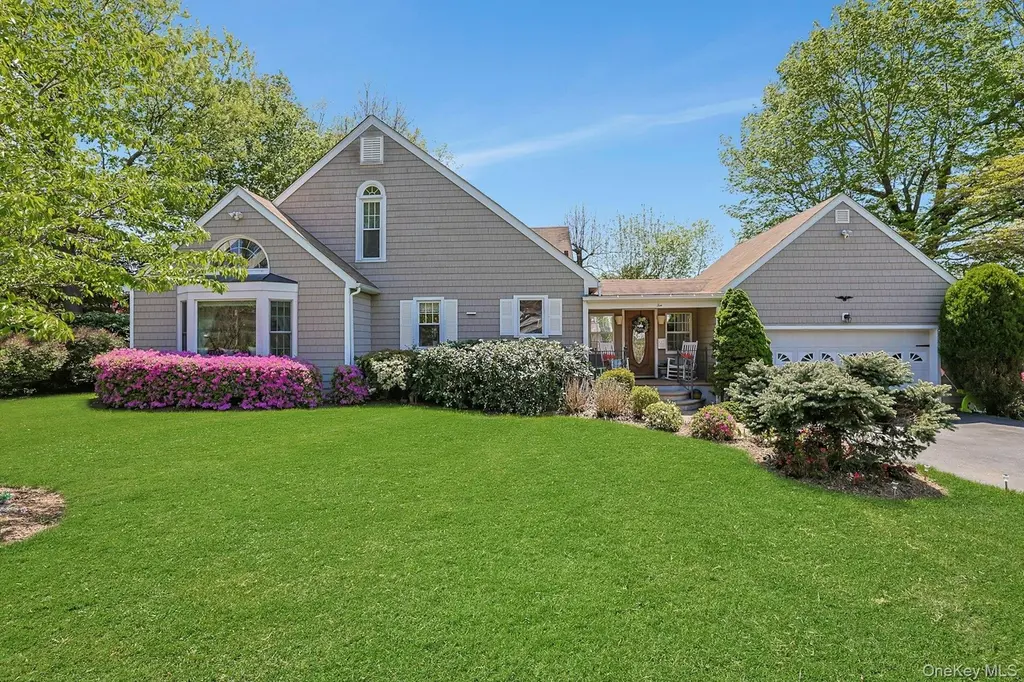
10 E Linwood St · Valhalla, NY
Flood risk 1/10 · Minimal
- FEMA flood zone
- X (unshaded)
- Chance of flooding over 30 yrs
- 0.0%
- Est. flood insurance / yr
- $473 – $860
Fire risk 2/10 · Minimal
- Est. fire insurance / yr
- $691 – $1,283
Heat risk 5/10 · Moderate
- Hot days now (above 98°F)
- 7 days/yr
- Hot days in 30 yrs
- 14 days/yr
Wind risk 6/10 · Moderate
- Chance of severe wind over 30 yrs
- 27.0%
Air-quality risk 4/10 · Minor
- Unhealthy air days now
- 4 days/yr
- Unhealthy air days in 30 yrs
- 6 days/yr
Risk factors via First Street. Map © Google.
Why this score? — see what drove the B- grade
The composite is a weighted blend of 9 inputs, each scored 0–100. Each bar is that input's sub-score; the figure is the points it added to the 100-point composite (weight × sub-score).
- Cash flow +29.2/30.0
- DSCR +10.0/10.0
- 1% rule +8.2/10.0
- ARV discount +7.3/15.0
- Schools +6.0/10.0
- Livability +3.2/5.0
- Rent growth +2.5/5.0
- Condition / age +2.5/5.0
- Appreciation +0.0/10.0
$985,000
🖨 Deal sheet 📄 Offer letter ✓ Due diligence
Listing remarks
Final and best Tuesday 5/19/26 at 4:00. This expanded Cape/Colonial offers the best of modern luxury, elegant amenities with attention to detail all in this private setting. This home is meticulously maintained boasting pride of ownership and is nestled on a quiet dead-end street. As you approach the home, you're greeted by a professionally landscaped yard featuring an array of vibrant perennials complemented by lush shrubbery. The welcoming front porch transitions seamlessly into a bright breezeway where sliding glass doors open up to a deck and fenced in yard. Updated kitchen features white cabinetry, granite counters, stainless steel appliances, and seating for 4 on island. Step into for
Key facts
- 0.23 acre lot
- 2 garage spots
- Built 1955
Property features AI
Exterior
- Parking: Driveway; Garage; Total parking for 4 vehicles; 2-car garage
- Utilities: Con-Edison electric; Public sewer; Water connected; Sewer connected; Cable connected; Public trash collection
- Home design: Single-family residence; Two levels; Full, partially finished basement; Full and partially finished attic
- Construction: Frame construction with vinyl siding
- Exterior features: Level lot; Back yard fenced
Interior
- Kitchen: Open, eat-in kitchen with breakfast bar and granite counters; Dishwasher; Microwave
- Bedrooms: Bedrooms on two levels (master downstairs, additional bedroom on first floor)
- Flooring: Carpet; Ceramic tile; Hardwood
- Bathrooms: 2 full bathrooms; 2 half bathrooms
- Heating & cooling: Hot water heating; Ductless cooling; Wall/window air conditioning units
- Interior features: First-floor bedroom; First-floor full bath; Breakfast bar; Built-in features; Cathedral ceilings; Ceiling fans; Eat-in kitchen; Formal dining room; Granite counters; High ceilings; Open kitchen; Master bedroom on main level; Storage; Walk-through kitchen; Whole-house entertainment system
- Laundry & utility: Washer/dryer hookup; Laundry located in basement; Dryer
Neighborhood map
What this means for you Summary
Snapshot
- This is a 4-bed/1.0-bath single-family listed at $985k.
Deal economics
- At list price, monthly cash flow is $3k ($41k/yr) — positive.
- The deal already cash-flows at list — no discount required.
- Meets the 1% rule at list price ($13k rent vs $985k).
- Cap rate 10.5% vs local median 3.8% in Valhalla — top-decile yield for the area; either an underpriced asset or a hidden risk that comps aren't pricing in. Stress-test before assuming the spread holds.
Location & tenants
- Location reads 63/100 on livability (#795 in NY) — a middle-class / working-renter tenant base. Strengths: crime A+, employment A+, commute A; Watch: amenities F, cost of living F, health & safety F.
- Mount Pleasant Central School District (suburban): math 62% / reading 65% proficiency, ranked #146 of 590 in NY (top 25%) — acceptable for families but not a draw, mixed tenant base, ~2y average lease; only 5% free/reduced lunch — higher-income household profile.
- Zoned schools: Hawthorne Elementary School (460 students, 10% FRL); Westlake Middle School (math 55% / reading 61%, grade B, #184 of 729 statewide, top 25%, 429 students, 14% FRL); Westlake High School (math 72% / reading 95%, grade A, #409 of 1,100 statewide, top 39%, 547 students, 19% FRL).
- Market conditions: 28 active listings in the ZIP; 1 comparable units currently listed for rent nearby; 954 units permitted in Westchester County in 2024 (649 in 5+ unit buildings).
Forward outlook
- Local home prices are declining (-3.0%/yr); year-one equity from $7k of loan paydown is wiped out by about $30k of value loss. Plan a longer hold.
- Westchester County population projected at +10% by 2050 — modest demand growth; plan on rents tracking national, not racing it.
- At projected returns (-3.0% appreciation + 3.0% rent growth), your $276k cash investment doubles in ~8 years — after that, you're playing with house money.
Negotiation context
- Only 9 days on market — expect competitive offers; lowballing is unlikely to land.
Risks & watch-outs
- Watch-outs: built in 1955 — expect roof / HVAC / electrical / plumbing capex.
- Climate carrying-cost: major wind risk, 27% chance of damaging wind over 30y; extreme-heat days projected 7→14/yr by 2055 (HVAC capex compounding) — expect insurance premiums to compound above CPI over the hold.
Questions for the listing agent
- Built in 1955 — when were the roof, HVAC, electrical panel, plumbing, and water heater last replaced?
- Is there a deadline driving the sale (1031 exchange, divorce, estate, relocation)? That informs how much negotiation room exists.
- What's the average days-on-market for RENTAL listings here right now (not sales)? A rising rental-DOM trend means longer vacancies and softer asking-rent achievability than the comps imply.
- What's the recent tenant-quality profile in this submarket — average credit score on applications, eviction rate, late-payment / NSF rate, and stable-employment percentage? A property-management company in the area should have these aggregated.
- How much new for-sale + rental construction is in the pipeline within 1–3 miles? Heavy new supply typically softens prices + rents 12–24 months out; constrained supply supports both.
Investment metrics
- 1% rule
- 1.32% ✓
- Cap rate
- 10.46%
- Cash-on-cash
- 14.87%
- DSCR
- 1.66
- GRM
- 6.3
CMA / ARV
- ARV (on-the-fly)
- $981,447
- Comps found
- 10
Show comp detail 10 sales within ~0.75 mi
| Address | Dist | Beds/Ba | Sqft | Sold | Price | $/sf | Match |
|---|---|---|---|---|---|---|---|
| 31 W Linwood St | 0.13mi | 3/3.0 (-1) | 2,625 (+4%) | 2mo | $999,999 | $381 | 73 |
| 12 Heath Rd | 0.15mi | 4/2.0 | 2,350 (-7%) | 10mo | $989,000 | $421 | 69 |
| 17 W Linwood St | 0.08mi | 4/2.5 | 2,750 (+9%) | 22mo | $999,000 | $363 | 57 |
| 120 Westlake Dr | 0.14mi | 5/3.0 (+1) | 2,713 (+8%) | 13mo | $987,000 | $364 | 57 |
| 16 Highclere Ln Unit A | 0.69mi | 3/3.0 (-1) | 2,432 (-4%) | 2mo | $999,999 | $411 | 47 |
| 4 Clover Rd | 0.31mi | 4/3.5 | 2,240 (-11%) | 19mo | $1,139,000 | $508 | 41 |
| 230 Westlake Dr | 0.53mi | 3/1.0 (-1) | 2,887 (+14%) | 7mo | $685,000 | $237 | 41 |
| 30 Highclere Ln | 0.73mi | 3/3.0 (-1) | 2,276 (-10%) | 2mo | $1,060,000 | $466 | 36 |
| 21 Bruce Ln | 0.69mi | 4/3.5 | 2,156 (-14%) | 2mo | $668,000 | $310 | 32 |
| 8 Colonial Ln | 0.75mi | 4/2.5 | 2,178 (-14%) | 16mo | $847,500 | $389 | 23 |
Match score weights: distance 35% · size 25% · config 20% · recency 20%. Top-matched comps best support the ARV.
Projected returns pro-forma
-3.0% appreciation · 3.0% rent growth · sell at horizon
- IRR
- 5.4%
- Equity multiple
- 1.21×
- Total profit
- $58,286
- Equity at exit
- $146,867
- IRR
- 14.9%
- Equity multiple
- 2.20×
- Total profit
- $331,953
- Equity at exit
- $85,165
Cash invested: $275,800 (down + closing). Projections, not guarantees.
Landlord ↔ Tenant lean methodology
- Overall (STATE)
- 15 Strongly Tenant-Friendly
- State New York
- 15 Strongly Tenant-Friendly · D+10
- County
- — inherits STATE
- City
- — inherits STATE
ZIP-level market 10595
- Home prices YoY
- -17.7%
- Active inventory
- 28
- Price-to-rent
- 6.3×
Monthly cashflow live
- Estimated rent
- $12,999 medium interval (Pro) →
- Mortgage (P&I)
- −$5,165
- Tax from tax record
- −$1,276 /mo · $15,308/yr
- Insurance
- −$410
- HOA
- −$0
- Vacancy / Maint / Mgmt
- −$2,730
- Net cashflow
- $3,418
Break-even live
UW: 25.0% down · 7.5% · 30yr · 1.5% tax · 5.0% vac · 8.0% maint · 8.0% mgmt
Financing live
Cash to close
- Down payment
- $246,250
- Closing costs
- $29,550
- Reserves months
- —
- Total cash needed
- —
Loan-product check · same deal, 3 products live
Conventional
25% down · 7.5% · 30yr
- Down + closing
- —
- Monthly P&I
- —
- Monthly cashflow
- —
- DSCR
- —
- Eligible?
- —
Personal DTI + credit; lowest rate.
DSCR
20% down · 8.5% · 30yr
- Down + closing
- —
- Monthly P&I
- —
- Monthly cashflow
- —
- DSCR
- —
- Eligible?
- —
No personal income docs; deal must DSCR.
Hard money
10% down · 12.0% · 12mo
- Down + closing
- —
- Monthly P&I
- —
- Monthly cashflow
- —
- DSCR
- —
- Eligible?
- —
Short-term bridge; refi at stabilization.
Rent comps 1 comps
| Address | Beds | Baths | Sqft | Rent | $/sqft | DOM | Units | Dist |
|---|---|---|---|---|---|---|---|---|
| 10 Foxwood Ln Thornwood, NY | 4.0 | 3.5 | 2026 | $12,999 | $6.42 | 43d | 1 | 1.24mi |
Tax reassessment forecast NY · Partial reset (capped growth)
- Current annual tax
- $15,308 · $1,276/mo
- Projected year-2 tax
- $15,977 · $1,331/mo
- Expected delta
- +$669/yr (+$56/mo · 4.4%)
ⓘ Screening estimate from a state-policy table — verify with the county assessor before closing.
Climate risk First Street
- Flood 1/10 Low FEMA zone X (unshaded) · 0% chance over 30 yrs
- Wildfire 2/10 Low
- Heat 5/10 Major 7 d/yr ≥98°F today · 14 d/yr by 30 yrs out
- Wind 6/10 Major 27% chance of damaging wind over 30 yrs
- Air quality 4/10 Moderate 4 unhealthy d/yr today · 6 by 30 yrs out
Nearby sold comps map
Loading sold comps map…
Walkable amenities ~0.75 mi
Loading nearby amenities…
Taxation est. · year 1
- Rental income
- $155,988
- − Mortgage interest
- −$55,175
- − Property taxes
- −$15,308
- − Insurance
- −$4,925
- − Repairs & maintenance
- −$12,479
- − Management
- −$12,479
- − Depreciation
- −$28,655
- Taxable income
- $26,967
- Est. tax owed @ 24.0%
- −$6,472
- After-tax cash flow
- $34,540/yr
For passive investors: Depreciation is non-cash, so a rental often shows a tax loss while cash-flowing — sheltering income. Rental losses are passive: they offset passive income freely, and up to $25,000/yr can offset ordinary (W-2) income if you actively participate and your MAGI is under $100k (phasing out to $0 by $150k); unused losses carry forward. On sale, claimed depreciation is recaptured at up to 25%, and gains may owe capital-gains tax (a 1031 exchange can defer both). Figures are a year-1 estimate at your 24.0% rate — not tax advice; consult a CPA.
Schools (NCES district)
- District
- Mount Pleasant Central School District
- NCES district ID
- 3620160
- Math proficiency
- 62% ▼ -16.00%
- Reading proficiency
- 65% ▲ 3.00%
- Median HH income
- $109,054
- Composite
- 59.62/100
- National rank
- #911
- State rank
- #146 of 590 in NY
Livability — Valhalla
- Score
- 63/100
- State rank
- #795
- US rank
- #15361
Category grades
Schools grade is shown separately in the Schools card above.
Census & demographics
- City population
- 7,180
- Population (ZIP)
- 7,180
Population outlook (Westchester County) Hauer SSP2
- Today (2025)
- 1,028,035 people
- By 2030
- 1,051,636 · +2.3%
- By 2040
- 1,098,520 · +6.9%
- By 2050
- 1,136,044 · +10.5%
- By 2075
- 1,196,925 · +16.4%
- By 2100
- 1,175,147 · +14.3%
Race, ethnicity, and origin ACS 2023
- Neighborhood character
- Predominantly White (68%)
- Race & ethnicity
- White 68% Hispanic / Latino 13% Black 9% Asian 7% Two or more races 6%
- Hispanic origin (detail)
- Mexican 1% Puerto Rican 3% Dominican 2%
- Common ancestry
- Romanian 3% Italian 2% Armenian 2%
- Foreign-born
- 17% · Canada, Jamaica, China
- Languages at home
- 73% English-only · Other Indo-European 9% Spanish 8% Russian/Polish/Slavic 2%
Political lean MEDSL · Westchester
- 2024 margin
- Strong D (+26.3) · D 63.1% · R 36.9%
- 2008→2024 swing
- -1.3pp toward R · 2008: 27.6pp · 2024: 26.3pp
- All cycles
- 2024: D+26.3 2020: D+36.3 2016: D+32.8 2012: D+22.2 2008: D+27.6
Not yet ingested
- Civics
- —
Market trends
- HPI YoY
- ▼ -62.54%
- Current HPI
- 290.8983
- Rent YoY
- —
- Metro
- —
- State GDP YoY
- ▲ 2.60%
- F500 in state
- 92
Industry mix (Fortune 500 HQ in NY)
| Industry | F500 HQs | Revenue |
|---|---|---|
| Financial Services | 10 | $950B |
|
||
| Consumer Goods | 9 | $162B |
|
||
| Insurance | 4 | $225B |
|
||
| Telecommunications | 2 | $144B |
|
||
| Pharmaceuticals | 2 | $112B |
|
||
| Media / Entertainment | 2 | $69B |
|
||
Price history
+0.0% since first listed3 events — show timeline
- 2026-05-27 Pending — OneKey® MLS as Distributed by MLS Grid
- 2026-05-12 Listed $985,000 OneKey® MLS as Distributed by MLS Grid
- 2026-05-06 Coming Soon $985,000 OneKey® MLS as Distributed by MLS Grid
Property tax history
+1.9%/yrLatest (2025): $15,308 · +0.5% YoY. Source: county tax records.
Cash-flow waterfall
monthlySold comps — $/sqft
last 12 mo · ≤1 miLoading sold comps…