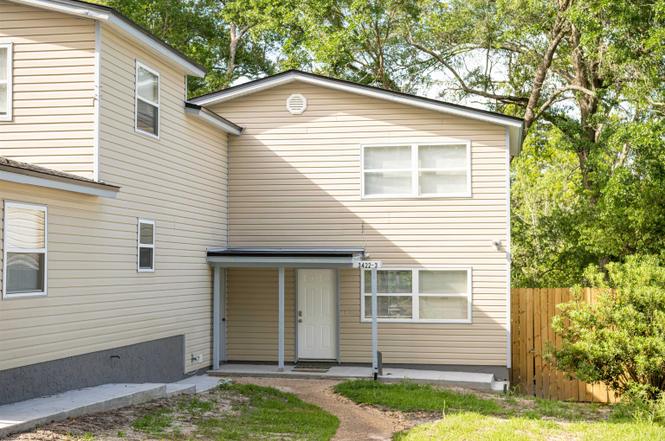
 Duplex
3422 Orlando Dr Unit 3 & 4 · Tallahassee, FL
Flood risk 1/10 · Minimal
- FEMA flood zone
- X (unshaded)
- Chance of flooding over 30 yrs
- 0.0%
- Est. flood insurance / yr
- $507 – $1,088
Fire risk 3/10 · Minor
- Est. fire insurance / yr
- $947 – $1,759
Heat risk 8/10 · Major
- Hot days now (above 108°F)
- 7 days/yr
- Hot days in 30 yrs
- 21 days/yr
Wind risk 9/10 · Severe
- Chance of severe wind over 30 yrs
- 99.0%
Air-quality risk 4/10 · Minor
- Unhealthy air days now
- 6 days/yr
- Unhealthy air days in 30 yrs
- 7 days/yr
Risk factors via First Street. Map © Google.
Why this score? — see what drove the D- grade
The composite is a weighted blend of 9 inputs, each scored 0–100. Each bar is that input's sub-score; the figure is the points it added to the 100-point composite (weight × sub-score).
- Cash flow +13.1/30.0
- Schools +4.3/10.0
- Livability +4.3/5.0
- DSCR +3.9/10.0
- Rent growth +3.9/5.0
- 1% rule +3.7/10.0
- Condition / age +2.5/5.0
- ARV discount +0.0/15.0
- Appreciation +0.0/10.0
$385,000
🖨 Deal sheet (PDF) 📄 Offer letter ✓ Due diligence
Multi-family units
County records classify this as Multi-Family (5+ Unit). Listing-text estimate: 2 units. estimate disagrees with records
5+ unit building — per-unit beds/baths from public records are typically unavailable; the breakdown below (if shown) is an estimate from the listing text.
Listing remarks
Updated, low-maintenance duplex with strong rental history. Ideal location right past Capital Circle on Apalachee Pkwy. This property is perfect for investors or owner-occupants looking to offset their mortgage with easy rental income. The right side is a 2-bed, 1-bath offering an open floor plan, spacious bedrooms with lots of closet space, a covered back porch, and a fenced backyard. The left side is a 3-bed, 2-bath home with LVP flooring in the living areas and one bedroom, updated kitchen and bathrooms, a covered porch, a fenced backyard, and an overall consistent look throughout the unit.
Key facts
- Open floor plan
- Ideal location
- Fenced backyard
Tags
Property features AI
Finance
- Financial info: For sale; Gross income reported: $35,100; Unit 3 actual rent: $1,300; Unit 4 actual rent: $1,625; Owner pays repairs; Rent includes pest control; Typical lease term: twelve months
Exterior
- Parking: Assigned parking spaces
- Utilities: Electric heating and cooling
- Home design: Multi-unit property (2 total units); Unit 3 described as a 2-bedroom, 1-bath layout; Unit 4 described as a 3/2 layout (marketed/recorded as 2 bedrooms, 2 baths)
- Construction: Frame construction with vinyl siding
- Exterior features: Deck; Fully fenced yard; Fenced
Interior
- Kitchen: Dishwasher; Refrigerator
- Bedrooms: Unit 3: 2 bedrooms; Unit 4: 2 bedrooms
- Flooring: Carpet; Clay; Ceramic tile; Vinyl
- Bathrooms: Unit 3: 1 full bathroom; Unit 4: 2 full bathrooms
- Heating & cooling: Central heating (electric); Central air; Ceiling fans
- Interior features: Primary bedroom; Utility room; Carpet, clay, ceramic tile and vinyl flooring
- Laundry & utility: Washer; Dryer
Neighborhood map
What this means for you Summary
Snapshot
- This is a 2 × 2-bed/1.5-bath units multifamily listed at $385k.
Deal economics
- At list price, monthly cash flow is $-16 ($-189/yr) — negative. Per door: $-8/mo.
- To cash-flow at today's rent, offer at most $383k (0.6% below list).
- To meet the 1% rule (rent ≥ 1% of price), the offer needs to be $335k (13.0% below list).
- Recommended offer: $335k (13.0% below list) — sets the bar for 1% rule.
- Cap rate 6.2% vs local median 4.2% in Tallahassee — top-decile yield for the area; either an underpriced asset or a hidden risk that comps aren't pricing in. Stress-test before assuming the spread holds.
Location & tenants
- Location reads 86/100 on livability (#19 in FL, #429 nationally) — a professional / high-income tenant draw. Strengths: amenities A+, commute A+, health & safety A+; Watch: employment D.
- Leon (urban): math 48% / reading 53% proficiency, ranked #33 of 73 in FL (top 45%) — acceptable for families but not a draw, mixed tenant base, ~2y average lease.
- Zoned schools: Apalachee Elementary School (math 31% / reading 36%, grade F, #1,758 of 2,144 statewide, top 83%, 544 students, 72% FRL); Fairview Middle School (math 44% / reading 46%, grade D, #310 of 571 statewide, top 56%, 747 students, 58% FRL); Lincoln High School (math 37% / reading 54%, grade D-, #223 of 667 statewide, top 34%, 1,861 students, 28% FRL).
- Market conditions: Rents rising fast (+5.5%/yr); 118 active listings in the ZIP; 2 comparable units currently listed for rent nearby; solid renter incomes; 1,765 units permitted in Leon County in 2024 (975 in 5+ unit buildings).
- At $3,348/mo this rent would consume 49% of the median local household income ($81k/yr) (locally 795% of renters already pay >50% of income on rent) — very limited rent-growth headroom before tenants either downsize or default.
Forward outlook
- Local home prices are declining (-3.0%/yr); year-one equity from $3k of loan paydown is wiped out by about $12k of value loss. Plan a longer hold.
- Leon County population projected at +23% by 2050 — long-run rental-demand tailwind backs the buy-and-hold thesis.
Negotiation context
- It's been on market 108 days — a 9% lower offer ($350k) is reasonable based on typical stale-listing flexibility.
- 4 sale attempts; this cycle's ask is 22547% above the opening price — seller raised mid-cycle; expect resistance to lowballs.
Risks & watch-outs
- Climate carrying-cost: severe wind risk, 99% chance of damaging wind over 30y; extreme-heat days projected 7→21/yr by 2055 (HVAC capex compounding) — expect insurance premiums to compound above CPI over the hold.
Questions for the listing agent
- What do current leases actually rent for vs. the listed asking? Can we see a recent rent roll and the last 12 months of T-12 income?
- It's been on market 108 days. Have you received any prior offers? Is the seller open to a 13% concession, seller financing, or rate buy-down credit?
- Can we see the unit-by-unit rent roll, current vacancy, and any below-market leases? What's the average tenancy length?
- What capital expenditures (roof, boiler, parking lot, exteriors) have been made in the last 5 years, and what's planned in the next 2?
- Why hasn't it sold? Are there any deal-killer items the seller is aware of (foundation, flood, title, zoning, code violations)?
- Is there a deadline driving the sale (1031 exchange, divorce, estate, relocation)? That informs how much negotiation room exists.
- Schools are B-rated — typically a magnet for longer-tenancy family renters. What's the average tenant stay here, and is there a school-zone premium baked into asking?
- The area grade is low — what's the realistic commute time and amenity access for the typical tenant pool here? Any planned neighborhood developments (good or bad) we should know about?
- What's the average days-on-market for RENTAL listings here right now (not sales)? A rising rental-DOM trend means longer vacancies and softer asking-rent achievability than the comps imply.
- What's the recent tenant-quality profile in this submarket — average credit score on applications, eviction rate, late-payment / NSF rate, and stable-employment percentage? A property-management company in the area should have these aggregated.
- How much new apartment / multifamily construction is in the pipeline within 1–3 miles? Heavy new supply (>2% of stock underway) typically softens rents 12–24 months out; light construction supports rent growth.
Investment metrics
- 1% rule
- 0.87% ✗
- Cap rate
- 6.24%
- Cash-on-cash
- -0.18%
- DSCR
- 0.99
- GRM
- 9.6
CMA / ARV
- ARV (on-the-fly)
- $315,900
- Comps found
- 2
Show comp detail 2 sales within ~0.75 mi
| Address | Dist | Beds/Ba | Sqft | Sold | Price | $/sf | Match |
|---|---|---|---|---|---|---|---|
| 1031 Carrin Dr Unit - | 0.23mi | 4/2.0 | 2,440 (-10%) | 19mo | $246,000 | $101 | 53 |
| 1118 Pichard Dr Unit A+B | 0.10mi | 5/3.5 (+1) | 2,352 (-13%) | 21mo | $275,000 | $117 | 50 |
Match score weights: distance 35% · size 25% · config 20% · recency 20%. Top-matched comps best support the ARV.
Projected returns pro-forma
-3.0% appreciation · 5.55% rent growth · sell at horizon
- IRR
- -13.8%
- Equity multiple
- 0.49×
- Total profit
- $-54,529
- Equity at exit
- $57,405
- IRR
- -1.3%
- Equity multiple
- 0.90×
- Total profit
- $-10,481
- Equity at exit
- $33,288
Cash invested: $107,800 (down + closing). Projections, not guarantees.
Landlord ↔ Tenant lean methodology
- Overall (STATE)
- 87 Strongly Landlord-Friendly
- State Florida
- 87 Strongly Landlord-Friendly · R+3
- County
- — inherits STATE
- City
- — inherits STATE
ZIP-level market 32311
- Home prices YoY
- -27.5%
- Rents YoY
- 5.5%
- Active inventory
- 118
- Price-to-rent
- 19.2×
Monthly cashflow live
- Estimated rent
- $3,348 high interval (Pro) →
- Mortgage (P&I)
- −$2,019
- Tax est. 1.5%
- −$481 /mo · $5,775/yr
- Insurance
- −$160
- HOA
- −$0
- Vacancy / Maint / Mgmt
- −$703
- Net cashflow
- $-16
Break-even live
Sensitivity live
| Price | -10% $250 | -5% $117 | +0% $-16 | +5% $-149 | +10% $-282 |
|---|---|---|---|---|---|
| Rent | -10% $-280 | -5% $-148 | +0% $-16 | +5% $117 | +10% $249 |
| Rate | -1.0pp $178 | -0.5pp $82 | base $-16 | +0.5pp $-115 | +1.0pp $-217 |
2-unit breakdown (identical units grouped — click to expand)
| Units | Beds | Baths | Est. rent |
|---|---|---|---|
| 2× units | 2 | 1.5 | $3,348 |
| #1 | 2 | 1.5 | $1,674 |
| #2 | 2 | 1.5 | $1,674 |
| Total (2 units) | $3,348 | ||
UW: 25.0% down · 7.5% · 30yr · 1.5% tax · 5.0% vac · 8.0% maint · 8.0% mgmt
Financing live
Cash to close
- Down payment
- $96,250
- Closing costs
- $11,550
- Reserves months
- —
- Total cash needed
- —
Loan-product check · same deal, 3 products live
Conventional
25% down · 7.5% · 30yr
- Down + closing
- —
- Monthly P&I
- —
- Monthly cashflow
- —
- DSCR
- —
- Eligible?
- —
Personal DTI + credit; lowest rate.
DSCR
20% down · 8.5% · 30yr
- Down + closing
- —
- Monthly P&I
- —
- Monthly cashflow
- —
- DSCR
- —
- Eligible?
- —
No personal income docs; deal must DSCR.
Hard money
10% down · 12.0% · 12mo
- Down + closing
- —
- Monthly P&I
- —
- Monthly cashflow
- —
- DSCR
- —
- Eligible?
- —
Short-term bridge; refi at stabilization.
Rent comps 2 comps
| Address | Beds | Baths | Sqft | Rent | $/sqft | DOM | Units | Dist |
|---|---|---|---|---|---|---|---|---|
| 3148 Dick Wilson Blvd Tallahassee, FL | 1.0–3.0 | 1.0–2.0 | 1536 | $1,940 | $1.26 | 15d | 14 | 0.42mi |
| 2250 Bluff Oak Way Tallahassee, FL | 1.0–3.0 | 1.0–2.0 | 1538 | $1,978 | $1.29 | 15d | 17 | 1.23mi |
Listing history 26 events
-
2026-06-22days on market $385,000 Active 108 DOM
-
2026-06-18days on market $385,000 Active 105 DOM
-
2026-06-17days on market $385,000 Active 104 DOM
-
2026-06-16days on market $385,000 Active 103 DOM
-
2026-06-15days on market $385,000 Active 102 DOM
-
2026-06-14days on market $385,000 Active 100 DOM
-
2026-06-10days on market $385,000 Active 97 DOM
-
2026-06-09days on market $385,000 Active 96 DOM
-
2026-06-08days on market $385,000 Active 95 DOM
-
2026-06-07days on market $385,000 Active 94 DOM
-
2026-06-05days on market $385,000 Active 91 DOM
-
2026-06-03days on market $385,000 Active 90 DOM
-
2026-06-02days on market $385,000 Active 89 DOM
-
2026-06-01days on market $385,000 Active 88 DOM
-
2026-05-31days on market $385,000 Active 87 DOM
-
2026-05-30days on market $385,000 Active 86 DOM
-
2026-05-19price $385,000
-
2026-05-02$1,700
-
2026-04-06price $415,000
-
2026-03-05$425,000 Active
-
2025-05-11historical $1,625
-
2025-04-23price $1,625
-
2025-03-25$1,675
-
2025-03-12historical $1,675
-
2025-02-26price $1,675
-
2025-02-12$1,700
ⓘ Source: listings_history table (triggers on properties + properties_extension) + one-shot
backfill from property_details.listing_events for pre-trigger history.
Climate risk First Street
- Flood 1/10 Low FEMA zone X (unshaded) · 0% chance over 30 yrs
- Wildfire 3/10 Moderate
- Heat 8/10 Severe 7 d/yr ≥108°F today · 21 d/yr by 30 yrs out
- Wind 9/10 Extreme 99% chance of damaging wind over 30 yrs
- Air quality 4/10 Moderate 6 unhealthy d/yr today · 7 by 30 yrs out
Nearby sold comps map
Loading sold comps map…
Walkable amenities ~0.75 mi
Loading nearby amenities…
Taxation est. · year 1
- Rental income
- $40,176
- − Mortgage interest
- −$21,566
- − Property taxes
- −$5,775
- − Insurance
- −$1,925
- − Repairs & maintenance
- −$3,214
- − Management
- −$3,214
- − Depreciation
- −$11,200
- Taxable loss
- −$6,718
- Est. tax savings @ 24.0%
- +$1,612
- After-tax cash flow
- $1,424/yr
For passive investors: Depreciation is non-cash, so a rental often shows a tax loss while cash-flowing — sheltering income. Rental losses are passive: they offset passive income freely, and up to $25,000/yr can offset ordinary (W-2) income if you actively participate and your MAGI is under $100k (phasing out to $0 by $150k); unused losses carry forward. On sale, claimed depreciation is recaptured at up to 25%, and gains may owe capital-gains tax (a 1031 exchange can defer both). Figures are a year-1 estimate at your 24.0% rate — not tax advice; consult a CPA.
Schools (NCES district)
- District
- Leon
- NCES district ID
- 1201110
- Math proficiency
- 48% ▼ -13.00%
- Reading proficiency
- 53% ▼ -5.00%
- Median HH income
- $46,339
- Composite
- 42.84/100
- National rank
- #3131
- State rank
- #33 of 73 in FL
Livability — Tallahassee
- Score
- 86/100
- State rank
- #19
- US rank
- #429
Category grades
Schools grade is shown separately in the Schools card above.
Census & demographics
- Census place
- Tallahassee, FL
- County
- Leon County · 294,472 people
- City population
- 294,472
- Metro
- Tallahassee, FL
- Population (ZIP)
- 21,905
- Household income
- $81,243
- Rent vs Own
- Severe rent burden
- 795.0
Population outlook (Leon County) Hauer SSP2
- Today (2025)
- 315,507 people
- By 2030
- 330,677 · +4.8%
- By 2040
- 358,465 · +13.6%
- By 2050
- 386,804 · +22.6%
- By 2075
- 465,480 · +47.5%
- By 2100
- 519,959 · +64.8%
Race, ethnicity, and origin ACS 2023
- Neighborhood character
- Diverse neighborhood (Simpson 0.64)
- Race & ethnicity
- White 52% Black 27% Two or more races 10% Hispanic / Latino 9% Asian 6%
- Hispanic origin (detail)
- Mexican 2% Puerto Rican 1% Cuban 1%
- Common ancestry
- Romanian 2% Serbian 2% Slovak 2%
- Foreign-born
- 11% · Canada, Jamaica
- Languages at home
- 86% English-only · Spanish 6% Other Indo-European 3% Other Asian/Pacific 2%
Political lean MEDSL · Leon
- 2024 margin
- Strong D (+21.8) · D 60.3% · R 38.5% · Other 1.2%
- 2008→2024 swing
- -2.5pp toward R · 2008: 24.3pp · 2024: 21.8pp
- All cycles
- 2024: D+21.8 2020: D+28.3 2016: D+25.1 2012: D+23.6 2008: D+24.3
Not yet ingested
- Civics
- —
Market trends
- HPI YoY
- ▼ -90.68%
- Current HPI
- 238.8804
- Rent YoY
- ▲ 5.55%
- Metro
- Tallahassee, FL
- State GDP YoY
- ▲ 3.28%
- F500 in state
- 36
Industry mix (Fortune 500 HQ in FL)
| Industry | F500 HQs | Revenue |
|---|---|---|
| Industrial Technology | 2 | $29B |
|
||
| Insurance | 2 | $17B |
|
||
| Retail | 1 | $60B |
|
||
| Technology Distribution | 1 | $58B |
|
||
| Homebuilding | 1 | $35B |
|
||
| Technology Manufacturing | 1 | $35B |
|
||
Price history
+22547.1% since first listed10 events — show timeline
- 2026-05-19 Price Changed $385,000 CATRS
- 2026-05-02 Listed for Rent $1,700 APPFOLIO
- 2026-04-06 Price Changed $415,000 CATRS
- 2026-03-05 Listed $425,000 CATRS
- 2025-05-11 Rental Removed $1,625 APPFOLIO
- 2025-04-23 Price Changed $1,625 APPFOLIO
- 2025-03-25 Listed for Rent $1,675 APPFOLIO
- 2025-03-12 Rental Removed $1,675 APPFOLIO
- 2025-02-26 Price Changed $1,675 APPFOLIO
- 2025-02-12 Listed for Rent $1,700 APPFOLIO
Cash-flow waterfall
monthlySold comps — $/sqft
last 12 mo · ≤1 miLoading sold comps…