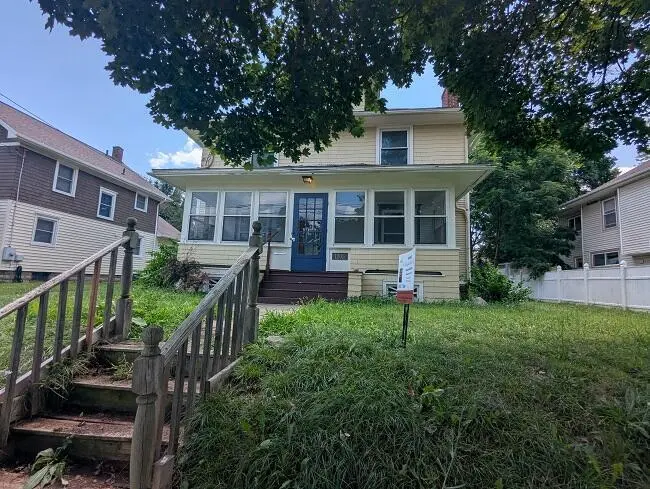
1205 E Ganson St · Jackson, MI
Flood risk 1/10 · Minimal
- FEMA flood zone
- X (unshaded)
- Chance of flooding over 30 yrs
- 0.0%
- Est. flood insurance / yr
- $473 – $860
Fire risk 1/10 · Minimal
- Est. fire insurance / yr
- $784 – $1,456
Heat risk 3/10 · Minor
- Hot days now (above 97°F)
- 7 days/yr
- Hot days in 30 yrs
- 15 days/yr
Wind risk 2/10 · Minimal
- Chance of severe wind over 30 yrs
- —
Air-quality risk 2/10 · Minimal
- Unhealthy air days now
- 1 days/yr
- Unhealthy air days in 30 yrs
- 1 days/yr
Risk factors via First Street. Map © Google.
Why this score? — see what drove the B grade
The composite is a weighted blend of 9 inputs, each scored 0–100. Each bar is that input's sub-score; the figure is the points it added to the 100-point composite (weight × sub-score).
- Cash flow +27.0/30.0
- ARV discount +15.0/15.0
- DSCR +9.3/10.0
- 1% rule +8.4/10.0
- Rent growth +5.0/5.0
- Livability +3.7/5.0
- Condition / age +2.5/5.0
- Schools +1.8/10.0
- Appreciation +0.0/10.0
$109,700
🖨 Deal sheet 📄 Offer letter ✓ Due diligence
Listing remarks MLS
Step Back in Time w/ this charming older Home. Experience the warmth & character of this beautiful older home, featuring original woodwork throughout & stunning hardwood floors with unique detailing--just waiting to be lovingly refinished. The spacious living room showcases a cozy fireplace & hardwood floors, with elegant French doors leading into a formal dining room--ideal for entertaining. The generously sized kitchen offers ample space and endless potential for your personal touch. Upstairs, you'll find three large bedrooms, all with original hardwood floors, and a full bath. The attic provides additional storage or the opportunity to create a large bonus room. A full basement also offers excellent storage space. Outside, a 2-car detached garage adds convenience. Large back deck.
Key facts
- Attic storage
- French doors
- Cozy fireplace
Tags
Neighborhood map
What this means for you Summary
Snapshot
- This is a 3-bed/1.0-bath single-family listed at $110k.
Deal economics
- At list price, monthly cash flow is $306 ($4k/yr) — positive.
- The deal already cash-flows at list — no discount required.
- Meets the 1% rule at list price ($1k rent vs $110k).
- Recommended offer: $100k (9.0% below list) — sets the bar for market timing.
- Cap rate 9.6% vs local median 5.4% in Jackson — top-decile yield for the area; either an underpriced asset or a hidden risk that comps aren't pricing in. Stress-test before assuming the spread holds.
Location & tenants
- Location reads 74/100 on livability (#197 in MI, #4,970 nationally) — a middle-class / working-renter tenant base. Strengths: cost of living A+, housing A+, health & safety A+; Watch: schools D, crime F, employment F.
- Jackson Public Schools (urban): math 15% / reading 28% proficiency, ranked #458 of 540 in MI (top 85%) — low school quality limits family demand, transient renter base, plan for 1-2y turnover; 63% free/reduced lunch — lower-income household profile, screen leases tightly.
- Market conditions: Rents rising fast (+10.3%/yr); 362 active listings in the ZIP; 317 units permitted in Jackson County in 2024 (103 in 5+ unit buildings).
Forward outlook
- Local home prices are declining (-3.0%/yr); year-one equity from $758 of loan paydown is wiped out by about $3k of value loss. Plan a longer hold.
- Jackson County population projected at -13% by 2050 — secular population decline; favor cash flow + early exit over multi-decade hold.
- At projected returns (-3.0% appreciation + 8.0% rent growth), your $31k cash investment doubles in ~7 years — after that, you're playing with house money.
Negotiation context
- It's been on market 103 days — a 9% lower offer ($100k) is reasonable based on typical stale-listing flexibility.
- 8 sale attempts since 18y ago with the ask held roughly flat each time — persistent listings suggest the price (not the market) is what's stuck; bring a comps-based counter.
- Current owner paid $90k; 22% above their basis — modest negotiation headroom, anchor on the comps not their cost.
Risks & watch-outs
- Watch-outs: property tax is 2.5% of price; built in 1912 — expect roof / HVAC / electrical / plumbing capex.
Questions for the listing agent
- It's been on market 103 days. Have you received any prior offers? Is the seller open to a 9% concession, seller financing, or rate buy-down credit?
- Built in 1912 — when were the roof, HVAC, electrical panel, plumbing, and water heater last replaced?
- Property tax is high relative to price — has the assessment been appealed recently, and will the sale trigger a re-assessment?
- Why hasn't it sold? Are there any deal-killer items the seller is aware of (foundation, flood, title, zoning, code violations)?
- Is there a deadline driving the sale (1031 exchange, divorce, estate, relocation)? That informs how much negotiation room exists.
- Schools are D-rated, which usually means shorter tenancies and higher turnover. Who's the typical renter profile here, and what's been the actual vacancy rate?
- Crime grade is F in this area — have there been break-ins, vandalism, or insurance claims at this property in the last 3 years? What carrier currently insures it and at what premium?
- What's the average days-on-market for RENTAL listings here right now (not sales)? A rising rental-DOM trend means longer vacancies and softer asking-rent achievability than the comps imply.
- What's the recent tenant-quality profile in this submarket — average credit score on applications, eviction rate, late-payment / NSF rate, and stable-employment percentage? A property-management company in the area should have these aggregated.
- How much new for-sale + rental construction is in the pipeline within 1–3 miles? Heavy new supply typically softens prices + rents 12–24 months out; constrained supply supports both.
Investment metrics
- 1% rule
- 1.34% ✓
- Cap rate
- 9.64%
- Cash-on-cash
- 11.97%
- DSCR
- 1.53
- GRM
- 6.2
CMA / ARV
- ARV (median comp)
- $140,134
- List price
- $109,700
- Delta
- -21.72%
- Verdict
- UNDERPRICED
- Comps
- 20 within 1.0 mi
Show comp detail 12 sales within ~0.75 mi
| Address | Dist | Beds/Ba | Sqft | Sold | Price | $/sf | Match |
|---|---|---|---|---|---|---|---|
| 715 Ellery Ave | 0.19mi | 3/1.0 | 1,780 (-2%) | 10mo | $135,000 | $76 | 80 |
| 1208 Burr St | 0.03mi | 3/1.5 | 1,600 (-12%) | 9mo | $149,900 | $94 | 70 |
| 305 N Elm Ave | 0.37mi | 2/1.0 (-1) | 1,756 (-3%) | 8mo | $60,000 | $34 | 67 |
| 209 N Pleasant St | 0.50mi | 4/2.0 (+1) | 1,900 (+5%) | 1mo | $149,900 | $79 | 58 |
| 730 N Waterloo St | 0.35mi | 4/2.0 (+1) | 1,660 (-8%) | 4mo | $13,500 | $8 | 58 |
| 613 Homewild Ave | 0.49mi | 3/2.0 | 1,920 (+6%) | 7mo | $169,900 | $88 | 57 |
| 1506 Pringle Ave | 0.59mi | 3/2.0 | 1,638 (-9%) | 2mo | $190,000 | $116 | 51 |
| 902 Fleming Ave | 0.58mi | 4/1.0 (+1) | 1,665 (-8%) | 5mo | $120,000 | $72 | 50 |
| 1915 E Ganson St | 0.59mi | 4/1.0 (+1) | 1,566 (-13%) | 3mo | $97,000 | $62 | 43 |
| 115 N Gorham St | 0.62mi | 3/2.0 | 1,616 (-11%) | 10mo | $165,000 | $102 | 41 |
| 315 E Trail St | 0.61mi | 2/3.0 (-1) | 1,646 (-9%) | 3mo | $185,000 | $112 | 41 |
| 2108 Tyson St | 0.73mi | 4/2.0 (+1) | 2,044 (+13%) | 10mo | $150,000 | $73 | 27 |
Match score weights: distance 35% · size 25% · config 20% · recency 20%. Top-matched comps best support the ARV.
Projected returns pro-forma
-3.0% appreciation · 8.0% rent growth · sell at horizon
- IRR
- 7.5%
- Equity multiple
- 1.31×
- Total profit
- $9,558
- Equity at exit
- $16,357
- IRR
- 21.0%
- Equity multiple
- 3.25×
- Total profit
- $69,006
- Equity at exit
- $9,485
Cash invested: $30,716 (down + closing). Projections, not guarantees.
Landlord ↔ Tenant lean methodology
- Overall (STATE)
- 62 Landlord-Friendly
- State Michigan
- 62 Landlord-Friendly · EVEN
- County
- — inherits STATE
- City
- — inherits STATE
ZIP-level market 49201
- Rents YoY
- 10.3%
- Active inventory
- 362
- Price-to-rent
- 6.2×
Monthly cashflow live
- Estimated rent
- $1,465 medium interval (Pro) →
- Mortgage (P&I)
- −$575
- Tax from tax record
- −$230 /mo · $2,760/yr
- Insurance
- −$46
- HOA
- −$0
- Vacancy / Maint / Mgmt
- −$308
- Net cashflow
- $306
Break-even live
UW: 25.0% down · 7.5% · 30yr · 1.5% tax · 5.0% vac · 8.0% maint · 8.0% mgmt
Financing live
Cash to close
- Down payment
- $27,425
- Closing costs
- $3,291
- Reserves months
- —
- Total cash needed
- —
Loan-product check · same deal, 3 products live
Conventional
25% down · 7.5% · 30yr
- Down + closing
- —
- Monthly P&I
- —
- Monthly cashflow
- —
- DSCR
- —
- Eligible?
- —
Personal DTI + credit; lowest rate.
DSCR
20% down · 8.5% · 30yr
- Down + closing
- —
- Monthly P&I
- —
- Monthly cashflow
- —
- DSCR
- —
- Eligible?
- —
No personal income docs; deal must DSCR.
Hard money
10% down · 12.0% · 12mo
- Down + closing
- —
- Monthly P&I
- —
- Monthly cashflow
- —
- DSCR
- —
- Eligible?
- —
Short-term bridge; refi at stabilization.
Listing history 21 events
-
2026-05-31days on market $109,700 Active 103 DOM
-
2026-05-30days on market $109,700 Active 102 DOM
-
2026-02-18$109,700 Active 812-char remark
Show marketing remark (812 chars)
Step Back in Time w/ this charming older Home. Experience the warmth & character of this beautiful older home, featuring original woodwork throughout & stunning hardwood floors with unique detailing--just waiting to be lovingly refinished. The spacious living room showcases a cozy fireplace & hardwood floors, with elegant French doors leading into a formal dining room--ideal for entertaining. The generously sized kitchen offers ample space and endless potential for your personal touch. Upstairs, you'll find three large bedrooms, all with original hardwood floors, and a full bath. The attic provides additional storage or the opportunity to create a large bonus room. A full basement also offers excellent storage space. Outside, a 2-car detached garage adds convenience. Large back deck.
-
2026-02-17$109,700 Active 812-char remark
Show marketing remark (812 chars)
Step Back in Time w/ this charming older Home. Experience the warmth & character of this beautiful older home, featuring original woodwork throughout & stunning hardwood floors with unique detailing--just waiting to be lovingly refinished. The spacious living room showcases a cozy fireplace & hardwood floors, with elegant French doors leading into a formal dining room--ideal for entertaining. The generously sized kitchen offers ample space and endless potential for your personal touch. Upstairs, you'll find three large bedrooms, all with original hardwood floors, and a full bath. The attic provides additional storage or the opportunity to create a large bonus room. A full basement also offers excellent storage space. Outside, a 2-car detached garage adds convenience. Large back deck.
-
2026-02-17$109,700 Active
Show marketing remark (812 chars)
Step Back in Time w/ this charming older Home. Experience the warmth & character of this beautiful older home, featuring original woodwork throughout & stunning hardwood floors with unique detailing--just waiting to be lovingly refinished. The spacious living room showcases a cozy fireplace & hardwood floors, with elegant French doors leading into a formal dining room--ideal for entertaining. The generously sized kitchen offers ample space and endless potential for your personal touch. Upstairs, you'll find three large bedrooms, all with original hardwood floors, and a full bath. The attic provides additional storage or the opportunity to create a large bonus room. A full basement also offers excellent storage space. Outside, a 2-car detached garage adds convenience. Large back deck.
-
2025-11-01historical
-
2025-10-31historical
-
2025-08-30price $125,000
-
2025-08-30price $125,000
-
2025-08-30price $125,000
-
2025-08-02$135,000 Active
-
2025-08-02$135,000 Active
-
2025-07-29historical
-
2008-10-13soldstatus $90,000
-
2008-10-03soldstatus $90,000
-
2008-10-03soldstatus $90,000
-
2008-10-03soldstatus $90,000
-
2008-09-22$89,900
-
2008-09-22$89,900
-
2008-09-22$89,900
-
2008-09-22historical
ⓘ Source: listings_history table (triggers on properties + properties_extension) + one-shot
backfill from property_details.listing_events for pre-trigger history.
Tax reassessment forecast MI · Partial reset (capped growth)
- Current annual tax
- $2,760 · $230/mo
- Projected year-2 tax
- $2,760 · $230/mo
- Expected delta
- $0/yr ($0/mo · 0.0%)
ⓘ Screening estimate from a state-policy table — verify with the county assessor before closing.
Climate risk First Street
- Flood 1/10 Low FEMA zone X (unshaded) · 0% chance over 30 yrs
- Wildfire 1/10 Low
- Heat 3/10 Moderate 7 d/yr ≥97°F today · 15 d/yr by 30 yrs out
- Wind 2/10 Low
- Air quality 2/10 Low 1 unhealthy d/yr today · 1 by 30 yrs out
Nearby sold comps map
Loading sold comps map…
Walkable amenities ~0.75 mi
Loading nearby amenities…
Taxation est. · year 1
- Rental income
- $17,579
- − Mortgage interest
- −$6,145
- − Property taxes
- −$2,760
- − Insurance
- −$548
- − Repairs & maintenance
- −$1,406
- − Management
- −$1,406
- − Depreciation
- −$3,191
- Taxable income
- $2,123
- Est. tax owed @ 24.0%
- −$509
- After-tax cash flow
- $3,167/yr
For passive investors: Depreciation is non-cash, so a rental often shows a tax loss while cash-flowing — sheltering income. Rental losses are passive: they offset passive income freely, and up to $25,000/yr can offset ordinary (W-2) income if you actively participate and your MAGI is under $100k (phasing out to $0 by $150k); unused losses carry forward. On sale, claimed depreciation is recaptured at up to 25%, and gains may owe capital-gains tax (a 1031 exchange can defer both). Figures are a year-1 estimate at your 24.0% rate — not tax advice; consult a CPA.
Schools (NCES district)
- District
- Jackson Public Schools
- NCES district ID
- 2619620
- Math proficiency
- 15% ▼ -6.00%
- Reading proficiency
- 28% ▼ -3.00%
- Median HH income
- $38,344
- Composite
- 17.99/100
- National rank
- #8986
- State rank
- #458 of 540 in MI
Livability — Jackson
- Score
- 74/100
- State rank
- #197
- US rank
- #4970
Category grades
Schools grade is shown separately in the Schools card above.
Census & demographics
- Census place
- Jackson, MI
- County
- Jackson County · 85,581 people
- City population
- 85,581
- Metro
- Jackson, MI
- Population (ZIP)
- 49,107
- Household income
- $74,484
- Rent vs Own
- Severe rent burden
- 840.0
Population outlook (Jackson County) Hauer SSP2
- Today (2025)
- 156,365 people
- By 2030
- 153,123 · -2.1%
- By 2040
- 144,981 · -7.3%
- By 2050
- 135,671 · -13.2%
- By 2075
- 113,833 · -27.2%
- By 2100
- 86,592 · -44.6%
Race, ethnicity, and origin ACS 2023
- Neighborhood character
- Predominantly White (80%)
- Race & ethnicity
- White 80% Black 9% Two or more races 6% Hispanic / Latino 5%
- Hispanic origin (detail)
- Mexican 4%
- Common ancestry
- Romanian 7% Lithuanian 3% Slovak 2%
- Foreign-born
- 3% · Canada
- Languages at home
- 96% English-only · Spanish 2% Other Indo-European 1% Russian/Polish/Slavic 1%
Political lean MEDSL · Jackson
- 2024 margin
- Strong R (+21.3) · D 38.6% · R 59.9% · Other 1.5%
- 2008→2024 swing
- -23.7pp toward R · 2008: 2.4pp · 2024: -21.3pp
- All cycles
- 2024: R+21.3 2020: R+19.0 2016: R+20.1 2012: R+5.8 2008: D+2.4
Not yet ingested
- Civics
- —
Market trends
- HPI YoY
- ▼ -198.89%
- Current HPI
- 185.3773
- Rent YoY
- ▲ 10.32%
- Metro
- Jackson, MI
- State GDP YoY
- ▲ 1.37%
- F500 in state
- 28
Industry mix (Fortune 500 HQ in MI)
| Industry | F500 HQs | Revenue |
|---|---|---|
| Automotive Parts | 3 | $48B |
|
||
| Automotive | 2 | $372B |
|
||
| Chemicals | 1 | $45B |
|
||
| Automotive Retail | 1 | $29B |
|
||
| Healthcare / Medical Devices | 1 | $23B |
|
||
| Automotive Technology | 1 | $20B |
|
||
Price history
+22.0% since first listed19 events — show timeline
- 2026-02-18 Listed $109,700 REALCOMP
- 2026-02-17 Listed $109,700 SW Michigan MLS
- 2026-02-17 Listed $109,700 MiRealSource-MiMLS
- 2025-11-01 Listing Removed — MiRealSource-MiMLS
- 2025-10-31 Listing Removed — REALCOMP
- 2025-08-30 Price Changed $125,000 MiRealSource-MiMLS
- 2025-08-30 Price Changed $125,000 REALCOMP
- 2025-08-30 Price Changed $125,000 SW Michigan MLS
- 2025-08-02 Listed $135,000 REALCOMP
- 2025-08-02 Listed $135,000 MiRealSource-MiMLS
- 2025-07-29 Coming Soon — MiRealSource-MiMLS
- 2008-10-13 Sold (Public Records) $90,000 Public Records
- 2008-10-03 Sold (MLS) $90,000 MiRealSource-MiMLS
- 2008-10-03 Sold (MLS) $90,000 REALCOMP
- 2008-10-03 Sold (MLS) $90,000 SW Michigan MLS
- 2008-09-22 Listing Removed — MiRealSource-MiMLS
- 2008-09-22 Listed $89,900 MiRealSource-MiMLS
- 2008-09-22 Listed $89,900 REALCOMP
- 2008-09-22 Listed $89,900 SW Michigan MLS
Property tax history
+6.6%/yrLatest (2025): $2,760 · -29.1% YoY. Source: county tax records.
Cash-flow waterfall
monthlySold comps — $/sqft
last 12 mo · ≤1 miLoading sold comps…