 🏗️ New Construction
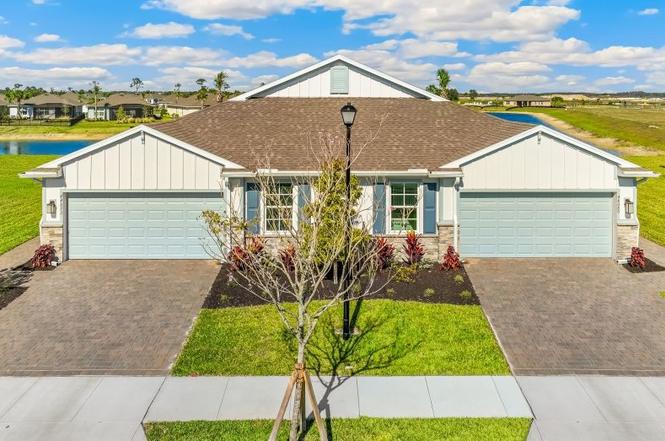
CARRINGTON Plan · North Fort Myers, FL
Flood risk No data
- FEMA flood zone
- —
- Chance of flooding over 30 yrs
- —
- Est. flood insurance / yr
- —
Fire risk No data
- Est. fire insurance / yr
- —
Heat risk No data
- Hot days now (above threshold)
- —
- Hot days in 30 yrs
- —
Wind risk No data
- Chance of severe wind over 30 yrs
- —
Air-quality risk No data
- Unhealthy air days now
- —
- Unhealthy air days in 30 yrs
- —
Risk factors via First Street. Map © Google.
Why this score? — see what drove the D+ grade
The composite is a weighted blend of 9 inputs, each scored 0–100. Each bar is that input's sub-score; the figure is the points it added to the 100-point composite (weight × sub-score).
- Cash flow +15.5/30.0
- ARV discount +7.5/15.0
- DSCR +4.8/10.0
- Schools +4.6/10.0
- 1% rule +4.3/10.0
- Livability +3.7/5.0
- Rent growth +3.5/5.0
- Condition / age +2.5/5.0
- Appreciation +2.4/10.0
$280,990
🖨 Deal sheet (PDF) 📄 Offer letter ✓ Due diligence
Listing remarks
This stylish twin villa home in Palmetto Landing at Babcock Ranch features an open-concept design that makes gathering with friends and family a breeze. The well-appointed kitchen features a quartz countertop with ample space for preparing meals and a breakfast bar for eating. The kitchen seamlessly flows to the dining and living areas. Sliding glass doors open from the living room to the covered lanai extending the living space outdoors and providing the perfect place for relaxing or dining al fresco. An expansive primary bedroom, situated at the back of the home for privacy, includes an en suite bathroom with double vanity and walk-in shower. The guest bedroom features a walk-in closet an
Key facts
- Open-concept design
- Quartz countertop
- Covered lanai
Tags
Property features AI
Finance
- Financial info: List price $280,990
Exterior
- Parking: 2 total parking spaces; 2-car garage
- Home design: New construction plan; Plan name: CARRINGTON
- Exterior features: Living area of 1,543; Located at 44696 Plumeria St, Punta Gorda, FL 33982
Interior
- Bedrooms: 3 bedrooms
- Bathrooms: 2 full bathrooms
- Interior features: Plan home (CARRINGTON)
Neighborhood map
What this means for you Summary
Snapshot
- This is a 3-bed/2.0-bath single-family listed at $281k.
Deal economics
- At list price, monthly cash flow is $124 ($1k/yr) — positive.
- The deal already cash-flows at list — no discount required.
- To meet the 1% rule (rent ≥ 1% of price), the offer needs to be $280k (0.3% below list).
- Recommended offer: $247k (12.0% below list) — sets the bar for market timing.
- Cap rate 6.8% vs local median 3.6% in North Fort Myers — top-decile yield for the area; either an underpriced asset or a hidden risk that comps aren't pricing in. Stress-test before assuming the spread holds.
Location & tenants
- Location reads 74/100 on livability (#269 in FL, #4,409 nationally) — a middle-class / working-renter tenant base. Strengths: cost of living A+, housing A+, health & safety A+; Watch: employment C-, amenities F, commute F.
- Charlotte (suburban): math 54% / reading 54% proficiency, ranked #22 of 73 in FL (top 30%) — acceptable for families but not a draw, mixed tenant base, ~2y average lease.
- Zoned schools: East Elementary School (math 67% / reading 68%, grade B+, #435 of 2,144 statewide, top 21%, 761 students, 52% FRL); Punta Gorda Middle School (math 54% / reading 52%, grade C+, #209 of 571 statewide, top 37%, 1,120 students, 41% FRL); Charlotte High School (math 44% / reading 46%, grade D-, #228 of 667 statewide, top 35%, 1,994 students, 41% FRL).
- Market conditions: Rents rising fast (+4.1%/yr); 1037 active listings in the ZIP; 9 comparable units currently listed for rent nearby; rentals at typical pace (median 23d on market — plan ~3-4 weeks tenant-placement turnaround); 4,585 units permitted in Charlotte County in 2024 (703 in 5+ unit buildings).
- At $2,802/mo this rent would consume 46% of the median local household income ($72k/yr) (locally 43% of renters already pay >50% of income on rent) — very limited rent-growth headroom before tenants either downsize or default.
Forward outlook
- Local home prices are declining (-3.0%/yr); year-one equity from $2k of loan paydown is wiped out by about $9k of value loss. Plan a longer hold.
- Charlotte County population projected at +24% by 2050 — long-run rental-demand tailwind backs the buy-and-hold thesis.
Negotiation context
- It's been on market 237 days — a 12% lower offer ($247k) is reasonable based on typical stale-listing flexibility.
Questions for the listing agent
- It's been on market 237 days. Have you received any prior offers? Is the seller open to a 12% concession, seller financing, or rate buy-down credit?
- Why hasn't it sold? Are there any deal-killer items the seller is aware of (foundation, flood, title, zoning, code violations)?
- Is there a deadline driving the sale (1031 exchange, divorce, estate, relocation)? That informs how much negotiation room exists.
- The area grade is low — what's the realistic commute time and amenity access for the typical tenant pool here? Any planned neighborhood developments (good or bad) we should know about?
- What's the average days-on-market for RENTAL listings here right now (not sales)? A rising rental-DOM trend means longer vacancies and softer asking-rent achievability than the comps imply.
- What's the recent tenant-quality profile in this submarket — average credit score on applications, eviction rate, late-payment / NSF rate, and stable-employment percentage? A property-management company in the area should have these aggregated.
- How much new for-sale + rental construction is in the pipeline within 1–3 miles? Heavy new supply typically softens prices + rents 12–24 months out; constrained supply supports both.
Investment metrics
- 1% rule
- 0.93% ✗
- Cap rate
- 6.78%
- Cash-on-cash
- 1.75%
- DSCR
- 1.08
- GRM
- 9.0
CMA / ARV
- ARV (on-the-fly)
- $302,428
- Comps found
- 12
Show comp detail 12 sales within ~0.75 mi
| Address | Dist | Beds/Ba | Sqft | Sold | Price | $/sf | Match |
|---|---|---|---|---|---|---|---|
| 17757 Oleander Ave | 0.39mi | 3/2.0 | 1,546 (+0%) | 4mo | $259,000 | $168 | 78 |
| 44568 Palm Frond Dr | 0.13mi | 2/2.0 (-1) | 1,503 (-3%) | 19mo | $355,999 | $237 | 69 |
| 17585 Wild Iris Ln | 0.39mi | 2/2.0 (-1) | 1,503 (-3%) | 7mo | $269,900 | $180 | 67 |
| 17525 Wild Iris Ave | 0.45mi | 2/2.0 (-1) | 1,503 (-3%) | 7mo | $279,999 | $186 | 64 |
| 44454 Palm Frond Dr | 0.28mi | 2/2.0 (-1) | 1,503 (-3%) | 18mo | $285,000 | $190 | 62 |
| 17537 Wild Iris Ln | 0.44mi | 2/2.0 (-1) | 1,503 (-3%) | 12mo | $295,000 | $196 | 60 |
| 44424 Palm Frond Dr | 0.32mi | 2/2.0 (-1) | 1,503 (-3%) | 20mo | $280,000 | $186 | 60 |
| 44364 Frangipani Way | 0.50mi | 2/2.0 (-1) | 1,503 (-3%) | 10mo | $289,900 | $193 | 59 |
| 17674 Oleander Ave | 0.46mi | 2/2.0 (-1) | 1,503 (-3%) | 14mo | $315,000 | $210 | 57 |
| 17650 Oleander Ave | 0.48mi | 2/2.0 (-1) | 1,503 (-3%) | 15mo | $309,900 | $206 | 56 |
| 44234 Creekside Run Ln | 0.67mi | 3/2.0 | 1,720 (+12%) | 14mo | $535,000 | $311 | 38 |
| 17086 River Otter Rd | 0.75mi | 3/2.0 | 1,720 (+12%) | 22mo | $412,000 | $240 | 27 |
Match score weights: distance 35% · size 25% · config 20% · recency 20%. Top-matched comps best support the ARV.
Projected returns pro-forma
-3.0% appreciation · 4.13% rent growth · sell at horizon
- IRR
- -12.2%
- Equity multiple
- 0.55×
- Total profit
- $-37,858
- Equity at exit
- $45,093
- IRR
- -1.5%
- Equity multiple
- 0.89×
- Total profit
- $-9,114
- Equity at exit
- $26,148
Cash invested: $84,680 (down + closing). Projections, not guarantees.
Landlord ↔ Tenant lean methodology
- Overall (STATE)
- 87 Strongly Landlord-Friendly
- State Florida
- 87 Strongly Landlord-Friendly · R+3
- County
- — inherits STATE
- City
- — inherits STATE
ZIP-level market 33982
- Home prices YoY
- -1.2%
- Rents YoY
- 4.1%
- Active inventory
- 1037
- Price-to-rent
- 8.4×
Monthly cashflow live
- Estimated rent
- $2,802 high interval (Pro) →
- Mortgage (P&I)
- −$1,586
- Tax est. 1.5%
- −$378 /mo · $4,536/yr
- Insurance
- −$126
- HOA
- −$0
- Vacancy / Maint / Mgmt
- −$588
- Net cashflow
- $124
Break-even live
Sensitivity live
| Price | -10% $333 | -5% $228 | +0% $124 | +5% $19 | +10% $-85 |
|---|---|---|---|---|---|
| Rent | -10% $-98 | -5% $13 | +0% $124 | +5% $234 | +10% $345 |
| Rate | -1.0pp $276 | -0.5pp $201 | base $124 | +0.5pp $45 | +1.0pp $-34 |
UW: 25.0% down · 7.5% · 30yr · 1.5% tax · 5.0% vac · 8.0% maint · 8.0% mgmt
Financing live
Cash to close
- Down payment
- $75,607
- Closing costs
- $9,073
- Reserves months
- —
- Total cash needed
- —
Loan-product check · same deal, 3 products live
Conventional
25% down · 7.5% · 30yr
- Down + closing
- —
- Monthly P&I
- —
- Monthly cashflow
- —
- DSCR
- —
- Eligible?
- —
Personal DTI + credit; lowest rate.
DSCR
20% down · 8.5% · 30yr
- Down + closing
- —
- Monthly P&I
- —
- Monthly cashflow
- —
- DSCR
- —
- Eligible?
- —
No personal income docs; deal must DSCR.
Hard money
10% down · 12.0% · 12mo
- Down + closing
- —
- Monthly P&I
- —
- Monthly cashflow
- —
- DSCR
- —
- Eligible?
- —
Short-term bridge; refi at stabilization.
Rent comps 9 comps
| Address | Beds | Baths | Sqft | Rent | $/sqft | DOM | Units | Dist |
|---|---|---|---|---|---|---|---|---|
| 17710 Shade Tree Loop Punta Gorda, FL | 4.0 | 2.0 | 1764 | $3,000 | $1.70 | 22d | 1 | 0.31mi |
| 17639 Wild Iris Ln Punta Gorda, FL | 2.0 | 2.0 | 1496 | $2,350 | $1.57 | 22d | 1 | 0.34mi |
| 17604 Fallen Branch Way Punta Gorda, FL | 4.0 | 3.0 | 2027 | $2,700 | $1.33 | 22d | 1 | 0.98mi |
| 16922 Sage Ter Punta Gorda, FL | 4.0 | 2.0 | 1580 | $3,500 | $2.22 | 22d | 1 | 0.99mi |
| 44458 Diamond Trl Punta Gorda, FL | 3.0 | 2.0 | 1484 | $2,500 | $1.68 | 22d | 1 | 1.02mi |
| 43693 Tree Top Trl Punta Gorda, FL | 3.0 | 3.0 | 1850 | $11,000 | $5.95 | 22d | 1 | 1.06mi |
| 44489 Panther Dr Punta Gorda, FL | 2.0 | 2.0 | 1985 | $10,000 | $5.04 | 15d | 1 | 1.35mi |
| 44229 Saddlewood Ct Punta Gorda, FL | 4.0 | 2.0 | 1675 | $2,395 | $1.43 | 22d | 1 | 1.40mi |
| 44229 Saddlewood Ct Punta Gorda, FL | 4.0 | 2.0 | 1675 | $2,350 | $1.40 | 15d | 1 | 1.40mi |
Listing history 14 events
-
2026-06-18days on market $280,990 Active 237 DOM
-
2026-06-17days on market $280,990 Active 236 DOM
-
2026-06-16days on market $280,990 Active 235 DOM
-
2026-06-15days on market $280,990 Active 234 DOM
-
2026-06-14days on market $280,990 Active 232 DOM
-
2026-06-13days on market $280,990 Active 231 DOM
-
2026-06-10days on market $280,990 Active 229 DOM
-
2026-06-09days on market $280,990 Active 228 DOM
-
2026-06-08days on market $280,990 Active 227 DOM
-
2026-06-05days on market $280,990 Active 223 DOM
-
2026-06-02days on market $280,990 Active 221 DOM
-
2026-06-01days on market $280,990 Active 220 DOM
-
2026-05-31days on market $280,990 Active 219 DOM
-
2026-05-30days on market $280,990 Active 218 DOM
ⓘ Source: listings_history table (triggers on properties + properties_extension) + one-shot
backfill from property_details.listing_events for pre-trigger history.
Nearby sold comps map
Loading sold comps map…
Walkable amenities ~0.75 mi
Loading nearby amenities…
Taxation est. · year 1
- Rental income
- $33,627
- − Mortgage interest
- −$16,941
- − Property taxes
- −$4,536
- − Insurance
- −$1,512
- − Repairs & maintenance
- −$2,690
- − Management
- −$2,690
- − Depreciation
- −$8,798
- Taxable loss
- −$3,540
- Est. tax savings @ 24.0%
- +$850
- After-tax cash flow
- $2,335/yr
For passive investors: Depreciation is non-cash, so a rental often shows a tax loss while cash-flowing — sheltering income. Rental losses are passive: they offset passive income freely, and up to $25,000/yr can offset ordinary (W-2) income if you actively participate and your MAGI is under $100k (phasing out to $0 by $150k); unused losses carry forward. On sale, claimed depreciation is recaptured at up to 25%, and gains may owe capital-gains tax (a 1031 exchange can defer both). Figures are a year-1 estimate at your 24.0% rate — not tax advice; consult a CPA.
Schools (NCES district)
- District
- Charlotte
- NCES district ID
- 1200240
- Math proficiency
- 54% ▼ -6.00%
- Reading proficiency
- 54% ▼ -1.00%
- Median HH income
- $44,864
- Composite
- 45.62/100
- National rank
- #2586
- State rank
- #22 of 73 in FL
Livability — North Fort Myers
- Score
- 74/100
- State rank
- #269
- US rank
- #4409
Category grades
Schools grade is shown separately in the Schools card above.
Census & demographics
- County
- Charlotte County · 196,994 people
- City population
- 57,035
- Metro
- Punta Gorda, FL
- Population (ZIP)
- 13,006
- Household income
- $72,443
- Rent vs Own
- Severe rent burden
- 43.0
Population outlook (Charlotte County) Hauer SSP2
- Today (2025)
- 198,646 people
- By 2030
- 210,507 · +6.0%
- By 2040
- 230,857 · +16.2%
- By 2050
- 247,148 · +24.4%
- By 2075
- 281,777 · +41.8%
- By 2100
- 293,609 · +47.8%
Race, ethnicity, and origin ACS 2023
- Neighborhood character
- Predominantly White (81%)
- Race & ethnicity
- White 81% Two or more races 8% Hispanic / Latino 7% Black 7%
- Hispanic origin (detail)
- Puerto Rican 2% Cuban 3%
- Common ancestry
- Lithuanian 3% Iranian 3% Slovak 3%
- Foreign-born
- 6% · Canada, Jamaica
- Languages at home
- 93% English-only · Spanish 5% German/W. Germanic 1% Arabic 1%
Political lean MEDSL · Charlotte
- 2024 margin
- Solid R (+34.0) · D 32.7% · R 66.7%
- 2008→2024 swing
- -26.7pp toward R · 2008: -7.2pp · 2024: -34.0pp
- All cycles
- 2024: R+34.0 2020: R+26.6 2016: R+27.8 2012: R+14.3 2008: R+7.2
Not yet ingested
- Civics
- —
Market trends
- HPI YoY
- ▼ -5.25%
- Current HPI
- 448.5895
- Rent YoY
- ▲ 4.13%
- Metro
- Punta Gorda, FL
- State GDP YoY
- ▲ 3.28%
- F500 in state
- 36
Industry mix (Fortune 500 HQ in FL)
| Industry | F500 HQs | Revenue |
|---|---|---|
| Industrial Technology | 2 | $29B |
|
||
| Insurance | 2 | $17B |
|
||
| Retail | 1 | $60B |
|
||
| Technology Distribution | 1 | $58B |
|
||
| Homebuilding | 1 | $35B |
|
||
| Technology Manufacturing | 1 | $35B |
|
||
Cash-flow waterfall
monthlySold comps — $/sqft
last 12 mo · ≤1 miLoading sold comps…