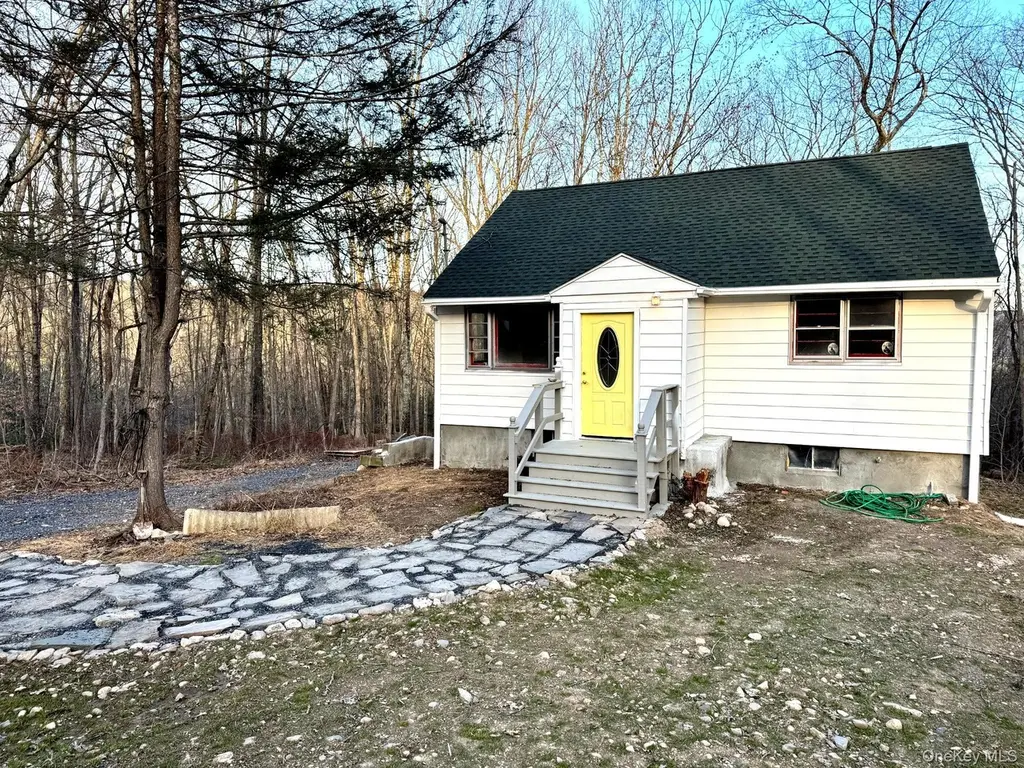
7 Fern Trl · Wurtsboro Hills, NY
Flood risk 1/10 · Minimal
- FEMA flood zone
- X (unshaded)
- Chance of flooding over 30 yrs
- 0.0%
- Est. flood insurance / yr
- $473 – $860
Fire risk 6/10 · Moderate
- Est. fire insurance / yr
- $691 – $1,283
Heat risk 3/10 · Minor
- Hot days now (above 97°F)
- 7 days/yr
- Hot days in 30 yrs
- 15 days/yr
Wind risk 3/10 · Minor
- Chance of severe wind over 30 yrs
- 7.0%
Air-quality risk 2/10 · Minimal
- Unhealthy air days now
- 1 days/yr
- Unhealthy air days in 30 yrs
- 1 days/yr
Risk factors via First Street. Map © Google.
Why this score? — see what drove the D grade
The composite is a weighted blend of 9 inputs, each scored 0–100. Each bar is that input's sub-score; the figure is the points it added to the 100-point composite (weight × sub-score).
- Appreciation +10.0/10.0
- Cash flow +9.7/30.0
- ARV discount +6.3/15.0
- 1% rule +2.8/10.0
- DSCR +2.7/10.0
- Rent growth +2.5/5.0
- Schools +2.5/10.0
- Livability +2.5/5.0
- Condition / age +2.5/5.0
$245,000
🖨 Deal sheet (PDF) 📄 Offer letter ✓ Due diligence
Listing remarks
Welcome to this 4-season, move-in ready home offering privacy, flexibility, and long-range mountain views in the heart of Wurtsboro. Tucked away in a peaceful setting, this home lives larger than expected with 2 bedrooms plus 2 finished attic bonus rooms, ideal for guest space, home offices, or creative use. The main level features a bright, open-concept living and dining area filled with natural light, seamlessly connected to a window-lined kitchen designed for everyday living and easy entertaining. Step directly onto the deck and take in the quiet surroundings, perfect for grilling, relaxing, or enjoying clear night skies. A full walk-out basement significantly expands the usable space,
Key facts
- Recent updates
- Window-lined kitchen
- Thoughtful built-ins
Tags
Property features AI
Exterior
- Parking: Driveway; No carport
- Utilities: Septic tank; Cable connected; Electricity connected; Phone connected; Sewer connected
- Home design: Single family residence; Two levels
- Construction: Frame construction; Finished attic; Full basement
- Exterior features: Frame construction; Not waterfront
Interior
- Kitchen: Range; Refrigerator
- Bedrooms: 2 levels (total 4 rooms)
- Bathrooms: 1 full bathroom
- Heating & cooling: Hot air heating; No central air
- Interior features: First-floor bedroom; First-floor full bathroom; Ceiling fans; Eat-in kitchen; Entrance foyer; Walk-through kitchen; Washer/dryer hookup
- Laundry & utility: Washer; Dryer; Washer/dryer hookup
Neighborhood map
What this means for you Summary
Snapshot
- This is a 2-bed/1.0-bath single-family listed at $245k.
Deal economics
- At list price, monthly cash flow is $-163 ($-2k/yr) — negative.
- To cash-flow at today's rent, offer at most $216k (11.8% below list).
- To meet the 1% rule (rent ≥ 1% of price), the offer needs to be $191k (22.2% below list).
- Recommended offer: $191k (22.2% below list) — sets the bar for 1% rule.
- Cap rate 5.5% vs local median 4.1% in Wurtsboro Hills — top-decile yield for the area; either an underpriced asset or a hidden risk that comps aren't pricing in. Stress-test before assuming the spread holds.
Location & tenants
- Location reads: area grade D — affects rentability + tenant quality, not the cash-flow math above.
- Monticello Central School District (town): math 29% / reading 30% proficiency, ranked #577 of 590 in NY (top 98%) — low school quality limits family demand, transient renter base, plan for 1-2y turnover.
- Zoned schools: Emma C Chase School (math 32% / reading 47%, grade F, #1,444 of 2,108 statewide, top 71%, 228 students, 57% FRL); Robert J Kaiser Middle School (math 7% / reading 35%, grade F, #661 of 729 statewide, top 91%, 595 students, 66% FRL); Monticello High School (math 82% / reading 34%, grade C, #879 of 1,100 statewide, top 80%, 844 students, 63% FRL).
- Market conditions: 109 active listings in the ZIP; 4 comparable units currently listed for rent nearby; rentals at typical pace (median 21d on market — plan ~3-4 weeks tenant-placement turnaround); 739 units permitted in Sullivan County in 2024 (5 in 5+ unit buildings).
Forward outlook
- In year one you build about $26k of equity ($2k loan paydown + $24k appreciation (10.0% local appreciation)).
- Sullivan County population projected at -24% by 2050 — secular population decline; favor cash flow + early exit over multi-decade hold.
- By year 2, paydown + projected appreciation supports a ~$42k cash-out refi (75% LTV) — recoverable capital for the next deal without selling this one.
Negotiation context
- It's been on market 30 days — a 2% lower offer ($241k) is reasonable based on typical stale-listing flexibility.
- 2 sale attempts with the ask held roughly flat each time — persistent listings suggest the price (not the market) is what's stuck; bring a comps-based counter.
- Current owner paid $45k; list at $245k implies a 444% gain — meaningful room to come down on a strong offer.
Risks & watch-outs
- Climate carrying-cost: major wildfire risk — expect insurance premiums to compound above CPI over the hold.
Questions for the listing agent
- What do current leases actually rent for vs. the listed asking? Can we see a recent rent roll and the last 12 months of T-12 income?
- Built in 1961 — when were the roof, HVAC, electrical panel, plumbing, and water heater last replaced?
- Is there a deadline driving the sale (1031 exchange, divorce, estate, relocation)? That informs how much negotiation room exists.
- The area grade is low — what's the realistic commute time and amenity access for the typical tenant pool here? Any planned neighborhood developments (good or bad) we should know about?
- What's the average days-on-market for RENTAL listings here right now (not sales)? A rising rental-DOM trend means longer vacancies and softer asking-rent achievability than the comps imply.
- What's the recent tenant-quality profile in this submarket — average credit score on applications, eviction rate, late-payment / NSF rate, and stable-employment percentage? A property-management company in the area should have these aggregated.
- How much new for-sale + rental construction is in the pipeline within 1–3 miles? Heavy new supply typically softens prices + rents 12–24 months out; constrained supply supports both.
Investment metrics
- 1% rule
- 0.78% ✗
- Cap rate
- 5.49%
- Cash-on-cash
- -2.85%
- DSCR
- 0.87
- GRM
- 10.7
CMA / ARV
- ARV (on-the-fly)
- $238,680
- Comps found
- 8
Show comp detail 8 sales within ~0.75 mi
| Address | Dist | Beds/Ba | Sqft | Sold | Price | $/sf | Match |
|---|---|---|---|---|---|---|---|
| 27 Elm Rd N | 0.35mi | 2/1.5 | 1,161 (+8%) | 3mo | $205,000 | $177 | 67 |
| 8 Locust Trl | 0.34mi | 2/2.0 | 1,139 (+6%) | 8mo | $180,000 | $158 | 64 |
| 74 Sunrise Trl | 0.26mi | 2/1.0 | 996 (-8%) | 14mo | $220,000 | $221 | 63 |
| 6 Hoeppner Dr | 0.64mi | 3/1.0 (+1) | 1,077 (-0%) | 4mo | $185,000 | $172 | 62 |
| 15 Brook W | 0.19mi | 3/1.0 (+1) | 1,152 (+7%) | 17mo | $275,000 | $239 | 60 |
| 55 Maple Trl | 0.33mi | 2/1.0 | 1,136 (+5%) | 21mo | $150,000 | $132 | 59 |
| 6 Elm Rd S | 0.44mi | 3/1.0 (+1) | 932 (-14%) | 2mo | $240,000 | $258 | 50 |
| 60 Flicker Trl | 0.73mi | 3/1.0 (+1) | 960 (-11%) | 9mo | $260,000 | $271 | 35 |
Match score weights: distance 35% · size 25% · config 20% · recency 20%. Top-matched comps best support the ARV.
Projected returns pro-forma
10.0% appreciation · 3.0% rent growth · sell at horizon
- IRR
- 22.2%
- Equity multiple
- 2.79×
- Total profit
- $123,063
- Equity at exit
- $220,715
- IRR
- 20.0%
- Equity multiple
- 6.40×
- Total profit
- $370,595
- Equity at exit
- $475,981
Cash invested: $68,600 (down + closing). Projections, not guarantees.
Landlord ↔ Tenant lean methodology
- Overall (STATE)
- 15 Strongly Tenant-Friendly
- State New York
- 15 Strongly Tenant-Friendly · D+10
- County
- — inherits STATE
- City
- — inherits STATE
ZIP-level market 12790
- Home prices YoY
- 26.8%
- Active inventory
- 109
- Price-to-rent
- 10.7×
Monthly cashflow live
- Estimated rent
- $1,906 medium interval (Pro) →
- Mortgage (P&I)
- −$1,285
- Tax from tax record
- −$282 /mo · $3,387/yr
- Insurance
- −$102
- HOA
- −$0
- Vacancy / Maint / Mgmt
- −$400
- Net cashflow
- $-163
Break-even live
Sensitivity live
| Price | -10% $-24 | -5% $-94 | +0% $-163 | +5% $-232 | +10% $-302 |
|---|---|---|---|---|---|
| Rent | -10% $-314 | -5% $-238 | +0% $-163 | +5% $-88 | +10% $-12 |
| Rate | -1.0pp $-40 | -0.5pp $-101 | base $-163 | +0.5pp $-227 | +1.0pp $-291 |
UW: 25.0% down · 7.5% · 30yr · 1.5% tax · 5.0% vac · 8.0% maint · 8.0% mgmt
Financing live
Cash to close
- Down payment
- $61,250
- Closing costs
- $7,350
- Reserves months
- —
- Total cash needed
- —
Loan-product check · same deal, 3 products live
Conventional
25% down · 7.5% · 30yr
- Down + closing
- —
- Monthly P&I
- —
- Monthly cashflow
- —
- DSCR
- —
- Eligible?
- —
Personal DTI + credit; lowest rate.
DSCR
20% down · 8.5% · 30yr
- Down + closing
- —
- Monthly P&I
- —
- Monthly cashflow
- —
- DSCR
- —
- Eligible?
- —
No personal income docs; deal must DSCR.
Hard money
10% down · 12.0% · 12mo
- Down + closing
- —
- Monthly P&I
- —
- Monthly cashflow
- —
- DSCR
- —
- Eligible?
- —
Short-term bridge; refi at stabilization.
Rent comps 4 comps
| Address | Beds | Baths | Sqft | Rent | $/sqft | DOM | Units | Dist |
|---|---|---|---|---|---|---|---|---|
| 11 Lincoln Rd Wurtsboro, NY | 1.0 | 1.0 | 800 | $1,700 | $2.12 | 20d | 1 | 1.16mi |
| 11 Lincoln Rd Wurtsboro, NY | 2.0 | 1.0 | 800 | $1,700 | $2.12 | 45d | 1 | 1.16mi |
| 127 Pine St Unit 4 Wurtsboro, NY | 2.0 | 1.5 | 1200 | $2,525 | $2.10 | 15d | 1 | 1.16mi |
| 135 Sullivan St Unit Downstairs Wurtsboro, NY | 2.0 | 1.0 | 700 | $1,500 | $2.14 | 15d | 1 | 1.22mi |
Listing history 5 events
-
2026-05-01status Pending
-
2026-03-30$245,000 Active
-
2026-01-24$255,000 Active
-
2026-01-19historical
-
2023-01-27soldstatus $45,000
ⓘ Source: listings_history table (triggers on properties + properties_extension) + one-shot
backfill from property_details.listing_events for pre-trigger history.
Tax reassessment forecast NY · Partial reset (capped growth)
- Current annual tax
- $3,387 · $282/mo
- Projected year-2 tax
- $3,764 · $314/mo
- Expected delta
- +$377/yr (+$31/mo · 11.1%)
ⓘ Screening estimate from a state-policy table — verify with the county assessor before closing.
Climate risk First Street
- Flood 1/10 Low FEMA zone X (unshaded) · 0% chance over 30 yrs
- Wildfire 6/10 Major
- Heat 3/10 Moderate 7 d/yr ≥97°F today · 15 d/yr by 30 yrs out
- Wind 3/10 Moderate 7% chance of damaging wind over 30 yrs
- Air quality 2/10 Low 1 unhealthy d/yr today · 1 by 30 yrs out
Nearby sold comps map
Loading sold comps map…
Walkable amenities ~0.75 mi
Loading nearby amenities…
Taxation est. · year 1
- Rental income
- $22,878
- − Mortgage interest
- −$13,724
- − Property taxes
- −$3,387
- − Insurance
- −$1,225
- − Repairs & maintenance
- −$1,830
- − Management
- −$1,830
- − Depreciation
- −$7,127
- Taxable loss
- −$6,246
- Est. tax savings @ 24.0%
- +$1,499
- After-tax cash flow
- $-457/yr
For passive investors: Depreciation is non-cash, so a rental often shows a tax loss while cash-flowing — sheltering income. Rental losses are passive: they offset passive income freely, and up to $25,000/yr can offset ordinary (W-2) income if you actively participate and your MAGI is under $100k (phasing out to $0 by $150k); unused losses carry forward. On sale, claimed depreciation is recaptured at up to 25%, and gains may owe capital-gains tax (a 1031 exchange can defer both). Figures are a year-1 estimate at your 24.0% rate — not tax advice; consult a CPA.
Schools (NCES district)
- District
- Monticello Central School District
- NCES district ID
- 3619740
- Math proficiency
- 29% ▼ -4.00%
- Reading proficiency
- 30% ▼ -2.00%
- Median HH income
- $44,696
- Composite
- 25.28/100
- National rank
- #7491
- State rank
- #577 of 590 in NY
Livability — Wurtsboro Hills
No livability data for this city. (Only ~50 U.S. cities are tracked.)
Census & demographics
- Census place
- Wurtsboro Hills, NY
- Population (ZIP)
- 4,341
Population outlook (Sullivan County) Hauer SSP2
- Today (2025)
- 68,974 people
- By 2030
- 65,609 · -4.9%
- By 2040
- 58,878 · -14.6%
- By 2050
- 52,500 · -23.9%
- By 2075
- 39,941 · -42.1%
- By 2100
- 28,880 · -58.1%
Race, ethnicity, and origin ACS 2023
- Neighborhood character
- Predominantly White (79%)
- Race & ethnicity
- White 79% Two or more races 9% Black 6% Hispanic / Latino 6% Asian 4%
- Hispanic origin (detail)
- Puerto Rican 3%
- Common ancestry
- Russian 7% Slovak 5% Scotch-Irish 4%
- Foreign-born
- 8% · Canada
- Languages at home
- 87% English-only · Spanish 3% Chinese 3% Russian/Polish/Slavic 3%
Political lean MEDSL · Sullivan
- 2024 margin
- R (+16.7) · D 41.6% · R 58.4%
- 2008→2024 swing
- -26.2pp toward R · 2008: 9.5pp · 2024: -16.7pp
- All cycles
- 2024: R+16.7 2020: R+9.2 2016: R+13.7 2012: D+10.4 2008: D+9.5
Not yet ingested
- Civics
- —
Market trends
- HPI YoY
- ▲ 95.79%
- Current HPI
- 452.7233
- Rent YoY
- —
- Metro
- —
- State GDP YoY
- ▲ 2.60%
- F500 in state
- 92
Industry mix (Fortune 500 HQ in NY)
| Industry | F500 HQs | Revenue |
|---|---|---|
| Financial Services | 10 | $950B |
|
||
| Consumer Goods | 9 | $162B |
|
||
| Insurance | 4 | $225B |
|
||
| Telecommunications | 2 | $144B |
|
||
| Pharmaceuticals | 2 | $112B |
|
||
| Media / Entertainment | 2 | $69B |
|
||
Price history
+444.4% since first listed5 events — show timeline
- 2026-05-01 Pending — OneKey® MLS as Distributed by MLS Grid
- 2026-03-30 Listed $245,000 OneKey® MLS as Distributed by MLS Grid
- 2026-01-24 Listed $255,000 OneKey® MLS as Distributed by MLS Grid
- 2026-01-19 Coming Soon — OneKey® MLS as Distributed by MLS Grid
- 2023-01-27 Sold (Public Records) $45,000 Public Records
Property tax history
+2.5%/yrLatest (2025): $3,387 · +0.8% YoY. Source: county tax records.
Cash-flow waterfall
monthlySold comps — $/sqft
last 12 mo · ≤1 miLoading sold comps…