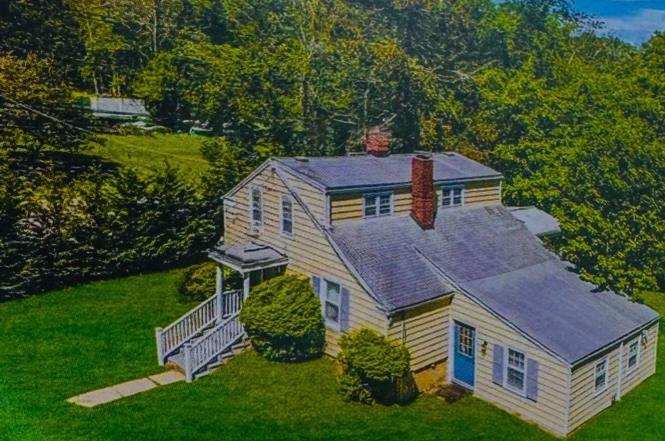
1680 N Sea Rd · North Sea, NY
Flood risk 6/10 · Moderate
- FEMA flood zone
- X (shaded)
- Chance of flooding over 30 yrs
- 0.77%
- Est. flood insurance / yr
- $507 – $1,088
Fire risk 1/10 · Minimal
- Est. fire insurance / yr
- $691 – $1,283
Heat risk 4/10 · Minor
- Hot days now (above 90°F)
- 7 days/yr
- Hot days in 30 yrs
- 19 days/yr
Wind risk 8/10 · Major
- Chance of severe wind over 30 yrs
- 80.0%
Air-quality risk 3/10 · Minor
- Unhealthy air days now
- 3 days/yr
- Unhealthy air days in 30 yrs
- 4 days/yr
Risk factors via First Street. Map © Google.
Why this score? — see what drove the C+ grade
The composite is a weighted blend of 9 inputs, each scored 0–100. Each bar is that input's sub-score; the figure is the points it added to the 100-point composite (weight × sub-score).
- Cash flow +27.8/30.0
- DSCR +9.8/10.0
- 1% rule +7.6/10.0
- Rent growth +5.0/5.0
- Schools +4.8/10.0
- Livability +2.9/5.0
- Condition / age +2.5/5.0
- ARV discount +1.4/15.0
- Appreciation +0.0/10.0
$1,495,000
🖨 Deal sheet 📄 Offer letter ✓ Due diligence
Listing remarks
Southampton Haven - Strong investment & endless opportunities Nestled on 2.5 private acres in Southampton, this charming 3-bedroom, 2.5-bath residence offers a rare combination of space, privacy, and investment potential. Surrounded by natural beauty, the property provides a peaceful retreat while remaining conveniently close to Southampton's renowned beaches, villages, dining, and shopping. The home features comfortable living spaces filled with natural light, generous bedrooms, and a functional layout designed for both year-round living and seasonal enjoyment. A detached three-car garage accessory structure offers additional storage, workspace, or future possibilities. With ample r
Key facts
- Private acres
- Substantial acreage
- Desirable locations
Tags
Property features AI
Exterior
- Parking: 3-car garage; Heated garage
- Utilities: Septic system; Propane
- Home design: Single-family residence
- Construction: Frame construction; Crawl space/attic access (crawl)
- Exterior features: Frame construction; Not waterfront
Interior
- Kitchen: Cooktop; Microwave; Oven; Refrigerator
- Bedrooms: Total rooms: 10 (includes living and other rooms)
- Bathrooms: 2 full bathrooms; 1 half bathroom
- Heating & cooling: Oil heating; No central air conditioning
- Interior features: First-floor bedroom; Eat-in kitchen; Formal dining room; Fireplace
Neighborhood map
What this means for you Summary
Snapshot
- This is a 3-bed/2.0-bath single-family listed at $1.50M.
Deal economics
- At list price, monthly cash flow is $5k ($55k/yr) — positive.
- The deal already cash-flows at list — no discount required.
- Meets the 1% rule at list price ($19k rent vs $1.50M).
- Cap rate 10.0% vs local median 6.5% in North Sea — top-decile yield for the area; either an underpriced asset or a hidden risk that comps aren't pricing in. Stress-test before assuming the spread holds.
Location & tenants
- Location reads 58/100 on livability (#1,063 in NY) — a working-class tenant base; expect higher turnover. Strengths: crime A+, employment A+; Watch: housing C-, amenities F, commute F.
- Southampton Union Free School District (suburban): math 53% / reading 51% proficiency, ranked #293 of 590 in NY (top 50%) — acceptable for families but not a draw, mixed tenant base, ~2y average lease.
- Zoned schools: Southampton Elementary School (math 42% / reading 57%, grade D, #1,085 of 2,108 statewide, top 56%, 376 students, 51% FRL); Southampton Intermediate School (math 30% / reading 47%, grade F, #437 of 729 statewide, top 60%, 363 students, 44% FRL); Southampton High School (math 98%, 595 students, 48% FRL) — zoned schools average 48% FRL vs 30% district-wide (17 pts higher); higher-poverty schools than district average — tighter screening recommended.
- Market conditions: Rents rising fast (+14.6%/yr); 95 active listings in the ZIP; 5 comparable units currently listed for rent nearby; rentals lingering (median 44d on market — plan ~5-8 weeks vacancy on turnover, expect pricing pressure); 60% of comp listings sitting > 30 days — soft ceiling on asking rent; high-income renter base; 1,366 units permitted in Suffolk County in 2024 (216 in 5+ unit buildings).
- At $18,873/mo this rent would consume 145% of the median local household income ($156k/yr) (locally 274% of renters already pay >50% of income on rent) — very limited rent-growth headroom before tenants either downsize or default.
Forward outlook
- Local home prices are declining (-3.0%/yr); year-one equity from $10k of loan paydown is wiped out by about $45k of value loss. Plan a longer hold.
- Suffolk County population projected to shrink 5% by 2050 — rents likely to lag national; underwrite the cash flow, not the appreciation.
- At projected returns (-3.0% appreciation + 8.0% rent growth), your $419k cash investment doubles in ~7 years — after that, you're playing with house money.
Negotiation context
- Only 3 days on market — expect competitive offers; lowballing is unlikely to land.
- 4 sale attempts since 9y ago with the ask held roughly flat each time — persistent listings suggest the price (not the market) is what's stuck; bring a comps-based counter.
- Current owner paid $410k; list at $1.50M implies a 265% gain — meaningful room to come down on a strong offer.
Risks & watch-outs
- Climate carrying-cost: major flood risk; severe wind risk, 80% chance of damaging wind over 30y — expect insurance premiums to compound above CPI over the hold.
Questions for the listing agent
- Is there a deadline driving the sale (1031 exchange, divorce, estate, relocation)? That informs how much negotiation room exists.
- Schools are D-rated, which usually means shorter tenancies and higher turnover. Who's the typical renter profile here, and what's been the actual vacancy rate?
- What's the average days-on-market for RENTAL listings here right now (not sales)? A rising rental-DOM trend means longer vacancies and softer asking-rent achievability than the comps imply.
- What's the recent tenant-quality profile in this submarket — average credit score on applications, eviction rate, late-payment / NSF rate, and stable-employment percentage? A property-management company in the area should have these aggregated.
- How much new for-sale + rental construction is in the pipeline within 1–3 miles? Heavy new supply typically softens prices + rents 12–24 months out; constrained supply supports both.
Investment metrics
- 1% rule
- 1.26% ✓
- Cap rate
- 9.97%
- Cash-on-cash
- 13.12%
- DSCR
- 1.58
- GRM
- 6.6
CMA / ARV
- ARV (on-the-fly)
- $1,317,064
- Comps found
- 1
Show comp detail 1 sale within ~0.75 mi
| Address | Dist | Beds/Ba | Sqft | Sold | Price | $/sf | Match |
|---|---|---|---|---|---|---|---|
| 48 Shore Rd | 0.22mi | 3/2.0 | 1,548 (-5%) | 22mo | $1,257,500 | $812 | 64 |
Match score weights: distance 35% · size 25% · config 20% · recency 20%. Top-matched comps best support the ARV.
Projected returns pro-forma
-3.0% appreciation · 8.0% rent growth · sell at horizon
- IRR
- 8.6%
- Equity multiple
- 1.36×
- Total profit
- $149,350
- Equity at exit
- $222,909
- IRR
- 21.7%
- Equity multiple
- 3.29×
- Total profit
- $960,619
- Equity at exit
- $129,260
Cash invested: $418,600 (down + closing). Projections, not guarantees.
Landlord ↔ Tenant lean methodology
- Overall (STATE)
- 15 Strongly Tenant-Friendly
- State New York
- 15 Strongly Tenant-Friendly · D+10
- County
- — inherits STATE
- City
- — inherits STATE
ZIP-level market 11968
- Home prices YoY
- -28.6%
- Rents YoY
- 14.6%
- Active inventory
- 95
- Price-to-rent
- 6.6×
Monthly cashflow live
- Estimated rent
- $18,873 medium interval (Pro) →
- Mortgage (P&I)
- −$7,840
- Tax est. 1.5%
- −$1,869 /mo · $22,425/yr
- Insurance
- −$623
- HOA
- −$0
- Vacancy / Maint / Mgmt
- −$3,963
- Net cashflow
- $4,578
Break-even live
UW: 25.0% down · 7.5% · 30yr · 1.5% tax · 5.0% vac · 8.0% maint · 8.0% mgmt
Financing live
Cash to close
- Down payment
- $373,750
- Closing costs
- $44,850
- Reserves months
- —
- Total cash needed
- —
Loan-product check · same deal, 3 products live
Conventional
25% down · 7.5% · 30yr
- Down + closing
- —
- Monthly P&I
- —
- Monthly cashflow
- —
- DSCR
- —
- Eligible?
- —
Personal DTI + credit; lowest rate.
DSCR
20% down · 8.5% · 30yr
- Down + closing
- —
- Monthly P&I
- —
- Monthly cashflow
- —
- DSCR
- —
- Eligible?
- —
No personal income docs; deal must DSCR.
Hard money
10% down · 12.0% · 12mo
- Down + closing
- —
- Monthly P&I
- —
- Monthly cashflow
- —
- DSCR
- —
- Eligible?
- —
Short-term bridge; refi at stabilization.
Rent comps 5 comps
| Address | Beds | Baths | Sqft | Rent | $/sqft | DOM | Units | Dist |
|---|---|---|---|---|---|---|---|---|
| 14 Millstone Dr Unit 1520127P Southampton, NY | 4.0 | 2.0 | 1722 | $18,488 | $10.74 | 22d | 1 | 0.23mi |
| 29 Missapoque Ave Southampton, NY | 4.0 | 2.0 | 1934 | $8,000 | $4.14 | 43d | 1 | 0.60mi |
| 278 Big Fresh Pond Rd Southampton, NY | 3.0 | 1.5 | 1400 | $35,000 | $25.00 | 24d | 1 | 0.80mi |
| 15 Lake View Ct Southampton, NY | 3.0 | 2.5 | 1800 | $15,000 | $8.33 | 43d | 1 | 0.86mi |
| 286 Towd Point Rd Southampton, NY | 4.0 | 3.0 | 1825 | $30,000 | $16.44 | 43d | 1 | 1.03mi |
Listing history 4 events
-
2026-06-18days on market $1,495,000 Active 3 DOM
-
2026-06-17days on market $1,495,000 Active 2 DOM
-
2026-06-15remarks 695-char remark
-
2026-06-15$1,495,000 Active 1 DOM
ⓘ Source: listings_history table (triggers on properties + properties_extension) + one-shot
backfill from property_details.listing_events for pre-trigger history.
Climate risk First Street
- Flood 6/10 Major FEMA zone X (shaded) · 77% chance over 30 yrs
- Wildfire 1/10 Low
- Heat 4/10 Moderate 7 d/yr ≥90°F today · 19 d/yr by 30 yrs out
- Wind 8/10 Severe 80% chance of damaging wind over 30 yrs
- Air quality 3/10 Moderate 3 unhealthy d/yr today · 4 by 30 yrs out
Nearby sold comps map
Loading sold comps map…
Walkable amenities ~0.75 mi
Loading nearby amenities…
Taxation est. · year 1
- Rental income
- $226,476
- − Mortgage interest
- −$83,743
- − Property taxes
- −$22,425
- − Insurance
- −$7,475
- − Repairs & maintenance
- −$18,118
- − Management
- −$18,118
- − Depreciation
- −$43,491
- Taxable income
- $33,106
- Est. tax owed @ 24.0%
- −$7,945
- After-tax cash flow
- $46,991/yr
For passive investors: Depreciation is non-cash, so a rental often shows a tax loss while cash-flowing — sheltering income. Rental losses are passive: they offset passive income freely, and up to $25,000/yr can offset ordinary (W-2) income if you actively participate and your MAGI is under $100k (phasing out to $0 by $150k); unused losses carry forward. On sale, claimed depreciation is recaptured at up to 25%, and gains may owe capital-gains tax (a 1031 exchange can defer both). Figures are a year-1 estimate at your 24.0% rate — not tax advice; consult a CPA.
Schools (NCES district)
- District
- Southampton Union Free School District
- NCES district ID
- 3627540
- Math proficiency
- 53% ▬ 0.00%
- Reading proficiency
- 51% ▲ 4.00%
- Median HH income
- $85,977
- Composite
- 47.9/100
- National rank
- #2213
- State rank
- #293 of 590 in NY
Livability — North Sea
- Score
- 58/100
- State rank
- #1063
- US rank
- #21178
Category grades
Schools grade is shown separately in the Schools card above.
Census & demographics
- Census place
- North Sea, NY
- County
- Suffolk County · 679,920 people
- Metro
- New York-Newark-Jersey City, NY-NJ-PA
- Population (ZIP)
- 15,312
- Household income
- $156,219
- Rent vs Own
- Severe rent burden
- 274.0
Population outlook (Suffolk County) Hauer SSP2
- Today (2025)
- 1,505,262 people
- By 2030
- 1,498,318 · -0.5%
- By 2040
- 1,471,101 · -2.3%
- By 2050
- 1,424,848 · -5.3%
- By 2075
- 1,337,157 · -11.2%
- By 2100
- 1,217,720 · -19.1%
Race, ethnicity, and origin ACS 2023
- Neighborhood character
- Predominantly White (71%)
- Race & ethnicity
- White 71% Hispanic / Latino 13% Two or more races 10% Black 9% Asian 3% Native American 2%
- Hispanic origin (detail)
- Mexican 3% Puerto Rican 2%
- Common ancestry
- Romanian 5% Scotch-Irish 2% Danish 2%
- Foreign-born
- 15% · Canada, Jamaica, Vietnam
- Languages at home
- 81% English-only · Spanish 11% Other Indo-European 3% German/W. Germanic 2%
Political lean MEDSL · Suffolk
- 2024 margin
- Lean R (+10.0) · D 45.0% · R 55.0%
- 2008→2024 swing
- -16.0pp toward R · 2008: 6.0pp · 2024: -10.0pp
- All cycles
- 2024: R+10.0 2020: R+0.0 2016: R+8.2 2012: D+2.9 2008: D+6.0
Not yet ingested
- Civics
- —
Market trends
- HPI YoY
- ▼ -184.86%
- Current HPI
- 461.1144
- Rent YoY
- ▲ 14.62%
- Metro
- New York-Newark-Jersey City, NY-NJ-PA
- State GDP YoY
- ▲ 2.60%
- F500 in state
- 92
Industry mix (Fortune 500 HQ in NY)
| Industry | F500 HQs | Revenue |
|---|---|---|
| Financial Services | 10 | $950B |
|
||
| Consumer Goods | 9 | $162B |
|
||
| Insurance | 4 | $225B |
|
||
| Telecommunications | 2 | $144B |
|
||
| Pharmaceuticals | 2 | $112B |
|
||
| Media / Entertainment | 2 | $69B |
|
||
Price history
+967.9% since first listed11 events — show timeline
- 2026-06-15 Listed $1,495,000 OneKey® MLS as Distributed by MLS Grid
- 2026-02-18 Listing Removed — OneKey® MLS as Distributed by MLS Grid
- 2025-08-19 Listed $1,595,000 OneKey® MLS as Distributed by MLS Grid
- 2025-08-18 Listing Removed — OneKey® MLS as Distributed by MLS Grid
- 2025-07-21 Price Changed $1,595,000 OneKey® MLS as Distributed by MLS Grid
- 2025-06-01 Listed $1,695,000 OneKey® MLS as Distributed by MLS Grid
- 2025-05-18 Coming Soon — OneKey® MLS as Distributed by MLS Grid
- 2018-01-26 Listing Removed — OneKey® MLS as Distributed by MLS Grid
- 2017-10-25 Listed $699,000 OneKey® MLS as Distributed by MLS Grid
- 2013-11-21 Sold (Public Records) $410,000 Public Records
- 1993-05-06 Sold (Public Records) $140,000 Public Records
Property tax history
+3.6%/yrLatest (2022): $2,132 · +0.0% YoY. Source: county tax records.
Cash-flow waterfall
monthlySold comps — $/sqft
last 12 mo · ≤1 miLoading sold comps…