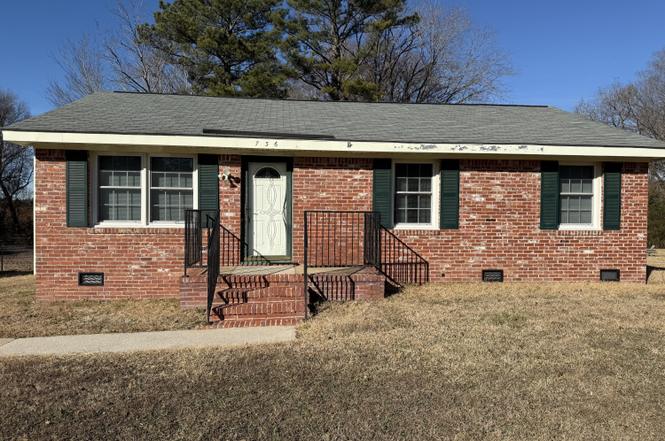
736 Lincoln Dr · Rocky Mount, NC
Flood risk 4/10 · Minor
- FEMA flood zone
- X (shaded)
- Chance of flooding over 30 yrs
- 0.2%
- Est. flood insurance / yr
- $507 – $1,088
Fire risk 3/10 · Minor
- Est. fire insurance / yr
- $906 – $1,684
Heat risk 7/10 · Major
- Hot days now (above 107°F)
- 7 days/yr
- Hot days in 30 yrs
- 16 days/yr
Wind risk 6/10 · Moderate
- Chance of severe wind over 30 yrs
- 73.0%
Air-quality risk 2/10 · Minimal
- Unhealthy air days now
- 1 days/yr
- Unhealthy air days in 30 yrs
- 2 days/yr
Risk factors via First Street. Map © Google.
Why this score? — see what drove the C+ grade
The composite is a weighted blend of 9 inputs, each scored 0–100. Each bar is that input's sub-score; the figure is the points it added to the 100-point composite (weight × sub-score).
- Cash flow +27.3/30.0
- DSCR +9.5/10.0
- ARV discount +7.5/15.0
- 1% rule +6.2/10.0
- Livability +3.5/5.0
- Rent growth +2.5/5.0
- Condition / age +2.5/5.0
- Schools +2.0/10.0
- Appreciation +0.0/10.0
$125,000
🖨 Deal sheet 📄 Offer letter ✓ Due diligence
Listing remarks
Great Investment Opportunity or Starter Home! This charming three bedrooms, one and a half bath home features, Hardwood floors throughout. Vinyl Windows, HVAC and Hot Water Heater installed in 2024. The Roof is approximately 12 years old. Outside you will find an open covered patio, great for grilling or entertaining. With some TLC you could make this home yours Today! Home is being sold AS IS.
Key facts
- Vinyl windows
- Hvac
- Open covered patio
Tags
Property features AI
Finance
- HOA & community: No association amenities
Exterior
- Parking: On-site paved parking
- Security: Security system; Has a view
- Utilities: Public water; Public sewer; Natural gas connected; Water connected
- Home design: Single-family residence; One story
- Construction: Brick veneer and vinyl siding; Shingle roof; Built on crawl space
- Exterior features: Chain link fencing in back yard (partial); Open lot; No listed patio or porch features; No pool
Interior
- Kitchen: Pantry
- Bedrooms: Total rooms: 5
- Flooring: Tile; Vinyl; Wood
- Bathrooms: 1 full bathroom; 1 half bathroom
- Heating & cooling: Central air conditioning; Electric forced-air heating
- Interior features: Ceiling fans; Pantry; Window coverings; Unfurnished; Electric water heater; Crawl space basement (no finished basement)
- Laundry & utility: Washer hookup
Neighborhood map
What this means for you Summary
Snapshot
- This is a 3-bed/1.5-bath single-family listed at $125k.
Deal economics
- At list price, monthly cash flow is $361 ($4k/yr) — positive.
- The deal already cash-flows at list — no discount required.
- Meets the 1% rule at list price ($1k rent vs $125k).
- Recommended offer: $110k (12.0% below list) — sets the bar for market timing.
- Cap rate 9.8% vs local median 4.5% in Rocky Mount — top-decile yield for the area; either an underpriced asset or a hidden risk that comps aren't pricing in. Stress-test before assuming the spread holds.
Location & tenants
- Location reads 70/100 on livability (#134 in NC) — a middle-class / working-renter tenant base. Strengths: cost of living A+, housing A+, health & safety A+; Watch: crime F, amenities F, employment F.
- Edgecombe County Public Schools (rural): math 21% / reading 27% proficiency, ranked #163 of 178 in NC (top 92%) — low school quality limits family demand, transient renter base, plan for 1-2y turnover; 74% free/reduced lunch — lower-income household profile, screen leases tightly.
- Zoned schools: G W Bulluck Elementary (math 19% / reading 27%, grade F, #1,168 of 1,410 statewide, top 83%, 609 students, 100% FRL); West Edgecombe Middle (math 22% / reading 30%, grade F, #385 of 475 statewide, top 81%, 314 students, 99% FRL); Southwest Edgecombe High (math 42% / reading 37%, grade F, #393 of 535 statewide, top 75%, 802 students, 100% FRL) — zoned schools average 99% FRL vs 74% district-wide (26 pts higher); higher-poverty schools than district average — tighter screening recommended.
- Market conditions: 133 active listings in the ZIP; lower-income renter base — watch delinquency; 50 units permitted in Edgecombe County in 2024 (5 in 5+ unit buildings).
- This rent runs 38% of the median local income ($45k/yr) — at the standard rent-burdened threshold; future hikes will face affordability resistance.
Forward outlook
- Local home prices are declining (-3.0%/yr); year-one equity from $864 of loan paydown is wiped out by about $4k of value loss. Plan a longer hold.
- Edgecombe County population projected at -34% by 2050 — secular population decline; favor cash flow + early exit over multi-decade hold.
- At projected returns (-3.0% appreciation + 3.0% rent growth), your $35k cash investment doubles in ~10 years — after that, you're playing with house money.
Negotiation context
- It's been on market 163 days — a 12% lower offer ($110k) is reasonable based on typical stale-listing flexibility.
Risks & watch-outs
- Climate carrying-cost: major wind risk, 73% chance of damaging wind over 30y; extreme-heat days projected 7→16/yr by 2055 (HVAC capex compounding) — expect insurance premiums to compound above CPI over the hold.
Questions for the listing agent
- It's been on market 163 days. Have you received any prior offers? Is the seller open to a 12% concession, seller financing, or rate buy-down credit?
- Built in 1972 — when were the roof, HVAC, electrical panel, plumbing, and water heater last replaced?
- Why hasn't it sold? Are there any deal-killer items the seller is aware of (foundation, flood, title, zoning, code violations)?
- Is there a deadline driving the sale (1031 exchange, divorce, estate, relocation)? That informs how much negotiation room exists.
- Schools are F-rated, which usually means shorter tenancies and higher turnover. Who's the typical renter profile here, and what's been the actual vacancy rate?
- Crime grade is F in this area — have there been break-ins, vandalism, or insurance claims at this property in the last 3 years? What carrier currently insures it and at what premium?
- What's the average days-on-market for RENTAL listings here right now (not sales)? A rising rental-DOM trend means longer vacancies and softer asking-rent achievability than the comps imply.
- What's the recent tenant-quality profile in this submarket — average credit score on applications, eviction rate, late-payment / NSF rate, and stable-employment percentage? A property-management company in the area should have these aggregated.
- How much new for-sale + rental construction is in the pipeline within 1–3 miles? Heavy new supply typically softens prices + rents 12–24 months out; constrained supply supports both.
Investment metrics
- 1% rule
- 1.12% ✓
- Cap rate
- 9.76%
- Cash-on-cash
- 12.38%
- DSCR
- 1.55
- GRM
- 7.4
CMA / ARV
- ARV (on-the-fly)
- $61,360
- Comps found
- 12
Show comp detail 12 sales within ~0.75 mi
| Address | Dist | Beds/Ba | Sqft | Sold | Price | $/sf | Match |
|---|---|---|---|---|---|---|---|
| 540 Lincoln Dr | 0.15mi | 3/2.0 | 1,067 (+3%) | 9mo | $128,000 | $120 | 79 |
| 517 Lincoln Dr | 0.20mi | 3/1.5 | 1,008 (-3%) | 16mo | $112,000 | $111 | 73 |
| 1525 Hargrove St | 0.34mi | 3/1.0 | 1,020 (-2%) | 11mo | $100,000 | $98 | 69 |
| 1214 Cypress St | 0.57mi | 3/1.5 | 1,064 (+2%) | 13mo | $133,000 | $125 | 58 |
| 1104 Johnson St | 0.55mi | 4/1.5 (+1) | 1,076 (+4%) | 9mo | $60,000 | $56 | 56 |
| 1410 Branch St | 0.39mi | 2/1.0 (-1) | 990 (-5%) | 13mo | $28,000 | $28 | 56 |
| 812 Lincoln Dr | 0.06mi | 3/1.5 | 1,186 (+14%) | 22mo | $70,000 | $59 | 56 |
| 1820 Blandwood Ave | 0.50mi | 3/1.0 | 1,073 (+3%) | 17mo | $36,000 | $34 | 55 |
| 805 Tyan St | 0.28mi | 3/1.0 | 1,163 (+12%) | 13mo | $65,000 | $56 | 54 |
| 929 Tyan St | 0.38mi | 3/2.0 | 1,187 (+14%) | 10mo | $90,000 | $76 | 48 |
| 905 Tyan St | 0.32mi | 2/1.0 (-1) | 953 (-8%) | 23mo | $20,000 | $21 | 45 |
| 223 Renfrow St | 0.71mi | 3/1.0 | 1,176 (+13%) | 10mo | $37,000 | $31 | 35 |
Match score weights: distance 35% · size 25% · config 20% · recency 20%. Top-matched comps best support the ARV.
Projected returns pro-forma
-3.0% appreciation · 3.0% rent growth · sell at horizon
- IRR
- 2.0%
- Equity multiple
- 1.08×
- Total profit
- $2,685
- Equity at exit
- $18,638
- IRR
- 11.6%
- Equity multiple
- 1.91×
- Total profit
- $31,741
- Equity at exit
- $10,808
Cash invested: $35,000 (down + closing). Projections, not guarantees.
Landlord ↔ Tenant lean methodology
- Overall (STATE)
- 85 Strongly Landlord-Friendly
- State North Carolina
- 85 Strongly Landlord-Friendly · R+3
- County
- — inherits STATE
- City
- — inherits STATE
ZIP-level market 27801
- Home prices YoY
- -5.6%
- Active inventory
- 133
- Price-to-rent
- 7.4×
Monthly cashflow live
- Estimated rent
- $1,406 medium interval (Pro) →
- Mortgage (P&I)
- −$656
- Tax from tax record
- −$42 /mo · $508/yr
- Insurance
- −$52
- HOA
- −$0
- Vacancy / Maint / Mgmt
- −$295
- Net cashflow
- $361
Break-even live
UW: 25.0% down · 7.5% · 30yr · 1.5% tax · 5.0% vac · 8.0% maint · 8.0% mgmt
Financing live
Cash to close
- Down payment
- $31,250
- Closing costs
- $3,750
- Reserves months
- —
- Total cash needed
- —
Loan-product check · same deal, 3 products live
Conventional
25% down · 7.5% · 30yr
- Down + closing
- —
- Monthly P&I
- —
- Monthly cashflow
- —
- DSCR
- —
- Eligible?
- —
Personal DTI + credit; lowest rate.
DSCR
20% down · 8.5% · 30yr
- Down + closing
- —
- Monthly P&I
- —
- Monthly cashflow
- —
- DSCR
- —
- Eligible?
- —
No personal income docs; deal must DSCR.
Hard money
10% down · 12.0% · 12mo
- Down + closing
- —
- Monthly P&I
- —
- Monthly cashflow
- —
- DSCR
- —
- Eligible?
- —
Short-term bridge; refi at stabilization.
Listing history 19 events
-
2026-06-19days on market $125,000 Active 163 DOM
-
2026-06-18days on market $125,000 Active 162 DOM
-
2026-06-17days on market $125,000 Active 161 DOM
-
2026-06-16days on market $125,000 Active 160 DOM
-
2026-06-15days on market $125,000 Active 159 DOM
-
2026-06-14days on market $125,000 Active 157 DOM
-
2026-06-13days on market $125,000 Active 156 DOM
-
2026-06-10days on market $125,000 Active 154 DOM
-
2026-06-09days on market $125,000 Active 153 DOM
-
2026-06-08days on market $125,000 Active 152 DOM
-
2026-06-07days on market $125,000 Active 151 DOM
-
2026-06-05days on market $125,000 Active 148 DOM
-
2026-06-02days on market $125,000 Active 146 DOM
-
2026-06-01days on market $125,000 Active 145 DOM
-
2026-05-31days on market $125,000 Active 144 DOM
-
2026-05-30days on market $125,000 Active 143 DOM
-
2026-03-12price $125,000
-
2026-02-19price $132,000
-
2026-01-07$135,000 Active
ⓘ Source: listings_history table (triggers on properties + properties_extension) + one-shot
backfill from property_details.listing_events for pre-trigger history.
Tax reassessment forecast NC · Resets to sale price
- Current annual tax
- $508 · $42/mo
- Projected year-2 tax
- $1,025 · $85/mo
- Expected delta
- +$517/yr (+$43/mo · 101.9%)
ⓘ Screening estimate from a state-policy table — verify with the county assessor before closing.
Climate risk First Street
- Flood 4/10 Moderate FEMA zone X (shaded) · 20% chance over 30 yrs
- Wildfire 3/10 Moderate
- Heat 7/10 Severe 7 d/yr ≥107°F today · 16 d/yr by 30 yrs out
- Wind 6/10 Major 73% chance of damaging wind over 30 yrs
- Air quality 2/10 Low 1 unhealthy d/yr today · 2 by 30 yrs out
Nearby sold comps map
Loading sold comps map…
Walkable amenities ~0.75 mi
Loading nearby amenities…
Taxation est. · year 1
- Rental income
- $16,874
- − Mortgage interest
- −$7,002
- − Property taxes
- −$508
- − Insurance
- −$625
- − Repairs & maintenance
- −$1,350
- − Management
- −$1,350
- − Depreciation
- −$3,636
- Taxable income
- $2,403
- Est. tax owed @ 24.0%
- −$577
- After-tax cash flow
- $3,755/yr
For passive investors: Depreciation is non-cash, so a rental often shows a tax loss while cash-flowing — sheltering income. Rental losses are passive: they offset passive income freely, and up to $25,000/yr can offset ordinary (W-2) income if you actively participate and your MAGI is under $100k (phasing out to $0 by $150k); unused losses carry forward. On sale, claimed depreciation is recaptured at up to 25%, and gains may owe capital-gains tax (a 1031 exchange can defer both). Figures are a year-1 estimate at your 24.0% rate — not tax advice; consult a CPA.
Schools (NCES district)
- District
- Edgecombe County Public Schools
- NCES district ID
- 3701320
- Math proficiency
- 21% ▼ -2.00%
- Reading proficiency
- 27% ▲ 2.00%
- Median HH income
- $35,711
- Composite
- 19.85/100
- National rank
- #8696
- State rank
- #163 of 178 in NC
Livability — Rocky Mount
- Score
- 70/100
- State rank
- #134
- US rank
- #7692
Category grades
Schools grade is shown separately in the Schools card above.
Census & demographics
- Census place
- Rocky Mount, NC
- County
- Edgecombe County · 37,913 people
- City population
- 70,300
- Metro
- Rocky Mount, NC
- Population (ZIP)
- 19,532
- Household income
- $44,884
- Rent vs Own
- Severe rent burden
- 900.0
Population outlook (Edgecombe County) Hauer SSP2
- Today (2025)
- 47,800 people
- By 2030
- 44,396 · -7.1%
- By 2040
- 37,562 · -21.4%
- By 2050
- 31,495 · -34.1%
- By 2075
- 20,943 · -56.2%
- By 2100
- 13,674 · -71.4%
Race, ethnicity, and origin ACS 2023
- Neighborhood character
- Predominantly Black (70%)
- Race & ethnicity
- Black 70% White 24% Two or more races 3% Hispanic / Latino 1%
- Common ancestry
- Romanian 1%
- Foreign-born
- 1% · Canada
- Languages at home
- 97% English-only · Spanish 2%
Political lean MEDSL · Edgecombe
- 2024 margin
- Strong D (+22.7) · D 61.0% · R 38.3%
- 2008→2024 swing
- -11.8pp toward R · 2008: 34.5pp · 2024: 22.7pp
- All cycles
- 2024: D+22.7 2020: D+27.0 2016: D+32.2 2012: D+36.4 2008: D+34.5
Not yet ingested
- Civics
- —
Market trends
- HPI YoY
- ▼ -17.65%
- Current HPI
- 296.3428
- Rent YoY
- —
- Metro
- Rocky Mount, NC
- State GDP YoY
- ▲ 3.28%
- F500 in state
- 26
Industry mix (Fortune 500 HQ in NC)
| Industry | F500 HQs | Revenue |
|---|---|---|
| Financial Services | 2 | $213B |
|
||
| Retail | 2 | $95B |
|
||
| Industrial Conglomerate | 1 | $38B |
|
||
| Metals / Steel | 1 | $35B |
|
||
| Utilities | 1 | $30B |
|
||
| Industrial Machinery | 1 | $19B |
|
||
Price history
-7.4% since first listed3 events — show timeline
- 2026-03-12 Price Changed $125,000 Hive MLS
- 2026-02-19 Price Changed $132,000 Hive MLS
- 2026-01-07 Listed $135,000 Hive MLS
Property tax history
-0.9%/yrLatest (2025): $508 · +0.0% YoY. Source: county tax records.
Cash-flow waterfall
monthlySold comps — $/sqft
last 12 mo · ≤1 miLoading sold comps…