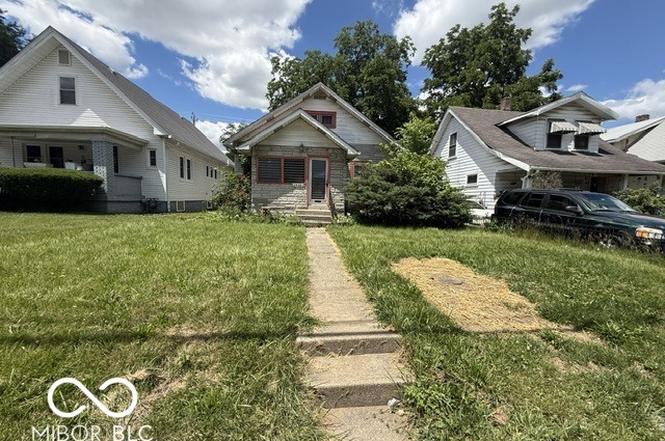
1930 N Harding St · Indianapolis city (balance), IN
Flood risk 1/10 · Minimal
- FEMA flood zone
- X (unshaded)
- Chance of flooding over 30 yrs
- 0.0%
- Est. flood insurance / yr
- $473 – $860
Fire risk 1/10 · Minimal
- Est. fire insurance / yr
- $717 – $1,331
Heat risk 4/10 · Minor
- Hot days now (above 102°F)
- 7 days/yr
- Hot days in 30 yrs
- 19 days/yr
Wind risk 2/10 · Minimal
- Chance of severe wind over 30 yrs
- 0.0%
Air-quality risk 4/10 · Minor
- Unhealthy air days now
- 5 days/yr
- Unhealthy air days in 30 yrs
- 7 days/yr
Risk factors via First Street. Map © Google.
Why this score? — see what drove the B- grade
The composite is a weighted blend of 9 inputs, each scored 0–100. Each bar is that input's sub-score; the figure is the points it added to the 100-point composite (weight × sub-score).
- Cash flow +30.0/30.0
- 1% rule +10.0/10.0
- DSCR +10.0/10.0
- ARV discount +7.5/15.0
- Livability +2.5/5.0
- Condition / age +2.5/5.0
- Rent growth +2.4/5.0
- Schools +1.4/10.0
- Appreciation +0.0/10.0
$69,999
🖨 Deal sheet 📄 Offer letter ✓ Due diligence
Listing remarks
Discover a charming single-family residence, built in 1925, offering 936 square feet of inviting living space at 1930 N Harding St. This single-story home is ready for some love to make it your own or your next investment, featuring two comfortable bedrooms alongside a well-appointed full bathroom that serves the home's needs. Thoughtfully designed for ease of living, the layout also includes a nice basement packed with potential for extra storage, a workshop, or future finishing. Situated on a nice-sized lot offering ample outdoor potential for gardening or entertaining, this delightful property invites you to immerse yourself in its possibilities
Key facts
- Nice basement
- 5,619 sq ft lot
- Built 1925
Tags
Property features AI
Exterior
- Parking: No garage (detached parking available)
- Utilities: Public water; Municipal sewer connected; City solid waste service
- Home design: Single-family residence; One level
- Construction: Concrete perimeter foundation; Other construction materials
- Exterior features: Storage shed; Lot under 1/4 acre (0.13 acres)
Interior
- Kitchen: Electric oven
- Bedrooms: Two bedrooms on the main level
- Bathrooms: One full bathroom on the main level
- Heating & cooling: No heating; No cooling
- Interior features: Attic stairway; Unfinished basement
Neighborhood map
What this means for you Summary
Snapshot
- This is a 3-bed/1.0-bath single-family listed at $70k.
Deal economics
- At list price, monthly cash flow is $476 ($6k/yr) — positive.
- The deal already cash-flows at list — no discount required.
- Meets the 1% rule at list price ($1k rent vs $70k).
- Cap rate 14.5% vs local median 4.4% in Indianapolis city (balance) — top-decile yield for the area; either an underpriced asset or a hidden risk that comps aren't pricing in. Stress-test before assuming the spread holds.
Location & tenants
- Location reads: area grade B — affects rentability + tenant quality, not the cash-flow math above.
- Indianapolis Public Schools (urban): math 14% / reading 20% proficiency, ranked #286 of 301 in IN (top 95%) — low school quality limits family demand, transient renter base, plan for 1-2y turnover; 77% free/reduced lunch — lower-income household profile, screen leases tightly.
- Market conditions: Rents soft (-0.4%/yr); 262 active listings in the ZIP; 40 comparable units currently listed for rent nearby; rentals at typical pace (median 24d on market — plan ~3-4 weeks tenant-placement turnaround); 1,906 units permitted in Marion County in 2024 (621 in 5+ unit buildings).
Forward outlook
- Local home prices are declining (-3.0%/yr); year-one equity from $484 of loan paydown is wiped out by about $2k of value loss. Plan a longer hold.
- Marion County population projected at +18% by 2050 — long-run rental-demand tailwind backs the buy-and-hold thesis.
- At projected returns (-3.0% appreciation + 0.0% rent growth), your $20k cash investment doubles in ~5 years — after that, you're playing with house money.
Negotiation context
- Only 1 days on market — expect competitive offers; lowballing is unlikely to land.
Risks & watch-outs
- Watch-outs: property tax is 3.7% of price; built in 1925 — expect roof / HVAC / electrical / plumbing capex.
Questions for the listing agent
- Built in 1925 — when were the roof, HVAC, electrical panel, plumbing, and water heater last replaced?
- Property tax is high relative to price — has the assessment been appealed recently, and will the sale trigger a re-assessment?
- Is there a deadline driving the sale (1031 exchange, divorce, estate, relocation)? That informs how much negotiation room exists.
- What's the average days-on-market for RENTAL listings here right now (not sales)? A rising rental-DOM trend means longer vacancies and softer asking-rent achievability than the comps imply.
- What's the recent tenant-quality profile in this submarket — average credit score on applications, eviction rate, late-payment / NSF rate, and stable-employment percentage? A property-management company in the area should have these aggregated.
- How much new for-sale + rental construction is in the pipeline within 1–3 miles? Heavy new supply typically softens prices + rents 12–24 months out; constrained supply supports both.
Investment metrics
- 1% rule
- 1.97% ✓
- Cap rate
- 14.46%
- Cash-on-cash
- 29.17%
- DSCR
- 2.30
- GRM
- 4.2
CMA / ARV
- ARV (on-the-fly)
- $198,432
- Comps found
- 12
Show comp detail 12 sales within ~0.75 mi
| Address | Dist | Beds/Ba | Sqft | Sold | Price | $/sf | Match |
|---|---|---|---|---|---|---|---|
| 2126 White Ave | 0.24mi | 3/1.0 | 920 (-2%) | 18mo | $133,000 | $145 | 71 |
| 1802 Sugar Grove Ave | 0.22mi | 3/1.0 | 1,008 (+8%) | 11mo | $135,000 | $134 | 68 |
| 1835 Koehne St | 0.13mi | 2/1.0 (-1) | 1,066 (+14%) | 2mo | $130,000 | $122 | 64 |
| 2041 N Dexter St | 0.13mi | 3/2.0 | 1,050 (+12%) | 10mo | $227,500 | $217 | 61 |
| 2193 N Dexter St | 0.27mi | 3/2.0 | 1,050 (+12%) | 14mo | $225,000 | $214 | 52 |
| 2023 Gent Ave | 0.27mi | 2/1.5 (-1) | 875 (-6%) | 23mo | $179,750 | $205 | 51 |
| 2171 Sugar Grove Ave | 0.26mi | 3/2.0 | 1,050 (+12%) | 16mo | $225,000 | $214 | 50 |
| 2189 N Dexter St | 0.26mi | 3/2.0 | 1,050 (+12%) | 16mo | $225,000 | $214 | 50 |
| 2142 Gent Ave | 0.31mi | 3/2.0 | 1,057 (+13%) | 15mo | $200,000 | $189 | 48 |
| 2145 Sugar Grove Ave | 0.24mi | 3/2.0 | 1,050 (+12%) | 21mo | $222,500 | $212 | 47 |
| 2131 Sugar Grove Ave | 0.22mi | 3/2.0 | 1,050 (+12%) | 24mo | $222,500 | $212 | 46 |
| 1309 W 26th St | 0.67mi | 3/2.0 | 1,050 (+12%) | 1mo | $210,000 | $200 | 44 |
Match score weights: distance 35% · size 25% · config 20% · recency 20%. Top-matched comps best support the ARV.
Projected returns pro-forma
-3.0% appreciation · 0.0% rent growth · sell at horizon
- IRR
- 19.7%
- Equity multiple
- 1.77×
- Total profit
- $15,063
- Equity at exit
- $10,437
- IRR
- 25.6%
- Equity multiple
- 2.89×
- Total profit
- $36,990
- Equity at exit
- $6,052
Cash invested: $19,600 (down + closing). Projections, not guarantees.
Landlord ↔ Tenant lean methodology
- Overall (STATE)
- 90 Strongly Landlord-Friendly
- State Indiana
- 90 Strongly Landlord-Friendly · R+11
- County
- — inherits STATE
- City
- — inherits STATE
ZIP-level market 46202
- Home prices YoY
- -26.2%
- Rents YoY
- -0.4%
- Active inventory
- 262
- Price-to-rent
- 4.2×
Monthly cashflow live
- Estimated rent
- $1,378 high interval (Pro) →
- Mortgage (P&I)
- −$367
- Tax from tax record
- −$216 /mo · $2,588/yr
- Insurance
- −$29
- HOA
- −$0
- Vacancy / Maint / Mgmt
- −$289
- Net cashflow
- $476
Break-even live
UW: 25.0% down · 7.5% · 30yr · 1.5% tax · 5.0% vac · 8.0% maint · 8.0% mgmt
Financing live
Cash to close
- Down payment
- $17,500
- Closing costs
- $2,100
- Reserves months
- —
- Total cash needed
- —
Loan-product check · same deal, 3 products live
Conventional
25% down · 7.5% · 30yr
- Down + closing
- —
- Monthly P&I
- —
- Monthly cashflow
- —
- DSCR
- —
- Eligible?
- —
Personal DTI + credit; lowest rate.
DSCR
20% down · 8.5% · 30yr
- Down + closing
- —
- Monthly P&I
- —
- Monthly cashflow
- —
- DSCR
- —
- Eligible?
- —
No personal income docs; deal must DSCR.
Hard money
10% down · 12.0% · 12mo
- Down + closing
- —
- Monthly P&I
- —
- Monthly cashflow
- —
- DSCR
- —
- Eligible?
- —
Short-term bridge; refi at stabilization.
Rent comps 40 comps
| Address | Beds | Baths | Sqft | Rent | $/sqft | DOM | Units | Dist |
|---|---|---|---|---|---|---|---|---|
| 1228 W 18th St Indianapolis, IN | 2.0 | 1.0 | 1050 | $1,200 | $1.14 | 43d | 1 | 0.27mi |
| 1415 W Pruitt St Indianapolis, IN | 3.0 | 1.0 | 1001 | $1,249 | $1.25 | 23d | 1 | 0.29mi |
| 1367 W Pruitt St Indianapolis, IN | 3.0 | 1.0 | 1088 | $1,450 | $1.33 | 43d | 1 | 0.31mi |
| 2248 N Harding St Indianapolis, IN | 2.0 | 1.0 | 1100 | $899 | $0.82 | 23d | 1 | 0.34mi |
| 1410 Breedlove Ln Indianapolis, IN | 2.0 | 1.0–2.0 | 886 | $2,557 | $2.88 | 1d | 63 | 0.55mi |
| 1244 Edgemont Ave Indianapolis, IN | 2.0 | 1.0 | 1092 | $1,275 | $1.17 | 43d | 1 | 0.58mi |
| 1201 Indiana Ave Indianapolis, IN | 1.0–3.0 | 1.0–3.5 | 967 | $2,404 | $2.49 | 1d | 36 | 0.75mi |
| 970 Edgemont Ave Indianapolis, IN | 2.0 | 1.0 | 740 | $845 | $1.14 | 4d | 1 | 0.79mi |
| 1150 N White River Pkwy West Dr Indianapolis, IN | 1.0–2.0 | 1.0 | 722 | $1,224 | $1.69 | 1d | 9 | 0.79mi |
| 1319 W 27th St Indianapolis, IN | 2.0 | 1.0 | 651 | $900 | $1.38 | 12d | 1 | 0.79mi |
| 908 Burdsal Pkwy Marion, IN | 2.0 | 1.0 | 936 | $1,300 | $1.39 | 23d | 1 | 0.81mi |
| 906 Burdsal Pkwy Indianapolis, IN | 2.0 | 1.0 | 936 | $1,295 | $1.38 | 23d | 1 | 0.81mi |
| 2106 Cold Spring Rd Indianapolis, IN | 2.0 | 1.0–1.5 | 940 | $1,189 | $1.26 | 2d | 4 | 0.85mi |
| 1519 W 28th St Indianapolis, IN | 2.0 | 1.0 | 816 | $895 | $1.10 | 43d | 1 | 0.85mi |
| 1457 W 29th St Indianapolis, IN | 2.0 | 1.0 | 686 | $995 | $1.45 | 20d | 1 | 0.96mi |
| 2701 W 17th St Indianapolis, IN | 2.0 | 1.0 | 810 | $899 | $1.11 | 7d | 1 | 1.00mi |
| 1227 W 29th St Indianapolis, IN | 3.0 | 1.5 | 1056 | $1,250 | $1.18 | 23d | 1 | 1.00mi |
| 2602 Mansion Dr Indianapolis, IN | 2.0–3.0 | 2.0 | 1850 | $1,675 | $0.91 | 7d | 6 | 1.04mi |
| 2235 Doctor Martin Luther King Junior St Indianapolis, IN | 3.0 | 1.5 | 948 | $1,700 | $1.79 | 43d | 1 | 1.06mi |
| 1441 W Lynn Dr Indianapolis, IN | 3.0 | 2.0 | 967 | $1,550 | $1.60 | 43d | 1 | 1.07mi |
| 524 W 23rd St Indianapolis, IN | 2.0 | 1.0 | 664 | $949 | $1.43 | 43d | 1 | 1.09mi |
| 930 W 10th St Indianapolis, IN | 1.0–4.0 | 1.0–4.0 | 874 | $3,144 | $3.59 | 4d | 1 | 1.10mi |
| 1409 N Warman Ave Indianapolis, IN | 2.0 | 1.0 | 816 | $1,300 | $1.59 | 20d | 1 | 1.10mi |
| 1155 N Holmes Ave Indianapolis, IN | 3.0 | 1.0 | 952 | $2,800 | $2.94 | 2d | 1 | 1.14mi |
| 735 W 11th St Indianapolis, IN | 2.0 | 1.0 | 712 | $1,398 | $1.96 | 43d | 1 | 1.18mi |
| 1401 Doctor Martin Luther King Junior St Indianapolis, IN | 1.0–2.0 | 1.0 | 982 | $1,875 | $1.91 | 13d | 1 | 1.20mi |
| 2011 N Kessler Boulevard Dr Indianapolis, IN | 3.0 | 1.0 | 888 | $1,375 | $1.55 | 23d | 1 | 1.21mi |
| 1226 Doctor Martin Luther King Junior St Indianapolis, IN | 1.0–3.0 | 1.0–3.5 | 1067 | $2,285 | $2.14 | 1d | 10 | 1.23mi |
| 1261 W 32nd St Indianapolis, IN | 2.0 | 1.0 | 832 | $975 | $1.17 | 43d | 1 | 1.31mi |
| 1470 W 32nd St Indianapolis, IN | 2.0 | 1.0 | 700 | $1,000 | $1.43 | 43d | 1 | 1.34mi |
| 516 W 28th St Indianapolis, IN | 2.0 | 1.0 | 1005 | $1,100 | $1.09 | 23d | 1 | 1.35mi |
| 460 N White River Parkway Dr W Indianapolis, IN | 2.0 | 1.0 | 681 | $1,725 | $2.53 | 2d | 14 | 1.35mi |
| 525 N Belmont Ave Indianapolis, IN | 3.0 | 1.0 | 912 | $1,225 | $1.34 | 23d | 1 | 1.36mi |
| 2365 N Goodlet Ave Indianapolis, IN | 3.0 | 1.5 | 900 | $1,099 | $1.22 | 23d | 1 | 1.38mi |
| 3014 W 10th St Indianapolis, IN | 2.0 | 1.0 | 850 | $749 | $0.88 | 43d | 1 | 1.44mi |
| 3014 W 10th St Unit 1 Indianapolis, IN | 2.0 | 1.0 | 850 | $749 | $0.88 | 23d | 1 | 1.44mi |
| 1911 Wilcox St Indianapolis, IN | 2.0 | 1.0 | 896 | $1,150 | $1.28 | 43d | 1 | 1.45mi |
| 926 W 32nd St Indianapolis, IN | 3.0 | 2.0 | 1050 | $1,295 | $1.23 | 7d | 1 | 1.47mi |
| 2418 N Centennial St Indianapolis, IN | 2.0 | 1.0 | 725 | $1,099 | $1.52 | 43d | 1 | 1.47mi |
| 771 Haugh St Indianapolis, IN | 2.0 | 1.0 | 714 | $1,250 | $1.75 | 19d | 1 | 1.49mi |
Listing history 2 events
-
2026-06-18remarks 656-char remark
-
2026-06-18$69,999 Active 1 DOM
ⓘ Source: listings_history table (triggers on properties + properties_extension) + one-shot
backfill from property_details.listing_events for pre-trigger history.
Tax reassessment forecast IN · Partial reset (capped growth)
- Current annual tax
- $2,588 · $216/mo
- Projected year-2 tax
- $2,588 · $216/mo
- Expected delta
- $0/yr ($0/mo · 0.0%)
ⓘ Screening estimate from a state-policy table — verify with the county assessor before closing.
Climate risk First Street
- Flood 1/10 Low FEMA zone X (unshaded) · 0% chance over 30 yrs
- Wildfire 1/10 Low
- Heat 4/10 Moderate 7 d/yr ≥102°F today · 19 d/yr by 30 yrs out
- Wind 2/10 Low 0% chance of damaging wind over 30 yrs
- Air quality 4/10 Moderate 5 unhealthy d/yr today · 7 by 30 yrs out
Nearby sold comps map
Loading sold comps map…
Walkable amenities ~0.75 mi
Loading nearby amenities…
Taxation est. · year 1
- Rental income
- $16,531
- − Mortgage interest
- −$3,921
- − Property taxes
- −$2,588
- − Insurance
- −$350
- − Repairs & maintenance
- −$1,323
- − Management
- −$1,323
- − Depreciation
- −$2,036
- Taxable income
- $4,991
- Est. tax owed @ 24.0%
- −$1,198
- After-tax cash flow
- $4,519/yr
For passive investors: Depreciation is non-cash, so a rental often shows a tax loss while cash-flowing — sheltering income. Rental losses are passive: they offset passive income freely, and up to $25,000/yr can offset ordinary (W-2) income if you actively participate and your MAGI is under $100k (phasing out to $0 by $150k); unused losses carry forward. On sale, claimed depreciation is recaptured at up to 25%, and gains may owe capital-gains tax (a 1031 exchange can defer both). Figures are a year-1 estimate at your 24.0% rate — not tax advice; consult a CPA.
Schools (NCES district)
- District
- Indianapolis Public Schools
- NCES district ID
- 1804770
- Math proficiency
- 14% ▼ -7.00%
- Reading proficiency
- 20% ▼ -3.00%
- Median HH income
- $32,034
- Composite
- 13.69/100
- National rank
- #9499
- State rank
- #286 of 301 in IN
Livability — Indianapolis city (balance)
No livability data for this city. (Only ~50 U.S. cities are tracked.)
Census & demographics
- Census place
- Indianapolis city (balance), IN
- County
- Marion County · 998,460 people
- City population
- 881,119
- Metro
- Indianapolis-Carmel-Anderson, IN
- Population (ZIP)
- 20,180
- Household income
- $63,506
- Rent vs Own
- Severe rent burden
- 1829.0
Population outlook (Marion County) Hauer SSP2
- Today (2025)
- 1,025,572 people
- By 2030
- 1,065,727 · +3.9%
- By 2040
- 1,141,577 · +11.3%
- By 2050
- 1,208,920 · +17.9%
- By 2075
- 1,367,288 · +33.3%
- By 2100
- 1,438,201 · +40.2%
Race, ethnicity, and origin ACS 2023
- Neighborhood character
- Diverse neighborhood (Simpson 0.57)
- Race & ethnicity
- White 62% Black 20% Hispanic / Latino 8% Asian 6% Two or more races 5%
- Hispanic origin (detail)
- Mexican 5%
- Common ancestry
- Italian 4% Romanian 3% Slovak 3%
- Foreign-born
- 11% · Canada, China
- Languages at home
- 86% English-only · Spanish 6% Other Indo-European 3% Arabic 1%
Political lean MEDSL · Marion
- 2024 margin
- Strong D (+27.7) · D 63.0% · R 35.3% · Other 1.7%
- 2008→2024 swing
- -0.7pp no change · 2008: 28.4pp · 2024: 27.7pp
- All cycles
- 2024: D+27.7 2020: D+29.1 2016: D+22.8 2012: D+22.2 2008: D+28.4
Not yet ingested
- Civics
- —
Market trends
- HPI YoY
- ▼ -136.75%
- Current HPI
- 385.5518
- Rent YoY
- ▼ -0.37%
- Metro
- Indianapolis-Carmel-Anderson, IN
- State GDP YoY
- ▲ 2.90%
- F500 in state
- 18
Industry mix (Fortune 500 HQ in IN)
| Industry | F500 HQs | Revenue |
|---|---|---|
| Industrial Machinery | 2 | $37B |
|
||
| Healthcare | 1 | $177B |
|
||
| Pharmaceuticals | 1 | $45B |
|
||
| Metals / Steel | 1 | $18B |
|
||
| Agriculture | 1 | $17B |
|
||
| Packaging | 1 | $12B |
|
||
Price history
1 event — show timeline
- 2026-06-18 Listed $69,999 MIBOR as Distributed by MLS Grid
Property tax history
+48.2%/yrLatest (2025): $2,588 · +22.8% YoY. Source: county tax records.
Cash-flow waterfall
monthlySold comps — $/sqft
last 12 mo · ≤1 miLoading sold comps…