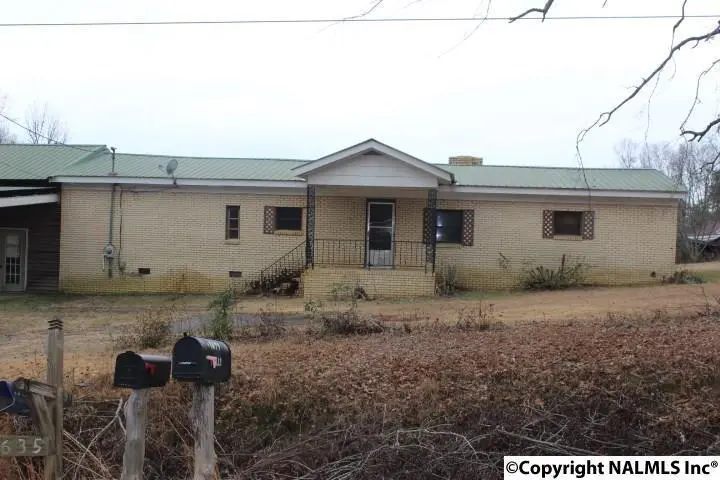
1635 County Road 7 · Leesburg, AL
Flood risk 1/10 · Minimal
- FEMA flood zone
- X (unshaded)
- Chance of flooding over 30 yrs
- 0.0%
- Est. flood insurance / yr
- $507 – $1,088
Fire risk 3/10 · Minor
- Est. fire insurance / yr
- $916 – $1,700
Heat risk 5/10 · Moderate
- Hot days now (above 107°F)
- 6 days/yr
- Hot days in 30 yrs
- 16 days/yr
Wind risk 4/10 · Minor
- Chance of severe wind over 30 yrs
- 21.0%
Air-quality risk 2/10 · Minimal
- Unhealthy air days now
- 1 days/yr
- Unhealthy air days in 30 yrs
- 2 days/yr
Risk factors via First Street. Map © Google.
Why this score? — see what drove the C+ grade
The composite is a weighted blend of 9 inputs, each scored 0–100. Each bar is that input's sub-score; the figure is the points it added to the 100-point composite (weight × sub-score).
- Cash flow +22.0/30.0
- Appreciation +9.2/10.0
- ARV discount +7.5/15.0
- DSCR +7.0/10.0
- 1% rule +5.5/10.0
- Livability +3.0/5.0
- Schools +2.7/10.0
- Rent growth +2.5/5.0
- Condition / age +2.5/5.0
$95,000
🖨 Deal sheet (PDF) 📄 Offer letter ✓ Due diligence
Listing remarks
Leesburg, 3BR2BA, sunroom, large den, large workshop, metal roof and nearly one acre. Investors welcome!
Key facts
- Metal roof
- Large den
- Sunroom
Tags
Neighborhood map
What this means for you Summary
Snapshot
- This is a 3-bed/2.0-bath single-family listed at $95k.
Deal economics
- At list price, monthly cash flow is $152 ($2k/yr) — positive.
- The deal already cash-flows at list — no discount required.
- Meets the 1% rule at list price ($995 rent vs $95k).
Location & tenants
- Location reads 60/100 on livability (#310 in AL) — a middle-class / working-renter tenant base. Strengths: cost of living A+, housing A+; Watch: schools F, amenities F, commute F.
- Cherokee County (rural): math 21% / reading 45% proficiency, ranked #58 of 129 in AL (top 45%) — families likely to look elsewhere, expect single-tenant / working-renter base with shorter leases.
- Market conditions: 55 active listings in the ZIP; 39 units permitted in Cherokee County in 2024 (0 in 5+ unit buildings).
Forward outlook
- In year one you build about $9k of equity ($657 loan paydown + $8k appreciation (8.4% local appreciation)).
- Cherokee County population projected at -17% by 2050 — secular population decline; favor cash flow + early exit over multi-decade hold.
- At projected returns (8.4% appreciation + 3.0% rent growth), your $27k cash investment doubles in ~3 years — after that, you're playing with house money.
- By year 4, paydown + projected appreciation supports a ~$30k cash-out refi (75% LTV) — recoverable capital for the next deal without selling this one.
Negotiation context
- Only 1 days on market — expect competitive offers; lowballing is unlikely to land.
- 2 sale attempts since 8y ago; this cycle's ask is 179% above the opening price — seller raised mid-cycle; expect resistance to lowballs.
- Current owner paid $18k; list at $95k implies a 443% gain — meaningful room to come down on a strong offer.
Risks & watch-outs
- Climate carrying-cost: extreme-heat days projected 6→16/yr by 2055 (HVAC capex compounding) — expect insurance premiums to compound above CPI over the hold.
Questions for the listing agent
- Built in 1974 — when were the roof, HVAC, electrical panel, plumbing, and water heater last replaced?
- Is there a deadline driving the sale (1031 exchange, divorce, estate, relocation)? That informs how much negotiation room exists.
- Schools are F-rated, which usually means shorter tenancies and higher turnover. Who's the typical renter profile here, and what's been the actual vacancy rate?
- What's the average days-on-market for RENTAL listings here right now (not sales)? A rising rental-DOM trend means longer vacancies and softer asking-rent achievability than the comps imply.
- What's the recent tenant-quality profile in this submarket — average credit score on applications, eviction rate, late-payment / NSF rate, and stable-employment percentage? A property-management company in the area should have these aggregated.
- How much new for-sale + rental construction is in the pipeline within 1–3 miles? Heavy new supply typically softens prices + rents 12–24 months out; constrained supply supports both.
Investment metrics
- 1% rule
- 1.05% ✓
- Cap rate
- 8.21%
- Cash-on-cash
- 6.84%
- DSCR
- 1.30
- GRM
- 8.0
CMA / ARV
No comps found within radius.
Projected returns pro-forma
8.38% appreciation · 3.0% rent growth · sell at horizon
- IRR
- 26.0%
- Equity multiple
- 2.92×
- Total profit
- $51,112
- Equity at exit
- $74,634
- IRR
- 23.3%
- Equity multiple
- 6.31×
- Total profit
- $141,264
- Equity at exit
- $150,559
Cash invested: $26,600 (down + closing). Projections, not guarantees.
Landlord ↔ Tenant lean methodology
- Overall (STATE)
- 90 Strongly Landlord-Friendly
- State Alabama
- 90 Strongly Landlord-Friendly · R+15
- County
- — inherits STATE
- City
- — inherits STATE
ZIP-level market 35983
- Home prices YoY
- 4.0%
- Active inventory
- 55
- Price-to-rent
- 8.0×
Monthly cashflow live
- Estimated rent
- $995 medium interval (Pro) →
- Mortgage (P&I)
- −$498
- Tax from tax record
- −$97 /mo · $1,163/yr
- Insurance
- −$40
- HOA
- −$0
- Vacancy / Maint / Mgmt
- −$209
- Net cashflow
- $152
Break-even live
Sensitivity live
| Price | -10% $205 | -5% $179 | +0% $152 | +5% $125 | +10% $98 |
|---|---|---|---|---|---|
| Rent | -10% $73 | -5% $112 | +0% $152 | +5% $191 | +10% $230 |
| Rate | -1.0pp $200 | -0.5pp $176 | base $152 | +0.5pp $127 | +1.0pp $102 |
UW: 25.0% down · 7.5% · 30yr · 1.5% tax · 5.0% vac · 8.0% maint · 8.0% mgmt
Financing live
Cash to close
- Down payment
- $23,750
- Closing costs
- $2,850
- Reserves months
- —
- Total cash needed
- —
Loan-product check · same deal, 3 products live
Conventional
25% down · 7.5% · 30yr
- Down + closing
- —
- Monthly P&I
- —
- Monthly cashflow
- —
- DSCR
- —
- Eligible?
- —
Personal DTI + credit; lowest rate.
DSCR
20% down · 8.5% · 30yr
- Down + closing
- —
- Monthly P&I
- —
- Monthly cashflow
- —
- DSCR
- —
- Eligible?
- —
No personal income docs; deal must DSCR.
Hard money
10% down · 12.0% · 12mo
- Down + closing
- —
- Monthly P&I
- —
- Monthly cashflow
- —
- DSCR
- —
- Eligible?
- —
Short-term bridge; refi at stabilization.
Listing history 5 events
-
2021-06-04historical Contingent
-
2021-05-28$34,000 Active
-
2019-08-11price $39,000
-
2018-08-10soldstatus $17,500
-
2018-01-25$29,100
ⓘ Source: listings_history table (triggers on properties + properties_extension) + one-shot
backfill from property_details.listing_events for pre-trigger history.
Tax reassessment forecast AL · Resets to sale price
- Current annual tax
- $1,163 · $97/mo
- Projected year-2 tax
- $1,163 · $97/mo
- Expected delta
- $0/yr ($0/mo · 0.0%)
ⓘ Screening estimate from a state-policy table — verify with the county assessor before closing.
Climate risk First Street
- Flood 1/10 Low FEMA zone X (unshaded) · 0% chance over 30 yrs
- Wildfire 3/10 Moderate
- Heat 5/10 Major 6 d/yr ≥107°F today · 16 d/yr by 30 yrs out
- Wind 4/10 Moderate 21% chance of damaging wind over 30 yrs
- Air quality 2/10 Low 1 unhealthy d/yr today · 2 by 30 yrs out
Nearby sold comps map
Loading sold comps map…
Walkable amenities ~0.75 mi
Loading nearby amenities…
Taxation est. · year 1
- Rental income
- $11,946
- − Mortgage interest
- −$5,321
- − Property taxes
- −$1,163
- − Insurance
- −$475
- − Repairs & maintenance
- −$956
- − Management
- −$956
- − Depreciation
- −$2,764
- Taxable income
- $311
- Est. tax owed @ 24.0%
- −$75
- After-tax cash flow
- $1,746/yr
For passive investors: Depreciation is non-cash, so a rental often shows a tax loss while cash-flowing — sheltering income. Rental losses are passive: they offset passive income freely, and up to $25,000/yr can offset ordinary (W-2) income if you actively participate and your MAGI is under $100k (phasing out to $0 by $150k); unused losses carry forward. On sale, claimed depreciation is recaptured at up to 25%, and gains may owe capital-gains tax (a 1031 exchange can defer both). Figures are a year-1 estimate at your 24.0% rate — not tax advice; consult a CPA.
Schools (NCES district)
- District
- Cherokee County
- NCES district ID
- 0100630
- Math proficiency
- 21% ▼ -25.00%
- Reading proficiency
- 45% ▲ 4.00%
- Median HH income
- $37,824
- Composite
- 27.43/100
- National rank
- #6965
- State rank
- #58 of 129 in AL
Livability — Leesburg
- Score
- 60/100
- State rank
- #310
- US rank
- #19292
Category grades
Schools grade is shown separately in the Schools card above.
Census & demographics
- City population
- 3,782
- Population (ZIP)
- 3,782
Population outlook (Cherokee County) Hauer SSP2
- Today (2025)
- 24,929 people
- By 2030
- 24,177 · -3.0%
- By 2040
- 22,411 · -10.1%
- By 2050
- 20,595 · -17.4%
- By 2075
- 17,025 · -31.7%
- By 2100
- 13,700 · -45.0%
Race, ethnicity, and origin ACS 2023
- Neighborhood character
- Predominantly White (91%)
- Race & ethnicity
- White 91% Two or more races 7% Hispanic / Latino 3%
- Common ancestry
- Slovak 2% Italian 1% German 1%
- Foreign-born
- 2% · Canada
- Languages at home
- 97% English-only · Spanish 2% Russian/Polish/Slavic 1%
Political lean MEDSL · Cherokee
- 2024 margin
- Solid R (+75.5) · D 12.0% · R 87.5%
- 2008→2024 swing
- -24.3pp toward R · 2008: -51.2pp · 2024: -75.5pp
- All cycles
- 2024: R+75.5 2020: R+72.8 2016: R+69.4 2012: R+55.0 2008: R+51.2
Not yet ingested
- Civics
- —
Market trends
- HPI YoY
- ▲ 8.38%
- Current HPI
- 217.423
- Rent YoY
- —
- Metro
- —
- State GDP YoY
- ▲ 2.94%
- F500 in state
- 4
Industry mix (Fortune 500 HQ in AL)
| Industry | F500 HQs | Revenue |
|---|---|---|
| Financial Services | 1 | $8B |
|
||
| Healthcare | 1 | $5B |
|
||
Price history
+16.8% since first listed5 events — show timeline
- 2021-06-04 Contingent — VMLS
- 2021-05-28 Listed $34,000 VMLS
- 2019-08-11 Price Changed $39,000 VMLS
- 2018-08-10 Sold (MLS) $17,500 VMLS
- 2018-01-25 Listed $29,100 VMLS
Property tax history
+5.0%/yrLatest (2025): $1,163 · +5.3% YoY. Source: county tax records.
Cash-flow waterfall
monthlySold comps — $/sqft
last 12 mo · ≤1 miLoading sold comps…