1007 Quash St · Hampton, VA
Flood risk 6/10 · Moderate
- FEMA flood zone
- X (unshaded)
- Chance of flooding over 30 yrs
- 0.54%
- Est. flood insurance / yr
- $473 – $860
Fire risk 1/10 · Minimal
- Est. fire insurance / yr
- $666 – $1,236
Heat risk 9/10 · Severe
- Hot days now (above 105°F)
- 7 days/yr
- Hot days in 30 yrs
- 16 days/yr
Wind risk 8/10 · Major
- Chance of severe wind over 30 yrs
- 80.0%
Air-quality risk 2/10 · Minimal
- Unhealthy air days now
- 1 days/yr
- Unhealthy air days in 30 yrs
- 1 days/yr
Risk factors via First Street. Map © Google.
Why this score? — see what drove the C- grade
The composite is a weighted blend of 9 inputs, each scored 0–100. Each bar is that input's sub-score; the figure is the points it added to the 100-point composite (weight × sub-score).
- Cash flow +13.8/30.0
- ARV discount +13.6/15.0
- Schools +5.5/10.0
- DSCR +4.2/10.0
- Rent growth +3.9/5.0
- Livability +3.8/5.0
- 1% rule +3.2/10.0
- Condition / age +2.5/5.0
- Appreciation +0.0/10.0
$219,000
🖨 Deal sheet (PDF) 📄 Offer letter ✓ Due diligence
Listing remarks
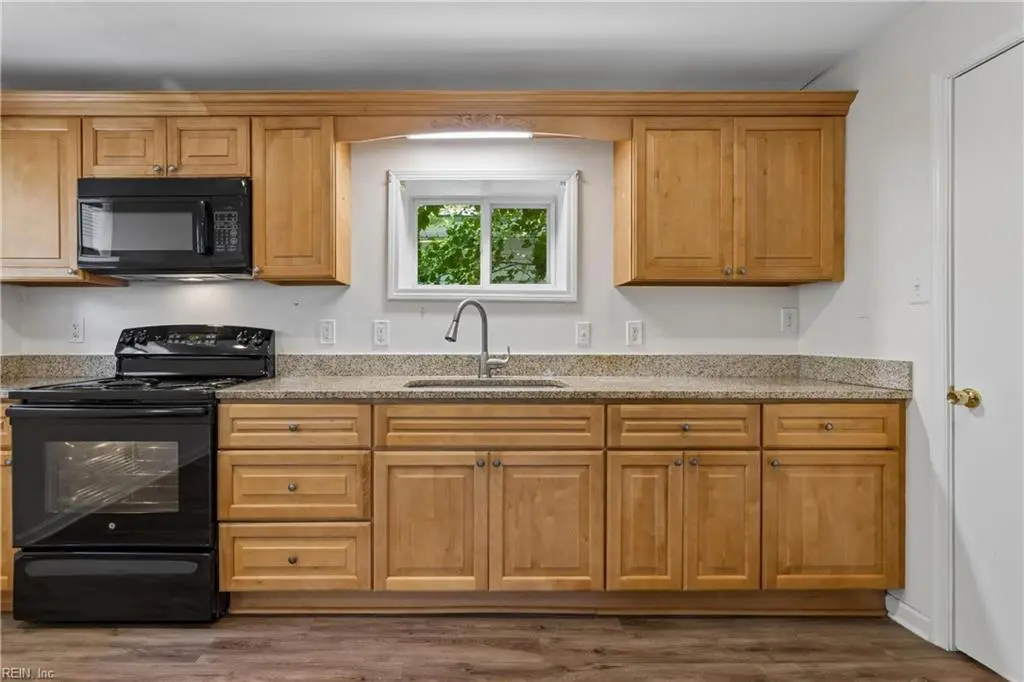
Conveniently located in Hampton's historic Phoebus area, this updated home offers easy access to Langley AFB, Norfolk Naval Station, Fort Monroe, beaches, restaurants, breweries, and waterfront attractions. Inside, you'll find updated flooring throughout, new carpet, updated windows, and a spacious kitchen featuring updated cabinetry, countertops, fixtures, and hardware that opens to a large dining area. The first-floor primary suite includes a full bath and walk-in closet, providing comfort and convenience. Sellers are also offering a $1,500 interior paint allowance, giving buyers the opportunity to add their own personal touch. With recent updates and a location close to major employers,
Key facts
- New carpet
- Updated windows
- Spacious kitchen
Tags
Property features AI
Finance
- Other: Neighborhood: KINGS POINT; City view
- HOA & community: No HOA
Exterior
- Parking: Off-street parking; Driveway spaces
- Utilities: City/County water; City/County sewer; Electric water heater; Electric power
- Home design: Detached Cape Cod; 1.5 stories; Crawl space foundation
- Construction: Asphalt shingle roof
- Exterior features: Vinyl siding; Partial fence
Interior
- Kitchen: Electric range; Microwave; Refrigerator; Dishwasher not listed
- Bedrooms: One bedroom has an ensuite; Bedroom and full bathroom on first floor
- Flooring: Carpet; Laminate
- Bathrooms: 2 full bathrooms
- Heating & cooling: Forced hot air heating; Central air conditioning
- Interior features: Master bedroom fireplace; Walk-in closet; 5 total rooms
- Laundry & utility: Washer; Dryer
Neighborhood map
What this means for you Summary
Snapshot
- This is a 3-bed/2.0-bath single-family listed at $219k.
Deal economics
- At list price, monthly cash flow is $20 ($244/yr) — positive.
- The deal already cash-flows at list — no discount required.
- To meet the 1% rule (rent ≥ 1% of price), the offer needs to be $180k (17.6% below list).
- Recommended offer: $180k (17.6% below list) — sets the bar for 1% rule.
- Cap rate 6.4% vs local median 4.5% in Hampton — top-decile yield for the area; either an underpriced asset or a hidden risk that comps aren't pricing in. Stress-test before assuming the spread holds.
Location & tenants
- Location reads 75/100 on livability (#133 in VA, #4,302 nationally) — a middle-class / working-renter tenant base. Strengths: housing A+, health & safety A+, cost of living A; Watch: crime C-, amenities D+, commute F.
- Hampton City Public School District (urban): math 60% / reading 70% proficiency, ranked #40 of 131 in VA (top 30%) — acceptable for families but not a draw, mixed tenant base, ~2y average lease.
- Zoned schools: Barron Elementary (math 62% / reading 77%, grade A-, #313 of 1,108 statewide, top 32%, 368 students, 87% FRL); C. Alton Lindsay Middle (math 52% / reading 57%, grade B-, #194 of 342 statewide, top 60%, 707 students, 73% FRL); Hampton High (math 60% / reading 75%, grade B, #183 of 319 statewide, top 58%, 1,359 students, 86% FRL) — zoned schools average 82% FRL vs 49% district-wide (33 pts higher); higher-poverty schools than district average — tighter screening recommended.
- Market conditions: Rents rising fast (+5.4%/yr); 235 active listings in the ZIP; 27 comparable units currently listed for rent nearby; rentals at typical pace (median 17d on market — plan ~3-4 weeks tenant-placement turnaround); 68 units permitted in Hampton city in 2024 (0 in 5+ unit buildings).
- This rent runs 30% of the median local income ($71k/yr) — at the standard rent-burdened threshold; future hikes will face affordability resistance.
Forward outlook
- Local home prices are declining (-3.0%/yr); year-one equity from $2k of loan paydown is wiped out by about $7k of value loss. Plan a longer hold.
- Hampton County population projected at -13% by 2050 — secular population decline; favor cash flow + early exit over multi-decade hold.
Negotiation context
- It's been on market 15 days — a 2% lower offer ($216k) is reasonable based on typical stale-listing flexibility.
- 2 sale attempts since 10y ago with the ask held roughly flat each time — persistent listings suggest the price (not the market) is what's stuck; bring a comps-based counter.
- Current owner paid $85k; list at $219k implies a 158% gain — meaningful room to come down on a strong offer.
Risks & watch-outs
- Watch-outs: built in 1913 — expect roof / HVAC / electrical / plumbing capex.
- Climate carrying-cost: major flood risk; severe wind risk, 80% chance of damaging wind over 30y; extreme-heat days projected 7→16/yr by 2055 (HVAC capex compounding) — expect insurance premiums to compound above CPI over the hold.
Questions for the listing agent
- Built in 1913 — when were the roof, HVAC, electrical panel, plumbing, and water heater last replaced?
- Is there a deadline driving the sale (1031 exchange, divorce, estate, relocation)? That informs how much negotiation room exists.
- Schools are B-rated — typically a magnet for longer-tenancy family renters. What's the average tenant stay here, and is there a school-zone premium baked into asking?
- What's the average days-on-market for RENTAL listings here right now (not sales)? A rising rental-DOM trend means longer vacancies and softer asking-rent achievability than the comps imply.
- What's the recent tenant-quality profile in this submarket — average credit score on applications, eviction rate, late-payment / NSF rate, and stable-employment percentage? A property-management company in the area should have these aggregated.
- How much new for-sale + rental construction is in the pipeline within 1–3 miles? Heavy new supply typically softens prices + rents 12–24 months out; constrained supply supports both.
Investment metrics
- 1% rule
- 0.82% ✗
- Cap rate
- 6.40%
- Cash-on-cash
- 0.40%
- DSCR
- 1.02
- GRM
- 10.1
CMA / ARV
- ARV (on-the-fly)
- $253,500
- Comps found
- 12
Show comp detail 12 sales within ~0.75 mi
| Address | Dist | Beds/Ba | Sqft | Sold | Price | $/sf | Match |
|---|---|---|---|---|---|---|---|
| 1209 Parkside Ave | 0.25mi | 3/2.0 | 1,288 (-1%) | 3mo | $250,000 | $194 | 84 |
| 1307 West Ave | 0.29mi | 3/2.0 | 1,168 (-10%) | 3mo | $225,000 | $193 | 67 |
| 712 Langley Ave | 0.23mi | 3/2.0 | 1,140 (-12%) | 3mo | $239,568 | $210 | 66 |
| 1209 West Ave | 0.20mi | 3/1.5 | 1,149 (-12%) | 6mo | $250,950 | $218 | 64 |
| 1212 Rowe St | 0.23mi | 3/1.0 | 1,133 (-13%) | 3mo | $130,000 | $115 | 61 |
| 1026 Easterly Ave | 0.24mi | 4/2.0 (+1) | 1,123 (-14%) | 0mo | $235,000 | $209 | 61 |
| 2 Monroe Dr | 0.67mi | 3/2.0 | 1,350 (+4%) | 2mo | $263,000 | $195 | 61 |
| 1019 Bethel Ave | 0.07mi | 3/5.0 | 1,123 (-14%) | 5mo | $255,000 | $227 | 58 |
| 1231 N King St | 0.74mi | 3/2.0 | 1,340 (+3%) | 6mo | $161,500 | $121 | 56 |
| 603 Washington St | 0.56mi | 2/1.5 (-1) | 1,177 (-10%) | 1mo | $199,000 | $169 | 50 |
| 25 Gibson Rd | 0.65mi | 3/2.0 | 1,463 (+12%) | 5mo | $253,000 | $173 | 44 |
| 16 Monroe Dr | 0.69mi | 3/1.0 | 1,148 (-12%) | 6mo | $224,997 | $196 | 39 |
Match score weights: distance 35% · size 25% · config 20% · recency 20%. Top-matched comps best support the ARV.
Projected returns pro-forma
-3.0% appreciation · 5.44% rent growth · sell at horizon
- IRR
- -13.2%
- Equity multiple
- 0.52×
- Total profit
- $-29,691
- Equity at exit
- $32,654
- IRR
- -1.0%
- Equity multiple
- 0.92×
- Total profit
- $-4,767
- Equity at exit
- $18,935
Cash invested: $61,320 (down + closing). Projections, not guarantees.
Landlord ↔ Tenant lean methodology
- Overall (STATE)
- 55 Moderately Landlord-Leaning
- State Virginia
- 55 Moderately Landlord-Leaning · D+2
- County
- — inherits STATE
- City
- — inherits STATE
ZIP-level market 23669
- Rents YoY
- 5.4%
- Active inventory
- 235
- Price-to-rent
- 10.1×
Monthly cashflow live
- Estimated rent
- $1,805 high interval (Pro) →
- Mortgage (P&I)
- −$1,148
- Tax from tax record
- −$166 /mo · $1,987/yr
- Insurance
- −$91
- HOA
- −$0
- Vacancy / Maint / Mgmt
- −$379
- Net cashflow
- $20
Break-even live
Sensitivity live
| Price | -10% $144 | -5% $82 | +0% $20 | +5% $-42 | +10% $-104 |
|---|---|---|---|---|---|
| Rent | -10% $-122 | -5% $-51 | +0% $20 | +5% $92 | +10% $163 |
| Rate | -1.0pp $131 | -0.5pp $76 | base $20 | +0.5pp $-36 | +1.0pp $-94 |
UW: 25.0% down · 7.5% · 30yr · 1.5% tax · 5.0% vac · 8.0% maint · 8.0% mgmt
Financing live
Cash to close
- Down payment
- $54,750
- Closing costs
- $6,570
- Reserves months
- —
- Total cash needed
- —
Loan-product check · same deal, 3 products live
Conventional
25% down · 7.5% · 30yr
- Down + closing
- —
- Monthly P&I
- —
- Monthly cashflow
- —
- DSCR
- —
- Eligible?
- —
Personal DTI + credit; lowest rate.
DSCR
20% down · 8.5% · 30yr
- Down + closing
- —
- Monthly P&I
- —
- Monthly cashflow
- —
- DSCR
- —
- Eligible?
- —
No personal income docs; deal must DSCR.
Hard money
10% down · 12.0% · 12mo
- Down + closing
- —
- Monthly P&I
- —
- Monthly cashflow
- —
- DSCR
- —
- Eligible?
- —
Short-term bridge; refi at stabilization.
Rent comps 27 comps
| Address | Beds | Baths | Sqft | Rent | $/sqft | DOM | Units | Dist |
|---|---|---|---|---|---|---|---|---|
| 1130 Quash St Hampton, VA | 3.0 | 1.0 | 1006 | $1,707 | $1.70 | 0d | 1 | 0.15mi |
| 1105 Easterly Ave Hampton, VA | 3.0 | 1.5 | 1204 | $1,800 | $1.50 | 16d | 1 | 0.20mi |
| 8 Rip Rap Rd Hampton, VA | 2.0 | 1.0 | 1000 | $1,200 | $1.20 | 23d | 1 | 0.22mi |
| 31 Saxony Pl Hampton, VA | 3.0 | 2.5 | 1315 | $1,645 | $1.25 | 19d | 1 | 0.30mi |
| 100 Spanish Trl Hampton, VA | 1.0–2.0 | 1.0–1.5 | 812 | $1,450 | $1.79 | 0d | 12 | 0.36mi |
| 17 S Gawain Way Hampton, VA | 3.0 | 1.5 | 1460 | $1,895 | $1.30 | 5d | 1 | 0.38mi |
| 19 Bernard Ave Hampton, VA | 2.0 | 1.0 | 906 | $995 | $1.10 | 23d | 1 | 0.39mi |
| 28 Monroe Dr Hampton, VA | 3.0 | 1.0 | 1110 | $1,600 | $1.44 | 45d | 1 | 0.70mi |
| 212 Dockside Dr Unit B Hampton, VA | 2.0 | 2.0 | 1253 | $1,795 | $1.43 | 45d | 1 | 0.71mi |
| 234 Washington St Hampton, VA | 2.0 | 1.0 | 1111 | $2,000 | $1.80 | 12d | 1 | 0.75mi |
| 24 Cavalier Rd Hampton, VA | 3.0 | 2.0 | 1014 | $1,850 | $1.82 | 6d | 1 | 0.91mi |
| 448 Chapel St Hampton, VA | 3.0 | 2.0 | 1425 | $1,850 | $1.30 | 5d | 1 | 0.93mi |
| 901 W Queen St Hampton, VA | 2.0–3.0 | 1.5–2.5 | 1096 | $1,600 | $1.46 | 45d | 1 | 0.96mi |
| 323 Roane Dr Hampton, VA | 3.0 | 1.0 | 974 | $1,495 | $1.53 | 6d | 1 | 0.96mi |
| 19 Magnolia Pl Hampton, VA | 3.0 | 1.5 | 1405 | $2,100 | $1.49 | 16d | 1 | 0.98mi |
| 2 Abbott Dr Hampton, VA | 1.0–3.0 | 1.0–3.5 | 1187 | $2,891 | $2.43 | 3d | 18 | 1.01mi |
| 709 E Pembroke Ave Unit B Hampton, VA | 2.0 | 1.5 | 1664 | $1,349 | $0.81 | 25d | 1 | 1.03mi |
| 626 Chapel St Hampton, VA | 4.0 | 2.0 | 1470 | $1,900 | $1.29 | 14d | 1 | 1.04mi |
| 450 Cedar Dr Hampton, VA | 3.0 | 1.0 | 912 | $1,500 | $1.64 | 14d | 1 | 1.05mi |
| 607 Lee St Hampton, VA | 3.0 | 1.5 | 1404 | $2,150 | $1.53 | 45d | 1 | 1.09mi |
| 305 Old Point Ave Hampton, VA | 3.0 | 1.0 | 1186 | $1,750 | $1.48 | 45d | 1 | 1.12mi |
| 109 Peachtree Ln Hampton, VA | 3.0 | 2.0 | 984 | $1,795 | $1.82 | 16d | 1 | 1.13mi |
| 600 Freeman Dr Hampton, VA | 1.0–2.0 | 1.0–2.0 | 892 | $1,961 | $2.20 | 0d | 5 | 1.39mi |
| 534 Brightwood Ave Hampton, VA | 3.0 | 3.0 | 1528 | $2,095 | $1.37 | 45d | 1 | 1.44mi |
| 316 Fountain Way Hampton, VA | 3.0 | 2.5 | 1850 | $2,600 | $1.41 | 19d | 1 | 1.44mi |
| 13 W Lamington Rd Hampton, VA | 3.0 | 1.5 | 1415 | $2,050 | $1.45 | 45d | 1 | 1.47mi |
| 27 Capps Qtrs #1 Hampton, VA | 3.0 | 2.5 | 1734 | $2,200 | $1.27 | 45d | 1 | 1.49mi |
Listing history 11 events
-
2026-06-21days on market $219,000 Active 15 DOM
-
2026-06-18days on market $219,000 Active 12 DOM
-
2026-06-17days on market $219,000 Active 11 DOM
-
2026-06-16days on market $219,000 Active 10 DOM
-
2026-06-15days on market $219,000 Active 9 DOM
-
2026-06-13days on market $219,000 Active 7 DOM
-
2026-06-13days on market $219,000 Active 6 DOM
-
2026-06-09days on market $219,000 Active 3 DOM
-
2026-06-08days on market $219,000 Active 2 DOM
-
2026-06-07remarks 699-char remark
-
2026-06-07$219,000 Active 1 DOM
ⓘ Source: listings_history table (triggers on properties + properties_extension) + one-shot
backfill from property_details.listing_events for pre-trigger history.
Tax reassessment forecast VA · Resets to sale price
- Current annual tax
- $1,987 · $166/mo
- Projected year-2 tax
- $1,987 · $166/mo
- Expected delta
- $0/yr ($0/mo · -0.0%)
ⓘ Screening estimate from a state-policy table — verify with the county assessor before closing.
Climate risk First Street
- Flood 6/10 Major FEMA zone X (unshaded) · 54% chance over 30 yrs
- Wildfire 1/10 Low
- Heat 9/10 Extreme 7 d/yr ≥105°F today · 16 d/yr by 30 yrs out
- Wind 8/10 Severe 80% chance of damaging wind over 30 yrs
- Air quality 2/10 Low 1 unhealthy d/yr today · 1 by 30 yrs out
Nearby sold comps map
Loading sold comps map…
Walkable amenities ~0.75 mi
Loading nearby amenities…
Taxation est. · year 1
- Rental income
- $21,656
- − Mortgage interest
- −$12,267
- − Property taxes
- −$1,987
- − Insurance
- −$1,095
- − Repairs & maintenance
- −$1,732
- − Management
- −$1,732
- − Depreciation
- −$6,371
- Taxable loss
- −$3,530
- Est. tax savings @ 24.0%
- +$847
- After-tax cash flow
- $1,091/yr
For passive investors: Depreciation is non-cash, so a rental often shows a tax loss while cash-flowing — sheltering income. Rental losses are passive: they offset passive income freely, and up to $25,000/yr can offset ordinary (W-2) income if you actively participate and your MAGI is under $100k (phasing out to $0 by $150k); unused losses carry forward. On sale, claimed depreciation is recaptured at up to 25%, and gains may owe capital-gains tax (a 1031 exchange can defer both). Figures are a year-1 estimate at your 24.0% rate — not tax advice; consult a CPA.
Schools (NCES district)
- District
- Hampton City Public School District
- NCES district ID
- 5101800
- Math proficiency
- 60% ▼ -21.00%
- Reading proficiency
- 70% ▼ -4.00%
- Median HH income
- $50,089
- Composite
- 55.19/100
- National rank
- #1272
- State rank
- #40 of 131 in VA
Livability — Hampton
- Score
- 75/100
- State rank
- #133
- US rank
- #4302
Category grades
Schools grade is shown separately in the Schools card above.
Census & demographics
- Census place
- Hampton, VA
- County
- Hampton City · 132,421 people
- City population
- 132,421
- Metro
- Virginia Beach-Norfolk-Newport News, VA-NC
- Population (ZIP)
- 39,884
- Household income
- $71,222
- Rent vs Own
- Severe rent burden
- 2130.0
Population outlook (Hampton County) Hauer SSP2
- Today (2025)
- 134,055 people
- By 2030
- 131,753 · -1.7%
- By 2040
- 125,017 · -6.7%
- By 2050
- 116,825 · -12.9%
- By 2075
- 97,033 · -27.6%
- By 2100
- 76,188 · -43.2%
Race, ethnicity, and origin ACS 2023
- Neighborhood character
- Diverse neighborhood (Simpson 0.63)
- Race & ethnicity
- Black 46% White 39% Two or more races 9% Hispanic / Latino 6% Asian 2%
- Hispanic origin (detail)
- Mexican 1% Puerto Rican 2%
- Common ancestry
- Slovak 2% Italian 1% Romanian 1%
- Foreign-born
- 4% · Canada
- Languages at home
- 95% English-only · Spanish 3% Other Asian/Pacific 1%
Political lean MEDSL · Hampton
- 2024 margin
- Solid D (+39.9) · D 69.2% · R 29.4% · Other 1.4%
- 2008→2024 swing
- +1.0pp no change · 2008: 38.9pp · 2024: 39.9pp
- All cycles
- 2024: D+39.9 2020: D+42.2 2016: D+37.8 2012: D+45.4 2008: D+38.9
Not yet ingested
- Civics
- —
Market trends
- HPI YoY
- ▼ -150.40%
- Current HPI
- 276.4636
- Rent YoY
- ▲ 5.44%
- Metro
- Virginia Beach-Norfolk-Newport News, VA-NC
- State GDP YoY
- ▲ 2.40%
- F500 in state
- 50
Industry mix (Fortune 500 HQ in VA)
| Industry | F500 HQs | Revenue |
|---|---|---|
| Aerospace / Defense | 4 | $236B |
|
||
| Technology / Defense | 3 | $32B |
|
||
| Financial Services | 2 | $176B |
|
||
| Utilities | 2 | $27B |
|
||
| Insurance | 2 | $25B |
|
||
| Technology | 2 | $15B |
|
||
Price history
+157.6% since first listed12 events — show timeline
- 2026-06-06 Listed $219,000 REINMLS
- 2016-06-03 Pending — REINMLS
- 2016-06-02 Listing Removed — REINMLS
- 2016-05-31 Listed $32,000 REINMLS
- 2016-02-15 Price Changed $45,000 REINMLS
- 2015-06-18 Price Changed $65,000 REINMLS
- 2015-02-18 Price Changed $71,900 REINMLS
- 2014-10-24 Price Changed $76,900 REINMLS
- 2014-10-24 Price Changed $719,000 REINMLS
- 2014-09-29 Price Changed $79,900 REINMLS
- 2014-08-02 Price Changed $85,000 REINMLS
- 2006-05-04 Sold (Public Records) $85,000 Public Records
Property tax history
+8.9%/yrLatest (2025): $1,987 · +20.8% YoY. Source: county tax records.
Cash-flow waterfall
monthlySold comps — $/sqft
last 12 mo · ≤1 miLoading sold comps…