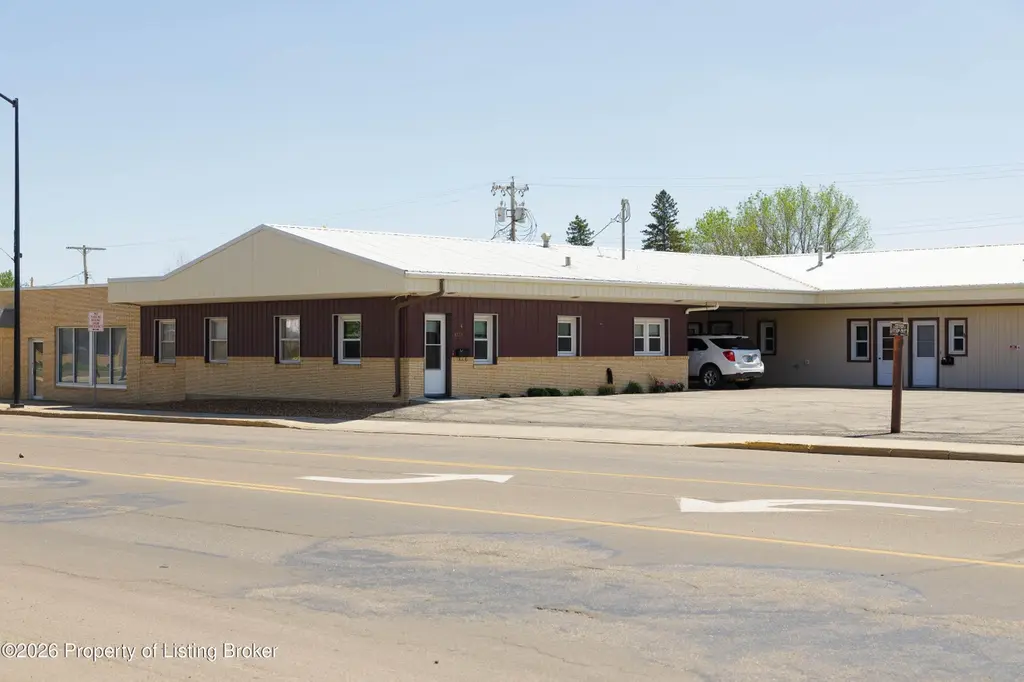
 Triplex
1331 Villard St W · Dickinson, ND
Flood risk 1/10 · Minimal
- FEMA flood zone
- X (unshaded)
- Chance of flooding over 30 yrs
- 0.0%
- Est. flood insurance / yr
- $507 – $1,088
Fire risk 3/10 · Minor
- Est. fire insurance / yr
- $1,289 – $2,393
Heat risk 2/10 · Minimal
- Hot days now (above 94°F)
- 7 days/yr
- Hot days in 30 yrs
- 13 days/yr
Wind risk 2/10 · Minimal
- Chance of severe wind over 30 yrs
- —
Air-quality risk 4/10 · Minor
- Unhealthy air days now
- 4 days/yr
- Unhealthy air days in 30 yrs
- 5 days/yr
Risk factors via First Street. Map © Google.
Why this score? — see what drove the C- grade
The composite is a weighted blend of 9 inputs, each scored 0–100. Each bar is that input's sub-score; the figure is the points it added to the 100-point composite (weight × sub-score).
- Cash flow +21.2/30.0
- ARV discount +7.5/15.0
- DSCR +6.8/10.0
- 1% rule +5.6/10.0
- Livability +3.8/5.0
- Schools +3.5/10.0
- Rent growth +3.0/5.0
- Condition / age +2.2/5.0
- Appreciation +0.0/10.0
$420,000
🖨 Deal sheet 📄 Offer letter ✓ Due diligence
Multi-family units
County records classify this as Multi-Family (2-4 Unit). Listing-text estimate: 3 units. confirmed
Key facts
- Central location
- Water heater
- Four unit apartment
Tags
Property features AI
Finance
- Financial info: Annual property tax approximately $2,950.83
Exterior
- Home design: Multi-family residential income property
- Exterior features: Lot approximately 0.25 acres; Lot dimensions about 130 x 80; Zoned Commercial
Interior
- Bathrooms: 4 full bathrooms
- Heating & cooling: Heating present
- Interior features: Has heating; Unbranded virtual tour available
Neighborhood map
What this means for you Summary
Snapshot
- This is a 3 × 3-bed/1.3-bath units multifamily listed at $420k. Condition is rated fair.
Deal economics
- At list price, monthly cash flow is $611 ($7k/yr) — positive. Per door: $204/mo.
- The deal already cash-flows at list — no discount required.
- Meets the 1% rule at list price ($4k rent vs $420k).
- Recommended offer: $414k (1.5% below list) — sets the bar for market timing.
- Cap rate 8.0% vs local median 2.9% in Dickinson — top-decile yield for the area; either an underpriced asset or a hidden risk that comps aren't pricing in. Stress-test before assuming the spread holds.
Location & tenants
- Location reads 76/100 on livability (#12 in ND, #3,334 nationally) — a middle-class / working-renter tenant base. Strengths: cost of living A+, housing A+, health & safety A+; Watch: amenities F, commute F.
- Dickinson 1 (town): math 35% / reading 43% proficiency, ranked #29 of 53 in ND (top 55%) — families likely to look elsewhere, expect single-tenant / working-renter base with shorter leases.
- Market conditions: Rents rising (+1.9%/yr); 235 active listings in the ZIP; solid renter incomes; 20 units permitted in Stark County in 2024 (0 in 5+ unit buildings).
- At $4,447/mo this rent would consume 62% of the median local household income ($86k/yr) (locally 813% of renters already pay >50% of income on rent) — very limited rent-growth headroom before tenants either downsize or default.
Forward outlook
- Local home prices are declining (-3.0%/yr); year-one equity from $3k of loan paydown is wiped out by about $13k of value loss. Plan a longer hold.
- Stark County population projected at +120% by 2050 — long-run rental-demand tailwind backs the buy-and-hold thesis.
Negotiation context
- It's been on market 15 days — a 2% lower offer ($414k) is reasonable based on typical stale-listing flexibility.
Risks & watch-outs
- Watch-outs: built in 1958 — expect roof / HVAC / electrical / plumbing capex.
Questions for the listing agent
- Can we see the unit-by-unit rent roll, current vacancy, and any below-market leases? What's the average tenancy length?
- What capital expenditures (roof, boiler, parking lot, exteriors) have been made in the last 5 years, and what's planned in the next 2?
- Have any recent inspections been done? Can we get a copy of the seller's disclosures and any deferred-maintenance estimates?
- Built in 1958 — when were the roof, HVAC, electrical panel, plumbing, and water heater last replaced?
- Is there a deadline driving the sale (1031 exchange, divorce, estate, relocation)? That informs how much negotiation room exists.
- Schools are B-rated — typically a magnet for longer-tenancy family renters. What's the average tenant stay here, and is there a school-zone premium baked into asking?
- What's the average days-on-market for RENTAL listings here right now (not sales)? A rising rental-DOM trend means longer vacancies and softer asking-rent achievability than the comps imply.
- What's the recent tenant-quality profile in this submarket — average credit score on applications, eviction rate, late-payment / NSF rate, and stable-employment percentage? A property-management company in the area should have these aggregated.
- How much new apartment / multifamily construction is in the pipeline within 1–3 miles? Heavy new supply (>2% of stock underway) typically softens rents 12–24 months out; light construction supports rent growth.
Investment metrics
- 1% rule
- 1.06% ✓
- Cap rate
- 8.04%
- Cash-on-cash
- 6.23%
- DSCR
- 1.28
- GRM
- 7.9
CMA / ARV
No comps found within radius.
Projected returns pro-forma
-3.0% appreciation · 1.95% rent growth · sell at horizon
- IRR
- -7.9%
- Equity multiple
- 0.71×
- Total profit
- $-33,751
- Equity at exit
- $62,623
- IRR
- 0.3%
- Equity multiple
- 1.02×
- Total profit
- $2,279
- Equity at exit
- $36,314
Cash invested: $117,600 (down + closing). Projections, not guarantees.
Landlord ↔ Tenant lean methodology
- Overall (STATE)
- 82 Strongly Landlord-Friendly
- State North Dakota
- 82 Strongly Landlord-Friendly · R+20
- County
- — inherits STATE
- City
- — inherits STATE
ZIP-level market 58601
- Rents YoY
- 1.9%
- Active inventory
- 235
- Price-to-rent
- 23.6×
Monthly cashflow live
- Estimated rent
- $4,447 medium interval (Pro) →
- Mortgage (P&I)
- −$2,203
- Tax est. 1.5%
- −$525 /mo · $6,300/yr
- Insurance
- −$175
- HOA
- −$0
- Vacancy / Maint / Mgmt
- −$934
- Net cashflow
- $611
Break-even live
3-unit breakdown (identical units grouped — click to expand)
| Units | Beds | Baths | Est. rent |
|---|---|---|---|
| 3× units | 3 | 1.3 | $4,446 |
| #1 | 3 | 1.3 | $1,482 |
| #2 | 3 | 1.3 | $1,482 |
| #3 | 3 | 1.3 | $1,482 |
| Total (3 units) | $4,447 | ||
UW: 25.0% down · 7.5% · 30yr · 1.5% tax · 5.0% vac · 8.0% maint · 8.0% mgmt
Financing live
Cash to close
- Down payment
- $105,000
- Closing costs
- $12,600
- Reserves months
- —
- Total cash needed
- —
Loan-product check · same deal, 3 products live
Conventional
25% down · 7.5% · 30yr
- Down + closing
- —
- Monthly P&I
- —
- Monthly cashflow
- —
- DSCR
- —
- Eligible?
- —
Personal DTI + credit; lowest rate.
DSCR
20% down · 8.5% · 30yr
- Down + closing
- —
- Monthly P&I
- —
- Monthly cashflow
- —
- DSCR
- —
- Eligible?
- —
No personal income docs; deal must DSCR.
Hard money
10% down · 12.0% · 12mo
- Down + closing
- —
- Monthly P&I
- —
- Monthly cashflow
- —
- DSCR
- —
- Eligible?
- —
Short-term bridge; refi at stabilization.
Listing history 11 events
-
2026-06-19days on market $420,000 Active 15 DOM
-
2026-06-18days on market $420,000 Active 14 DOM
-
2026-06-17days on market $420,000 Active 13 DOM
-
2026-06-16days on market $420,000 Active 12 DOM
-
2026-06-15days on market $420,000 Active 11 DOM
-
2026-06-14days on market $420,000 Active 9 DOM
-
2026-06-12days on market $420,000 Active 8 DOM
-
2026-06-09days on market $420,000 Active 5 DOM
-
2026-06-08days on market $420,000 Active 4 DOM
-
2026-06-07days on market $420,000 Active 3 DOM
-
2026-06-05$420,000 Active 1 DOM
ⓘ Source: listings_history table (triggers on properties + properties_extension) + one-shot
backfill from property_details.listing_events for pre-trigger history.
Climate risk First Street
- Flood 1/10 Low FEMA zone X (unshaded) · 0% chance over 30 yrs
- Wildfire 3/10 Moderate
- Heat 2/10 Low 7 d/yr ≥94°F today · 13 d/yr by 30 yrs out
- Wind 2/10 Low
- Air quality 4/10 Moderate 4 unhealthy d/yr today · 5 by 30 yrs out
Nearby sold comps map
Loading sold comps map…
Walkable amenities ~0.75 mi
Loading nearby amenities…
Taxation est. · year 1
- Rental income
- $53,364
- − Mortgage interest
- −$23,527
- − Property taxes
- −$6,300
- − Insurance
- −$2,100
- − Repairs & maintenance
- −$4,269
- − Management
- −$4,269
- − Depreciation
- −$12,218
- Taxable income
- $681
- Est. tax owed @ 24.0%
- −$163
- After-tax cash flow
- $7,164/yr
For passive investors: Depreciation is non-cash, so a rental often shows a tax loss while cash-flowing — sheltering income. Rental losses are passive: they offset passive income freely, and up to $25,000/yr can offset ordinary (W-2) income if you actively participate and your MAGI is under $100k (phasing out to $0 by $150k); unused losses carry forward. On sale, claimed depreciation is recaptured at up to 25%, and gains may owe capital-gains tax (a 1031 exchange can defer both). Figures are a year-1 estimate at your 24.0% rate — not tax advice; consult a CPA.
Condition & rehab AI · 13 photos
This multi-family property requires extensive repairs and updates to improve its condition and value. The roof and exterior are in poor condition, and the interior needs freshening up with new carpet, paint, and appliances.
Repairs flagged
- Major roof — Cracked and weathered
- Major exterior — Weathered siding
- Major flooring — Worn carpet
- Major interior walls/paint — Worn paint
- Major kitchen — Old appliances
- Major bathrooms — Old fixtures
- Major systems — Old HVAC system
Value-add opportunities
- Resale New roof — Improves overall appearance and value
- Resale New siding — Enhances curb appeal and value
- Resale New carpet — Freshens up the interior and adds value
- Resale Paint interior walls — Freshens up the interior and adds value
- Both Upgrade appliances — Improves functionality and adds value
- Both Upgrade fixtures — Improves functionality and adds value
- Both Upgrade HVAC system — Improves comfort and adds value
Renovation cost estimate screening
| Repair item | Severity | Est. cost |
|---|---|---|
| roof · Cracked and weathered | Major | $15,000–50,000 |
| exterior · Weathered siding | Major | $15,000–50,000 |
| flooring · Worn carpet | Major | $15,000–50,000 |
| interior walls/paint · Worn paint | Major | $15,000–50,000 |
| kitchen · Old appliances | Major | $15,000–50,000 |
| bathrooms · Old fixtures | Major | $15,000–50,000 |
| systems · Old HVAC system | Major | $15,000–50,000 |
| Total estimated repair cost · 7 items | $105,000–350,000 |
Value-add ROI direction
- Resale New roof — Improves overall appearance and value ↑
- Resale New siding — Enhances curb appeal and value ↑
- Resale New carpet — Freshens up the interior and adds value ↑
- Resale Paint interior walls — Freshens up the interior and adds value ↑
- Both Upgrade appliances — Improves functionality and adds value ↑
- Both Upgrade fixtures — Improves functionality and adds value ↑
- Both Upgrade HVAC system — Improves comfort and adds value ↑
ⓘ Cost ranges are severity-bucket heuristics (US national rule-of-thumb). Get contractor quotes + a written scope before underwriting a rehab budget.
Schools (NCES district)
- District
- Dickinson 1
- NCES district ID
- 3800038
- Math proficiency
- 35% ▼ -12.00%
- Reading proficiency
- 43% ▼ -7.00%
- Median HH income
- $63,270
- Composite
- 34.9/100
- National rank
- #5080
- State rank
- #29 of 53 in ND
Livability — Dickinson
- Score
- 76/100
- State rank
- #12
- US rank
- #3334
Category grades
Schools grade is shown separately in the Schools card above.
Census & demographics
- Census place
- Dickinson, ND
- County
- Stark County · 29,916 people
- City population
- 29,916
- Metro
- Dickinson, ND
- Population (ZIP)
- 29,916
- Household income
- $85,821
- Rent vs Own
- Severe rent burden
- 813.0
Population outlook (Stark County) Hauer SSP2
- Today (2025)
- 50,426 people
- By 2030
- 60,812 · +20.6%
- By 2040
- 84,155 · +66.9%
- By 2050
- 110,718 · +119.6%
- By 2075
- 186,710 · +270.3%
- By 2100
- 264,902 · +425.3%
Race, ethnicity, and origin ACS 2023
- Neighborhood character
- Predominantly White (85%)
- Race & ethnicity
- White 85% Hispanic / Latino 7% Two or more races 5% Black 3% Asian 1%
- Hispanic origin (detail)
- Mexican 5%
- Common ancestry
- Portuguese 9% Scotch-Irish 2% Lithuanian 2%
- Foreign-born
- 4% · Canada, China
- Languages at home
- 92% English-only · Spanish 4% German/W. Germanic 1% Arabic 1%
Political lean MEDSL · Stark
- 2024 margin
- Solid R (+65.6) · D 16.5% · R 82.1% · Other 1.5%
- 2008→2024 swing
- -36.5pp toward R · 2008: -29.1pp · 2024: -65.6pp
- All cycles
- 2024: R+65.6 2020: R+63.9 2016: R+65.8 2012: R+49.4 2008: R+29.1
Not yet ingested
- Civics
- —
Market trends
- HPI YoY
- ▼ -133.57%
- Current HPI
- 188.1029
- Rent YoY
- ▲ 1.95%
- Metro
- Dickinson, ND
- State GDP YoY
- ▲ 2.09%
- F500 in state
- 2
Industry mix (Fortune 500 HQ in ND)
| Industry | F500 HQs | Revenue |
|---|---|---|
| Utilities / Construction | 1 | $6B |
|
||
Price history
1 event — show timeline
- 2026-06-04 Listed $420,000 Badlands BOR MLS
Cash-flow waterfall
monthlySold comps — $/sqft
last 12 mo · ≤1 miLoading sold comps…