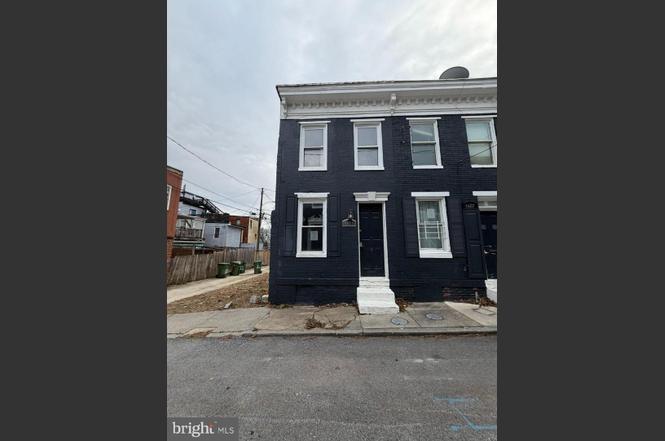
1605 Lemmon St · Baltimore, MD
Flood risk 1/10 · Minimal
- FEMA flood zone
- X (unshaded)
- Chance of flooding over 30 yrs
- 0.0%
- Est. flood insurance / yr
- $473 – $860
Fire risk 1/10 · Minimal
- Est. fire insurance / yr
- $755 – $1,403
Heat risk 7/10 · Major
- Hot days now (above 103°F)
- 7 days/yr
- Hot days in 30 yrs
- 15 days/yr
Wind risk 6/10 · Moderate
- Chance of severe wind over 30 yrs
- 27.0%
Air-quality risk 4/10 · Minor
- Unhealthy air days now
- 6 days/yr
- Unhealthy air days in 30 yrs
- 7 days/yr
Risk factors via First Street. Map © Google.
Why this score? — see what drove the B- grade
The composite is a weighted blend of 9 inputs, each scored 0–100. Each bar is that input's sub-score; the figure is the points it added to the 100-point composite (weight × sub-score).
- Cash flow +30.0/30.0
- 1% rule +10.0/10.0
- DSCR +10.0/10.0
- ARV discount +7.5/15.0
- Rent growth +4.4/5.0
- Livability +3.8/5.0
- Condition / age +2.5/5.0
- Schools +1.0/10.0
- Appreciation +0.0/10.0
$40,000
🖨 Deal sheet 📄 Offer letter ✓ Due diligence
Listing remarks MLS
REAL ESTATE AUCTION ON SITE TUESDAY, NOVEMBER 5, 2019 AT 12:00 NOON. List price is suggested opening bid only. $2,500 cashier's check deposit required to bid. Home is 1 of 10 rental properties on block being auctioned same day. Currently rented for $700/month. Please contact listing broker's office for full terms, bidder pre-registration form and property details.
Key facts
- Access to parks
- Full basement
- Built 1880
Tags
Property features AI
Exterior
- Parking: On-street parking
- Utilities: Public water; Public septic; Natural gas service
- Home design: Brick construction; Fee simple ownership
- Construction: Brick exterior; Permanent foundation; Finished above-grade area per assessor
- Exterior features: End of row townhouse; Above-grade and below-grade structures noted
Interior
- Bedrooms: Two bedrooms on the first upper level
- Bathrooms: Three full bathrooms (two on the first upper level, one on the main level)
- Heating & cooling: Forced air heating; Electric cooling; Natural gas hot water
- Interior features: Full, unfinished basement
Neighborhood map
What this means for you Summary
Snapshot
- This is a 2-bed/1.0-bath townhouse listed at $40k.
Deal economics
- At list price, monthly cash flow is $818 ($10k/yr) — positive.
- The deal already cash-flows at list — no discount required.
- Meets the 1% rule at list price ($1k rent vs $40k).
- Recommended offer: $38k (6.0% below list) — sets the bar for market timing.
- Cap rate 30.8% vs local median 6.0% in Baltimore — top-decile yield for the area; either an underpriced asset or a hidden risk that comps aren't pricing in. Stress-test before assuming the spread holds.
Location & tenants
- Location reads 76/100 on livability (#90 in MD, #3,396 nationally) — a middle-class / working-renter tenant base. Strengths: amenities A+, commute A+, housing A+; Watch: schools D, crime F.
- Baltimore City Public Schools (urban): math 7% / reading 16% proficiency, ranked #24 of 24 in MD (top 100%) — low school quality limits family demand, transient renter base, plan for 1-2y turnover; 79% free/reduced lunch — lower-income household profile, screen leases tightly.
- Market conditions: Rents rising fast (+7.5%/yr); 422 active listings in the ZIP; 40 comparable units currently listed for rent nearby; rentals at typical pace (median 18d on market — plan ~3-4 weeks tenant-placement turnaround); 1,273 units permitted in Baltimore city in 2024 (1,104 in 5+ unit buildings).
- This rent runs 39% of the median local income ($46k/yr) — at the standard rent-burdened threshold; future hikes will face affordability resistance.
Forward outlook
- Local home prices are declining (-3.0%/yr); year-one equity from $277 of loan paydown is wiped out by about $1k of value loss. Plan a longer hold.
- Baltimore County population projected to shrink 4% by 2050 — rents likely to lag national; underwrite the cash flow, not the appreciation.
- At projected returns (-3.0% appreciation + 7.5% rent growth), your $11k cash investment doubles in ~2 years — after that, you're playing with house money.
Negotiation context
- It's been on market 63 days — a 6% lower offer ($38k) is reasonable based on typical stale-listing flexibility.
- 3 sale attempts since 24y ago; this cycle's ask has dropped $10k (20%) from the opening price — seller is motivated, your offer sets the floor, not the list.
Risks & watch-outs
- Watch-outs: property tax is 3.6% of price; built in 1880 — expect roof / HVAC / electrical / plumbing capex.
- Climate carrying-cost: major wind risk, 27% chance of damaging wind over 30y; extreme-heat days projected 7→15/yr by 2055 (HVAC capex compounding) — expect insurance premiums to compound above CPI over the hold.
Questions for the listing agent
- It's been on market 63 days. Have you received any prior offers? Is the seller open to a 6% concession, seller financing, or rate buy-down credit?
- Built in 1880 — when were the roof, HVAC, electrical panel, plumbing, and water heater last replaced?
- Property tax is high relative to price — has the assessment been appealed recently, and will the sale trigger a re-assessment?
- Why hasn't it sold? Are there any deal-killer items the seller is aware of (foundation, flood, title, zoning, code violations)?
- Is there a deadline driving the sale (1031 exchange, divorce, estate, relocation)? That informs how much negotiation room exists.
- Schools are D-rated, which usually means shorter tenancies and higher turnover. Who's the typical renter profile here, and what's been the actual vacancy rate?
- Crime grade is F in this area — have there been break-ins, vandalism, or insurance claims at this property in the last 3 years? What carrier currently insures it and at what premium?
- What's the average days-on-market for RENTAL listings here right now (not sales)? A rising rental-DOM trend means longer vacancies and softer asking-rent achievability than the comps imply.
- What's the recent tenant-quality profile in this submarket — average credit score on applications, eviction rate, late-payment / NSF rate, and stable-employment percentage? A property-management company in the area should have these aggregated.
- How much new for-sale + rental construction is in the pipeline within 1–3 miles? Heavy new supply typically softens prices + rents 12–24 months out; constrained supply supports both.
Investment metrics
- 1% rule
- 3.68% ✓
- Cap rate
- 30.82%
- Cash-on-cash
- 87.60%
- DSCR
- 4.90
- GRM
- 2.3
CMA / ARV
- ARV (on-the-fly)
- $19,894
- Comps found
- 12
Show comp detail 12 sales within ~0.75 mi
| Address | Dist | Beds/Ba | Sqft | Sold | Price | $/sf | Match |
|---|---|---|---|---|---|---|---|
| 1613 Lemmon St | 0.01mi | 2/1.0 | 686 (0%) | 1mo | $20,000 | $29 | 99 |
| 1611 Lemmon St | 0.01mi | 2/1.0 | 686 (0%) | 1mo | $20,000 | $29 | 99 |
| 1609 Lemmon St | 0.00mi | 1/1.0 (-1) | 686 (0%) | 1mo | $20,000 | $29 | 94 |
| 1605 Lemmon St | 0.00mi | 2/3.0 | 686 (0%) | 1mo | $20,000 | $29 | 91 |
| 1606 Lemmon St | 0.01mi | 2/1.0 | 744 (+8%) | 1mo | $20,000 | $27 | 85 |
| 1608 Lemmon St | 0.01mi | 2/1.0 | 744 (+8%) | 1mo | $20,000 | $27 | 85 |
| 1612 Lemmon St | 0.01mi | 2/1.0 | 744 (+8%) | 1mo | $20,000 | $27 | 85 |
| 1610 Lemmon St | 0.01mi | 2/1.0 | 744 (+8%) | 1mo | $20,000 | $27 | 85 |
| 1604 Lemmon St | 0.01mi | 1/1.0 (-1) | 744 (+8%) | 1mo | $20,000 | $27 | 80 |
| 1926 Wilhelm St | 0.30mi | 2/1.0 | 684 (-0%) | 7mo | $7,500 | $11 | 80 |
| 623 Archer St | 0.74mi | 2/2.0 | 720 (+5%) | 4mo | $190,000 | $264 | 50 |
| 847 Reinhart St | 0.70mi | 2/2.0 | 624 (-9%) | 3mo | $160,000 | $256 | 46 |
Match score weights: distance 35% · size 25% · config 20% · recency 20%. Top-matched comps best support the ARV.
Projected returns pro-forma
-3.0% appreciation · 7.51% rent growth · sell at horizon
- IRR
- 93.6%
- Equity multiple
- 5.70×
- Total profit
- $52,647
- Equity at exit
- $5,964
- IRR
- 97.4%
- Equity multiple
- 13.92×
- Total profit
- $144,655
- Equity at exit
- $3,458
Cash invested: $11,200 (down + closing). Projections, not guarantees.
Landlord ↔ Tenant lean methodology
- Overall (CITY)
- 12 Strongly Tenant-Friendly
- State Maryland
- 27 Tenant-Leaning · D+14
- County
- — inherits STATE
- City Baltimore
- 12 Strongly Tenant-Friendly · D+58
ZIP-level market 21223
- Rents YoY
- 7.5%
- Active inventory
- 422
- Price-to-rent
- 2.3×
Monthly cashflow live
- Estimated rent
- $1,474 high interval (Pro) →
- Mortgage (P&I)
- −$210
- Tax from tax record
- −$120 /mo · $1,444/yr
- Insurance
- −$17
- HOA
- −$0
- Vacancy / Maint / Mgmt
- −$310
- Net cashflow
- $818
Break-even live
UW: 25.0% down · 7.5% · 30yr · 1.5% tax · 5.0% vac · 8.0% maint · 8.0% mgmt
Financing live
Cash to close
- Down payment
- $10,000
- Closing costs
- $1,200
- Reserves months
- —
- Total cash needed
- —
Loan-product check · same deal, 3 products live
Conventional
25% down · 7.5% · 30yr
- Down + closing
- —
- Monthly P&I
- —
- Monthly cashflow
- —
- DSCR
- —
- Eligible?
- —
Personal DTI + credit; lowest rate.
DSCR
20% down · 8.5% · 30yr
- Down + closing
- —
- Monthly P&I
- —
- Monthly cashflow
- —
- DSCR
- —
- Eligible?
- —
No personal income docs; deal must DSCR.
Hard money
10% down · 12.0% · 12mo
- Down + closing
- —
- Monthly P&I
- —
- Monthly cashflow
- —
- DSCR
- —
- Eligible?
- —
Short-term bridge; refi at stabilization.
Rent comps 40 comps
| Address | Beds | Baths | Sqft | Rent | $/sqft | DOM | Units | Dist |
|---|---|---|---|---|---|---|---|---|
| 1712 W Lombard St #4 Baltimore, MD | 1.0 | 1.0 | 550 | $900 | $1.64 | 43d | 1 | 0.07mi |
| 28 N Norris St Baltimore, MD | 1.0 | 2.0 | 700 | $1,450 | $2.07 | 43d | 1 | 0.27mi |
| 48 S Carrollton Ave Unit 4 Baltimore, MD | 2.0 | 1.0 | 670 | $1,600 | $2.39 | 43d | 1 | 0.34mi |
| 101 N Schroeder St Baltimore, MD | 3.0 | 1.0–2.0 | 1037 | $2,481 | $2.39 | 2d | 12 | 0.59mi |
| 709 N Carrollton Ave Unit 1A Baltimore, MD | 1.0 | 1.0 | 500 | $800 | $1.60 | 16d | 1 | 0.83mi |
| 121 S Fremont Ave Baltimore, MD | 1.0 | 1.0 | 582 | $2,100 | $3.61 | 20d | 5 | 0.85mi |
| 725 W Pratt St Baltimore, MD | 1.0 | 1.0 | 584 | $1,925 | $3.29 | 10d | 9 | 0.88mi |
| 1339 W Lafayette Ave #1 Baltimore, MD | 2.0 | 2.0 | 700 | $1,600 | $2.29 | 12d | 1 | 0.90mi |
| 910 N Arlington Ave Unit 1 Baltimore, MD | 1.0 | 1.0 | 551 | $999 | $1.81 | 17d | 1 | 1.02mi |
| 519 W Pratt St Baltimore, MD | 1.0 | 1.0 | 576 | $1,400 | $2.43 | 2d | 2 | 1.07mi |
| 410 W Lombard St Baltimore, MD | 1.0 | 1.0 | 611 | $1,995 | $3.26 | 1d | 4 | 1.14mi |
| 318 N Paca St Unit 10 Baltimore, MD | 2.0 | 1.0 | 600 | $1,200 | $2.00 | 21d | 1 | 1.20mi |
| 318 N Paca St Unit 9 Baltimore, MD | 1.0 | 1.0 | 600 | $1,000 | $1.67 | 43d | 1 | 1.20mi |
| 1 S Eutaw St Unit 1BR Baltimore, MD | 1.0 | 1.0 | 600 | $1,245 | $2.08 | 14d | 1 | 1.21mi |
| 301 W Lombard St Baltimore, MD | 1.0 | 1.0–2.0 | 499 | $1,775 | $3.56 | 1d | 30 | 1.22mi |
| 11 S Eutaw St Baltimore, MD | 1.0–2.0 | 1.0–2.0 | 1023 | $2,146 | $2.10 | 1d | 11 | 1.23mi |
| 300 W Redwood St Baltimore, MD | 1.0 | 1.0 | 565 | $2,400 | $4.25 | 17d | 1 | 1.25mi |
| 300 W Lombard St Baltimore, MD | 2.0 | 1.0–2.0 | 686 | $1,835 | $2.67 | 2d | 7 | 1.25mi |
| 506 W Franklin St Baltimore, MD | 1.0 | 1.0 | 415 | $925 | $2.23 | 23d | 1 | 1.26mi |
| 305 W Fayette St Baltimore, MD | 1.0–2.0 | 1.0–2.0 | 895 | $1,640 | $1.83 | 43d | 1 | 1.27mi |
| 8 N Howard St Baltimore, MD | 2.0 | 1.0–2.0 | 1433 | $3,600 | $2.51 | 1d | 36 | 1.27mi |
| 300 W Fayette St Baltimore, MD | 3.0 | 1.0–3.0 | 1267 | $1,865 | $1.47 | 3d | 9 | 1.27mi |
| 1719 Pennsylvania Ave Baltimore, MD | 1.0 | 1.0 | 540 | $1,200 | $2.22 | 17d | 1 | 1.32mi |
| 319 W Franklin St Unit 301-0506 Baltimore, MD | 1.0 | 1.0 | 708 | $1,350 | $1.91 | 14d | 1 | 1.33mi |
| 628 N Eutaw St Baltimore, MD | 1.0–3.0 | 1.0–2.0 | 824 | $1,605 | $1.95 | 1d | 6 | 1.35mi |
| 301 W Franklin St Baltimore, MD | 1.0 | 1.0 | 586 | $1,600 | $2.73 | 12d | 5 | 1.36mi |
| 301 W Franklin St Unit SJ-0506 Baltimore, MD | 1.0 | 1.0 | 708 | $1,500 | $2.12 | 43d | 1 | 1.36mi |
| 301 W Franklin St Unit SJ-0411 Baltimore, MD | 1.0 | 1.0 | 551 | $1,450 | $2.63 | 43d | 1 | 1.36mi |
| 306 W Franklin St Baltimore, MD | 1.0–2.0 | 1.0–2.0 | 733 | $1,822 | $2.48 | 3d | 5 | 1.37mi |
| 2 Hopkins Plaza Baltimore, MD | 2.0 | 1.0–2.0 | 942 | $3,115 | $3.31 | 2d | 12 | 1.38mi |
| 1306 McCulloh St #1 Baltimore, MD | 1.0 | 1.0 | 750 | $1,200 | $1.60 | 43d | 1 | 1.40mi |
| 225 Park Ave Baltimore, MD | 2.0 | 1.0 | 588 | $1,535 | $2.61 | 23d | 1 | 1.42mi |
| 101 W Fayette St Baltimore, MD | 1.0 | 1.0 | 555 | $1,800 | $3.24 | 4d | 26 | 1.42mi |
| 600 N Howard St Unit 502 Baltimore, MD | 2.0 | 1.0 | 550 | $1,650 | $3.00 | 43d | 1 | 1.43mi |
| 600 N Howard St Unit 402 Baltimore, MD | 2.0 | 1.0 | 550 | $1,565 | $2.85 | 43d | 1 | 1.43mi |
| 600 N Howard St Unit 102 Baltimore, MD | 2.0 | 1.0 | 550 | $1,465 | $2.66 | 43d | 1 | 1.43mi |
| 600 N Howard St Unit 302 Baltimore, MD | 2.0 | 1.0 | 453 | $1,565 | $3.45 | 4d | 1 | 1.43mi |
| 500 Park Ave Baltimore, MD | 1.0 | 1.0 | 583 | $1,947 | $3.34 | 2d | 7 | 1.43mi |
| 117 W Saratoga St Unit 2F Baltimore, MD | 1.0 | 1.0 | 650 | $1,200 | $1.85 | 43d | 1 | 1.45mi |
| 117 W Saratoga St Unit 4F Baltimore, MD | 1.0 | 1.0 | 650 | $1,195 | $1.84 | 23d | 1 | 1.45mi |
Listing history 13 events
-
2026-04-30status Pending
-
2026-03-31price $40,000
-
2026-02-26$49,900 Active
-
2025-11-07soldstatus $500,000
-
2022-11-28historical
-
2020-01-27soldstatus $212,000
-
2019-12-31soldstatus $21,200 Closed 366-char remark
Show marketing remark (366 chars)
REAL ESTATE AUCTION ON SITE TUESDAY, NOVEMBER 5, 2019 AT 12:00 NOON. List price is suggested opening bid only. $2,500 cashier's check deposit required to bid. Home is 1 of 10 rental properties on block being auctioned same day. Currently rented for $700/month. Please contact listing broker's office for full terms, bidder pre-registration form and property details.
-
2019-11-05status Pending 366-char remark
Show marketing remark (366 chars)
REAL ESTATE AUCTION ON SITE TUESDAY, NOVEMBER 5, 2019 AT 12:00 NOON. List price is suggested opening bid only. $2,500 cashier's check deposit required to bid. Home is 1 of 10 rental properties on block being auctioned same day. Currently rented for $700/month. Please contact listing broker's office for full terms, bidder pre-registration form and property details.
-
2019-09-27$10,000 Active 366-char remark
Show marketing remark (366 chars)
REAL ESTATE AUCTION ON SITE TUESDAY, NOVEMBER 5, 2019 AT 12:00 NOON. List price is suggested opening bid only. $2,500 cashier's check deposit required to bid. Home is 1 of 10 rental properties on block being auctioned same day. Currently rented for $700/month. Please contact listing broker's office for full terms, bidder pre-registration form and property details.
-
2002-07-21historical
-
2002-01-22
-
1996-07-19soldstatus $12,000
-
1988-02-09soldstatus $50,000
ⓘ Source: listings_history table (triggers on properties + properties_extension) + one-shot
backfill from property_details.listing_events for pre-trigger history.
Tax reassessment forecast MD · Partial reset (capped growth)
- Current annual tax
- $1,444 · $120/mo
- Projected year-2 tax
- $1,444 · $120/mo
- Expected delta
- $0/yr ($0/mo · 0.0%)
ⓘ Screening estimate from a state-policy table — verify with the county assessor before closing.
Climate risk First Street
- Flood 1/10 Low FEMA zone X (unshaded) · 0% chance over 30 yrs
- Wildfire 1/10 Low
- Heat 7/10 Severe 7 d/yr ≥103°F today · 15 d/yr by 30 yrs out
- Wind 6/10 Major 27% chance of damaging wind over 30 yrs
- Air quality 4/10 Moderate 6 unhealthy d/yr today · 7 by 30 yrs out
Nearby sold comps map
Loading sold comps map…
Walkable amenities ~0.75 mi
Loading nearby amenities…
Taxation est. · year 1
- Rental income
- $17,686
- − Mortgage interest
- −$2,241
- − Property taxes
- −$1,444
- − Insurance
- −$200
- − Repairs & maintenance
- −$1,415
- − Management
- −$1,415
- − Depreciation
- −$1,164
- Taxable income
- $9,808
- Est. tax owed @ 24.0%
- −$2,354
- After-tax cash flow
- $7,457/yr
For passive investors: Depreciation is non-cash, so a rental often shows a tax loss while cash-flowing — sheltering income. Rental losses are passive: they offset passive income freely, and up to $25,000/yr can offset ordinary (W-2) income if you actively participate and your MAGI is under $100k (phasing out to $0 by $150k); unused losses carry forward. On sale, claimed depreciation is recaptured at up to 25%, and gains may owe capital-gains tax (a 1031 exchange can defer both). Figures are a year-1 estimate at your 24.0% rate — not tax advice; consult a CPA.
Schools (NCES district)
- District
- Baltimore City Public Schools
- NCES district ID
- 2400090
- Math proficiency
- 7% ▼ -9.00%
- Reading proficiency
- 16% ▼ -5.00%
- Median HH income
- $42,108
- Composite
- 10.08/100
- National rank
- #9805
- State rank
- #24 of 24 in MD
Livability — Baltimore
- Score
- 76/100
- State rank
- #90
- US rank
- #3396
Category grades
Schools grade is shown separately in the Schools card above.
Census & demographics
- Census place
- Baltimore, MD
- County
- Baltimore City · 558,601 people
- City population
- 588,727
- Metro
- Baltimore-Columbia-Towson, MD
- Population (ZIP)
- 19,572
- Household income
- $45,840
- Rent vs Own
- Severe rent burden
- 1755.0
Population outlook (Baltimore County) Hauer SSP2
- Today (2025)
- 624,249 people
- By 2030
- 621,541 · -0.4%
- By 2040
- 609,756 · -2.3%
- By 2050
- 597,249 · -4.3%
- By 2075
- 552,236 · -11.5%
- By 2100
- 513,934 · -17.7%
Race, ethnicity, and origin ACS 2023
- Neighborhood character
- Predominantly Black (72%)
- Race & ethnicity
- Black 72% White 16% Hispanic / Latino 7% Two or more races 6% Asian 1%
- Hispanic origin (detail)
- Mexican 3% Puerto Rican 1%
- Common ancestry
- Romanian 1%
- Foreign-born
- 8% · Canada
- Languages at home
- 90% English-only · Spanish 6% French/Haitian/Cajun 2% Other Indo-European 1%
Political lean MEDSL · Baltimore
- 2024 margin
- Solid D (+73.0) · D 85.2% · R 12.2% · Other 2.6%
- 2008→2024 swing
- -2.5pp toward R · 2008: 75.5pp · 2024: 73.0pp
- All cycles
- 2024: D+73.0 2020: D+76.6 2016: D+74.6 2012: D+76.4 2008: D+75.5
Not yet ingested
- Civics
- —
Market trends
- HPI YoY
- ▼ -97.99%
- Current HPI
- 140.5836
- Rent YoY
- ▲ 7.51%
- Metro
- Baltimore-Columbia-Towson, MD
- State GDP YoY
- ▲ 2.97%
- F500 in state
- 12
Industry mix (Fortune 500 HQ in MD)
| Industry | F500 HQs | Revenue |
|---|---|---|
| Aerospace / Defense | 1 | $71B |
|
||
| Utilities | 1 | $25B |
|
||
| Hotels | 1 | $24B |
|
||
| Consumer Goods | 1 | $7B |
|
||
| Real Estate | 1 | $6B |
|
||
| Chemicals | 1 | $2B |
|
||
Price history
-20.0% since first listed13 events — show timeline
- 2026-04-30 Pending — BRIGHT MLS
- 2026-03-31 Price Changed $40,000 BRIGHT MLS
- 2026-02-26 Listed $49,900 BRIGHT MLS
- 2025-11-07 Sold (Public Records) $500,000 Public Records
- 2022-11-28 Rental Removed — RENT.
- 2020-01-27 Sold (Public Records) $212,000 Public Records
- 2019-12-31 Sold (MLS) $21,200 BRIGHT MLS
- 2019-11-05 Pending — BRIGHT MLS
- 2019-09-27 Listed $10,000 BRIGHT MLS
- 2002-07-21 Delisted — MRIS
- 2002-01-22 Listed — MRIS
- 1996-07-19 Sold (Public Records) $12,000 Public Records
- 1988-02-09 Sold (Public Records) $50,000 Public Records
Property tax history
-0.8%/yrLatest (2025): $1,444 · +4.7% YoY. Source: county tax records.
Cash-flow waterfall
monthlySold comps — $/sqft
last 12 mo · ≤1 miLoading sold comps…