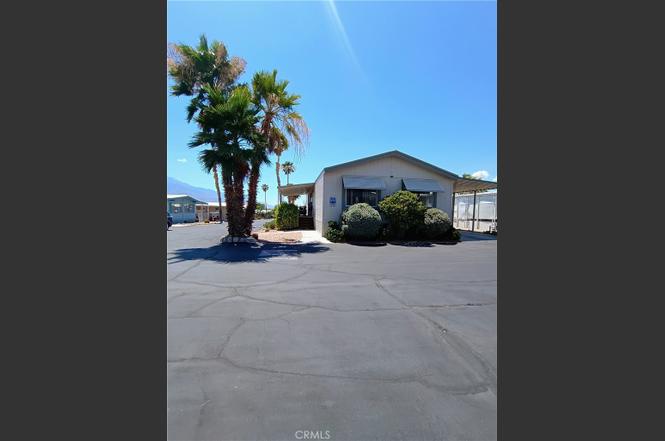
17640 Corkill #48 · Desert Edge, CA
Flood risk 1/10 · Minimal
- FEMA flood zone
- X (unshaded)
- Chance of flooding over 30 yrs
- 0.0%
- Est. flood insurance / yr
- $507 – $1,088
Fire risk 5/10 · Moderate
- Est. fire insurance / yr
- $659 – $1,223
Heat risk 8/10 · Major
- Hot days now (above 109°F)
- 4 days/yr
- Hot days in 30 yrs
- 10 days/yr
Wind risk 1/10 · Minimal
- Chance of severe wind over 30 yrs
- —
Air-quality risk 5/10 · Moderate
- Unhealthy air days now
- 6 days/yr
- Unhealthy air days in 30 yrs
- 8 days/yr
Risk factors via First Street. Map © Google.
Why this score? — see what drove the B+ grade
The composite is a weighted blend of 9 inputs, each scored 0–100. Each bar is that input's sub-score; the figure is the points it added to the 100-point composite (weight × sub-score).
- Cash flow +30.0/30.0
- ARV discount +15.0/15.0
- 1% rule +10.0/10.0
- DSCR +10.0/10.0
- Livability +3.4/5.0
- Schools +2.7/10.0
- Rent growth +2.5/5.0
- Condition / age +2.5/5.0
- Appreciation +0.0/10.0
$89,999
🖨 Deal sheet (PDF) 📄 Offer letter ✓ Due diligence
Listing remarks
Corkill Palms is an 55+ active community that offers therapeutic Hot Mineral Water Pool & Spa! Beautiful 3BD/2BA home on a corner lot with stunning mountain views from your front porch. This home offer a open floor plan, spacious living room, dining room, primary suite, large closets in each bdrm, & a separate laundry room w/ a washer & dryer. A galley kitchen w/ a large 3 door updated refrigerator & new dishwasher. An abundant amount of cabinet space thru out the home. Recent updates include a tiled guest bath w/ updated vanity & an upgraded walk-in shower in the primary bath. A large shed also! The park has a large clubhouse, billiards room, reading/ TV area.
Key facts
- Open floor plan
- Primary suite
- Dining room
Tags
Property features AI
Finance
- Other: Community located in a valley; Paved road access; Directions: East on Dillon Rd. to Corkill Rd, south to Corkill Palms, east side on St one block down
- Financial info: Monthly land lease: $510.72 (seller-provided)
- HOA & community: Community amenities: clubhouse, pool, card room, billiard room, barbecue/outdoor cooking area; Senior community; Park name: Corkill Palms; Manager approval required; Pets: contact management
Exterior
- Parking: Covered carport (2 spaces)
- Security: Gated community with automatic gate; Smoke detector(s); Carbon monoxide detector(s)
- Utilities: Public/district water; Community septic
- Home design: Mobile home (24' x 56') remains on site; Double body type; One story; Corner lot; Has view
- Construction: Assessor-provided year built information
- Exterior features: Covered porch; Awning; Covered patio; In-ground community heated pool; Shed (one)
Interior
- Kitchen: Gas range; Dishwasher; Microwave; Garbage disposal; Refrigerator
- Bedrooms: Single-story layout (entry level 1)
- Flooring: Vinyl flooring; Carpet
- Bathrooms: Two full bathrooms; Upgraded finishes; Walk-in shower; Linen closet/storage
- Heating & cooling: Central cooling; Central furnace heating
- Interior features: Open floor plan; Cathedral/vaulted ceilings; Furnished or unfurnished options; Turnkey condition; South-facing entry
- Laundry & utility: Dedicated laundry room; Washer included; Dryer included
Neighborhood map
What this means for you Summary
Snapshot
- This is a 3-bed/2.0-bath manufactured listed at $90k.
Deal economics
- At list price, monthly cash flow is $924 ($11k/yr) — positive.
- The deal already cash-flows at list — no discount required.
- Meets the 1% rule at list price ($2k rent vs $90k).
- Cap rate 18.6% vs local median 14.6% in Desert Edge — meaningfully above typical; check what's discounted (condition, days-on-market, listing class) to confirm the premium yield is real.
Location & tenants
- Location reads 68/100 on livability (#297 in CA) — a middle-class / working-renter tenant base. Strengths: cost of living A+, housing A+; Watch: crime C-, commute D-, employment F.
- Palm Springs Unified (suburban): math 21% / reading 42% proficiency, ranked #328 of 517 in CA (top 63%) — families likely to look elsewhere, expect single-tenant / working-renter base with shorter leases; 73% free/reduced lunch — lower-income household profile, screen leases tightly.
- Zoned schools: Julius Corsini Elementary (409 students, 98% FRL); Desert Springs Middle (803 students, 99% FRL); Desert Hot Springs High (math 27% / reading 52%, grade F, #532 of 1,170 statewide, top 48%, 1,742 students, 98% FRL) — zoned schools average 98% FRL vs 73% district-wide (25 pts higher); higher-poverty schools than district average — tighter screening recommended.
- Market conditions: 218 active listings in the ZIP; 3 comparable units currently listed for rent nearby; rentals at typical pace (median 26d on market — plan ~3-4 weeks tenant-placement turnaround); 9,195 units permitted in Riverside County in 2024 (1,512 in 5+ unit buildings).
Forward outlook
- Local home prices are declining (-3.0%/yr); year-one equity from $622 of loan paydown is wiped out by about $3k of value loss. Plan a longer hold.
- Riverside County population projected at +22% by 2050 — long-run rental-demand tailwind backs the buy-and-hold thesis.
- At projected returns (-3.0% appreciation + 3.0% rent growth), your $25k cash investment doubles in ~3 years — after that, you're playing with house money.
Negotiation context
- Only 5 days on market — expect competitive offers; lowballing is unlikely to land.
Risks & watch-outs
- Climate carrying-cost: moderate wildfire risk; extreme-heat days projected 4→10/yr by 2055 (HVAC capex compounding) — expect insurance premiums to compound above CPI over the hold.
Questions for the listing agent
- Is there a deadline driving the sale (1031 exchange, divorce, estate, relocation)? That informs how much negotiation room exists.
- Schools are F-rated, which usually means shorter tenancies and higher turnover. Who's the typical renter profile here, and what's been the actual vacancy rate?
- What's the average days-on-market for RENTAL listings here right now (not sales)? A rising rental-DOM trend means longer vacancies and softer asking-rent achievability than the comps imply.
- What's the recent tenant-quality profile in this submarket — average credit score on applications, eviction rate, late-payment / NSF rate, and stable-employment percentage? A property-management company in the area should have these aggregated.
- How much new for-sale + rental construction is in the pipeline within 1–3 miles? Heavy new supply typically softens prices + rents 12–24 months out; constrained supply supports both.
Investment metrics
- 1% rule
- 2.06% ✓
- Cap rate
- 18.61%
- Cash-on-cash
- 44.00%
- DSCR
- 2.96
- GRM
- 4.1
CMA / ARV
- ARV (on-the-fly)
- $108,732
- Comps found
- 12
Show comp detail 12 sales within ~0.75 mi
| Address | Dist | Beds/Ba | Sqft | Sold | Price | $/sf | Match |
|---|---|---|---|---|---|---|---|
| 17555 Corkill Rd | 0.13mi | 2/2.0 (-1) | 1,344 (-4%) | 7mo | $105,000 | $78 | 77 |
| 17640 Corkill Rd #27 | 0.00mi | 3/2.0 | 1,248 (-10%) | 7mo | $60,000 | $48 | 77 |
| 17640 Corkill #78 Rd | 0.00mi | 2/2.0 (-1) | 1,248 (-10%) | 1mo | $69,999 | $56 | 76 |
| 17625 Langlois Rd Spc 13 | 0.33mi | 2/2.0 (-1) | 1,344 (-4%) | 0mo | $65,000 | $48 | 73 |
| 17640 Corkill Rd #46 | 0.00mi | 3/2.0 | 1,200 (-14%) | 8mo | $58,000 | $48 | 70 |
| 17800 Langlois Rd #218 | 0.50mi | 2/2.0 (-1) | 1,440 (+3%) | 2mo | $50,000 | $35 | 64 |
| 17640 Corkill Rd #22 | 0.00mi | 2/2.0 (-1) | 1,200 (-14%) | 12mo | $65,000 | $54 | 62 |
| 16821 Lakeside Ct | 0.73mi | 3/2.0 | 1,368 (-2%) | 5mo | $170,000 | $124 | 58 |
| 69525 Dillon Rd #88 | 0.50mi | 3/2.0 | 1,248 (-10%) | 6mo | $180,000 | $144 | 54 |
| 16411 Vista Cerro | 0.73mi | 2/2.0 (-1) | 1,430 (+3%) | 6mo | $195,000 | $136 | 51 |
| 18070 Langlois #206 | 0.59mi | 2/2.0 (-1) | 1,250 (-10%) | 2mo | $185,000 | $148 | 49 |
| 16725 Camino Mirasol Dr | 0.70mi | 2/2.0 (-1) | 1,248 (-10%) | 8mo | $165,000 | $132 | 38 |
Match score weights: distance 35% · size 25% · config 20% · recency 20%. Top-matched comps best support the ARV.
Projected returns pro-forma
-3.0% appreciation · 3.0% rent growth · sell at horizon
- IRR
- 40.9%
- Equity multiple
- 2.76×
- Total profit
- $44,239
- Equity at exit
- $13,419
- IRR
- 47.2%
- Equity multiple
- 5.53×
- Total profit
- $114,199
- Equity at exit
- $7,781
Cash invested: $25,200 (down + closing). Projections, not guarantees.
Landlord ↔ Tenant lean methodology
- Overall (STATE)
- 18 Strongly Tenant-Friendly
- State California
- 18 Strongly Tenant-Friendly · D+13
- County
- — inherits STATE
- City
- — inherits STATE
ZIP-level market 92241
- Home prices YoY
- -22.8%
- Active inventory
- 218
- Price-to-rent
- 4.1×
Monthly cashflow live
- Estimated rent
- $1,850 medium interval (Pro) →
- Mortgage (P&I)
- −$472
- Tax from tax record
- −$28 /mo · $337/yr
- Insurance
- −$37
- HOA
- −$0
- Vacancy / Maint / Mgmt
- −$388
- Net cashflow
- $924
Break-even live
Sensitivity live
| Price | -10% $975 | -5% $949 | +0% $924 | +5% $898 | +10% $873 |
|---|---|---|---|---|---|
| Rent | -10% $778 | -5% $851 | +0% $924 | +5% $997 | +10% $1,070 |
| Rate | -1.0pp $969 | -0.5pp $947 | base $924 | +0.5pp $901 | +1.0pp $877 |
UW: 25.0% down · 7.5% · 30yr · 1.5% tax · 5.0% vac · 8.0% maint · 8.0% mgmt
Financing live
Cash to close
- Down payment
- $22,500
- Closing costs
- $2,700
- Reserves months
- —
- Total cash needed
- —
Loan-product check · same deal, 3 products live
Conventional
25% down · 7.5% · 30yr
- Down + closing
- —
- Monthly P&I
- —
- Monthly cashflow
- —
- DSCR
- —
- Eligible?
- —
Personal DTI + credit; lowest rate.
DSCR
20% down · 8.5% · 30yr
- Down + closing
- —
- Monthly P&I
- —
- Monthly cashflow
- —
- DSCR
- —
- Eligible?
- —
No personal income docs; deal must DSCR.
Hard money
10% down · 12.0% · 12mo
- Down + closing
- —
- Monthly P&I
- —
- Monthly cashflow
- —
- DSCR
- —
- Eligible?
- —
Short-term bridge; refi at stabilization.
Rent comps 3 comps
| Address | Beds | Baths | Sqft | Rent | $/sqft | DOM | Units | Dist |
|---|---|---|---|---|---|---|---|---|
| 18070 Langlois Rd Dsrt Hot Spgs, CA | 2.0 | 2.0 | 950 | $1,850 | $1.95 | 26d | 1 | 0.59mi |
| 18070 Langlois Rd Dsrt Hot Spgs, CA | 2.0 | 2.0 | 950 | $1,850 | $1.95 | 1d | 1 | 0.59mi |
| 18070 Langlois Rd #257 Desert Hot Springs, CA | 2.0 | 2.0 | 1056 | $1,850 | $1.75 | 45d | 1 | 0.59mi |
Listing history 4 events
-
2026-06-21days on market $89,999 Active 5 DOM
-
2026-06-18days on market $89,999 Active 2 DOM
-
2026-06-17remarks 679-char remark
-
2026-06-17$89,999 Active 1 DOM
ⓘ Source: listings_history table (triggers on properties + properties_extension) + one-shot
backfill from property_details.listing_events for pre-trigger history.
Tax reassessment forecast CA · Resets to sale price
- Current annual tax
- $337 · $28/mo
- Projected year-2 tax
- $684 · $57/mo
- Expected delta
- +$347/yr (+$29/mo · 102.9%)
ⓘ Screening estimate from a state-policy table — verify with the county assessor before closing.
Climate risk First Street
- Flood 1/10 Low FEMA zone X (unshaded) · 0% chance over 30 yrs
- Wildfire 5/10 Major
- Heat 8/10 Severe 4 d/yr ≥109°F today · 10 d/yr by 30 yrs out
- Wind 1/10 Low
- Air quality 5/10 Major 6 unhealthy d/yr today · 8 by 30 yrs out
Nearby sold comps map
Loading sold comps map…
Walkable amenities ~0.75 mi
Loading nearby amenities…
Taxation est. · year 1
- Rental income
- $22,200
- − Mortgage interest
- −$5,041
- − Property taxes
- −$337
- − Insurance
- −$450
- − Repairs & maintenance
- −$1,776
- − Management
- −$1,776
- − Depreciation
- −$2,618
- Taxable income
- $10,201
- Est. tax owed @ 24.0%
- −$2,448
- After-tax cash flow
- $8,639/yr
For passive investors: Depreciation is non-cash, so a rental often shows a tax loss while cash-flowing — sheltering income. Rental losses are passive: they offset passive income freely, and up to $25,000/yr can offset ordinary (W-2) income if you actively participate and your MAGI is under $100k (phasing out to $0 by $150k); unused losses carry forward. On sale, claimed depreciation is recaptured at up to 25%, and gains may owe capital-gains tax (a 1031 exchange can defer both). Figures are a year-1 estimate at your 24.0% rate — not tax advice; consult a CPA.
Schools (NCES district)
- District
- Palm Springs Unified
- NCES district ID
- 0629550
- Math proficiency
- 21% ▼ -7.00%
- Reading proficiency
- 42% ▬ 0.00%
- Median HH income
- $43,638
- Composite
- 26.76/100
- National rank
- #7131
- State rank
- #328 of 517 in CA
Livability — Desert Edge
- Score
- 68/100
- State rank
- #297
- US rank
- #9953
Category grades
Schools grade is shown separately in the Schools card above.
Census & demographics
- Census place
- Desert Edge, CA
- Population (ZIP)
- 8,624
Population outlook (Riverside County) Hauer SSP2
- Today (2025)
- 2,664,475 people
- By 2030
- 2,802,692 · +5.2%
- By 2040
- 3,050,904 · +14.5%
- By 2050
- 3,256,783 · +22.2%
- By 2075
- 3,655,058 · +37.2%
- By 2100
- 3,766,594 · +41.4%
Race, ethnicity, and origin ACS 2023
- Race & ethnicity
- White 50% Hispanic / Latino 46% Two or more races 16% Asian 2% Native American 1%
- Hispanic origin (detail)
- Mexican 36%
- Common ancestry
- Lithuanian 3% Slovak 2% Portuguese 2%
- Foreign-born
- 28% · Canada, South Korea
- Languages at home
- 57% English-only · Spanish 38% Chinese 1% Russian/Polish/Slavic 1%
Political lean MEDSL · Riverside
- 2024 margin
- Toss-up / Even · D 48.0% · R 49.3% · Other 2.6%
- 2008→2024 swing
- -3.6pp toward R · 2008: 2.3pp · 2024: -1.3pp
- All cycles
- 2024: R+1.3 2020: D+8.0 2016: D+4.3 2012: R+0.4 2008: D+2.3
Not yet ingested
- Civics
- —
Market trends
- HPI YoY
- ▼ -118.23%
- Current HPI
- 400.5663
- Rent YoY
- —
- Metro
- —
- State GDP YoY
- ▲ 3.21%
- F500 in state
- 116
Industry mix (Fortune 500 HQ in CA)
| Industry | F500 HQs | Revenue |
|---|---|---|
| Technology | 27 | $1,492B |
|
||
| Financial Services | 3 | $174B |
|
||
| Retail | 3 | $44B |
|
||
| Insurance | 3 | $26B |
|
||
| Media / Entertainment | 2 | $115B |
|
||
| Pharmaceuticals / Biotech | 2 | $62B |
|
||
Price history
1 event — show timeline
- 2026-06-16 Listed $89,999 CRMLS
Property tax history
-1.3%/yrLatest (2025): $337 · -2.1% YoY. Source: county tax records.
Cash-flow waterfall
monthlySold comps — $/sqft
last 12 mo · ≤1 miLoading sold comps…