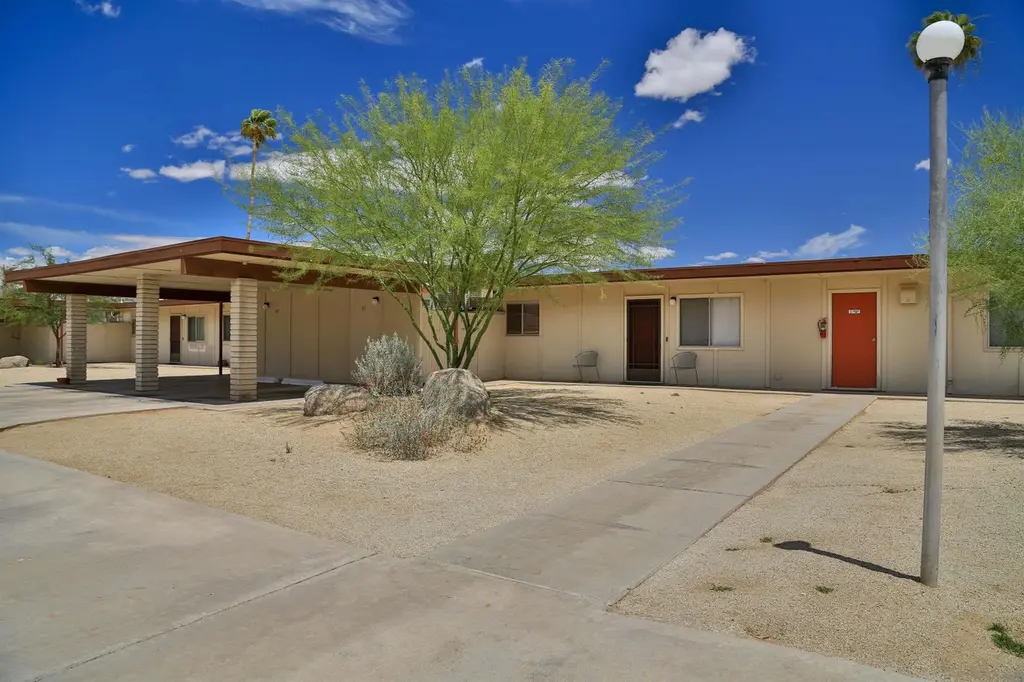
3158 Circle E #51 · Borrego Springs, CA
Flood risk 1/10 · Minimal
- FEMA flood zone
- AO
- Chance of flooding over 30 yrs
- 0.0%
- Est. flood insurance / yr
- $848 – $2,087
Fire risk 3/10 · Minor
- Est. fire insurance / yr
- $659 – $1,223
Heat risk 9/10 · Severe
- Hot days now (above 111°F)
- 8 days/yr
- Hot days in 30 yrs
- 24 days/yr
Wind risk 1/10 · Minimal
- Chance of severe wind over 30 yrs
- —
Air-quality risk 4/10 · Minor
- Unhealthy air days now
- 4 days/yr
- Unhealthy air days in 30 yrs
- 5 days/yr
Risk factors via First Street. Map © Google.
Why this score? — see what drove the C+ grade
The composite is a weighted blend of 9 inputs, each scored 0–100. Each bar is that input's sub-score; the figure is the points it added to the 100-point composite (weight × sub-score).
- Cash flow +23.5/30.0
- 1% rule +10.0/10.0
- ARV discount +9.2/15.0
- DSCR +7.5/10.0
- Livability +2.9/5.0
- Schools +2.6/10.0
- Rent growth +2.5/5.0
- Condition / age +2.2/5.0
- Appreciation +0.0/10.0
$135,000
🖨 Deal sheet 📄 Offer letter ✓ Due diligence
Listing remarks
Well maintained Club Circle condo close to the Borrego Springs resort and 5 minutes from town. Enjoy the serenity of the desert at a very affordable price. This is a great place to stage your desert adventures or to use as a short term rental. Offered fully furnished.
Key facts
- $550 HOA
- Parking
- Community pool
Property features AI
Finance
- Other: Building name: Club Circle East; Subdivision: Borrego Springs
- HOA & community: Homeowners association with monthly fee of $550; HOA covers grounds and structure maintenance; Community amenities include pool and tennis courts
Exterior
- Parking: 1 parking space
- Utilities: Sewer connected
- Home design: Residential condominium; Single-story; Entry level: 1; No one above or below (no common walls vertically)
- Construction: Flat roof
- Exterior features: Covered porch with awning(s); Community pool; Tennis courts; Sidewalks; Cul-de-sac lot setting; Has a view
Interior
- Kitchen: Includes refrigerator, range, and oven
- Bedrooms: Space for 2 bedrooms
- Flooring: Carpet; Tile
- Bathrooms: 1 full bathroom
- Heating & cooling: Central air conditioning; Forced air heating (electric)
- Interior features: Refrigerator; Range; Oven; Electric water heater; Carpet flooring; Tile flooring
- Laundry & utility: Common area laundry
Neighborhood map
What this means for you Summary
Snapshot
- This is a 2-bed/1.0-bath condo listed at $135k. Condition is rated fair.
Deal economics
- At list price, monthly cash flow is $129 ($2k/yr) — positive.
- The deal already cash-flows at list — no discount required.
- Meets the 1% rule at list price ($2k rent vs $135k).
- Recommended offer: $131k (3.0% below list) — sets the bar for market timing.
- Cap rate 8.5% vs local median 6.0% in Borrego Springs — top-decile yield for the area; either an underpriced asset or a hidden risk that comps aren't pricing in. Stress-test before assuming the spread holds.
Location & tenants
- Location reads 58/100 on livability (#712 in CA) — a working-class tenant base; expect higher turnover. Strengths: crime A+, employment A+, housing A+; Watch: schools F, amenities F, commute F.
- Borrego Springs Unified (rural): math 20% / reading 35% proficiency, ranked #1,120 of 1,400 in CA (top 80%) — low school quality limits family demand, transient renter base, plan for 1-2y turnover; 72% free/reduced lunch — lower-income household profile, screen leases tightly.
- Market conditions: 174 active listings in the ZIP; 11,759 units permitted in San Diego County in 2024 (7,244 in 5+ unit buildings).
Forward outlook
- Local home prices are declining (-3.0%/yr); year-one equity from $933 of loan paydown is wiped out by about $4k of value loss. Plan a longer hold.
- San Diego County population projected at +20% by 2050 — long-run rental-demand tailwind backs the buy-and-hold thesis.
Negotiation context
- It's been on market 35 days — a 3% lower offer ($131k) is reasonable based on typical stale-listing flexibility.
Risks & watch-outs
- Watch-outs: flood insurance adds $122/mo; HOA is 25% of rent.
- Climate carrying-cost: in FEMA flood zone AO (mandatory federal flood insurance); extreme-heat days projected 8→24/yr by 2055 (HVAC capex compounding) — expect insurance premiums to compound above CPI over the hold.
Questions for the listing agent
- It's been on market 35 days. Have you received any prior offers? Is the seller open to a 3% concession, seller financing, or rate buy-down credit?
- Have any recent inspections been done? Can we get a copy of the seller's disclosures and any deferred-maintenance estimates?
- Built in 1965 — when were the roof, HVAC, electrical panel, plumbing, and water heater last replaced?
- What's the actual annual flood-insurance premium (NFIP or private), and is the property in a SFHA with mandatory coverage?
- What does the HOA fee cover, when was the last increase, and are there any pending special assessments or reserve-fund shortfalls?
- Any open or pending special assessments — roof, HVAC, plumbing, elevator, façade? What's the per-unit balance and payoff schedule, and is the seller paying it off at close or rolling it to the buyer?
- Is there a deadline driving the sale (1031 exchange, divorce, estate, relocation)? That informs how much negotiation room exists.
- Schools are F-rated, which usually means shorter tenancies and higher turnover. Who's the typical renter profile here, and what's been the actual vacancy rate?
- What's the average days-on-market for RENTAL listings here right now (not sales)? A rising rental-DOM trend means longer vacancies and softer asking-rent achievability than the comps imply.
- What's the recent tenant-quality profile in this submarket — average credit score on applications, eviction rate, late-payment / NSF rate, and stable-employment percentage? A property-management company in the area should have these aggregated.
- How much new apartment / multifamily construction is in the pipeline within 1–3 miles? Heavy new supply (>2% of stock underway) typically softens rents 12–24 months out; light construction supports rent growth.
Investment metrics
- 1% rule
- 1.63% ✓
- Cap rate
- 8.52%
- Cash-on-cash
- 7.96%
- DSCR
- 1.35
- GRM
- 5.1
CMA / ARV
- ARV (median comp)
- $140,218
- List price
- $135,000
- Delta
- -3.72%
- Verdict
- FAIR
- Comps
- 17 within 1.0 mi
Projected returns pro-forma
-3.0% appreciation · 3.0% rent growth · sell at horizon
- IRR
- -9.5%
- Equity multiple
- 0.65×
- Total profit
- $-13,239
- Equity at exit
- $20,129
- IRR
- 0.3%
- Equity multiple
- 1.02×
- Total profit
- $831
- Equity at exit
- $11,672
Cash invested: $37,800 (down + closing). Projections, not guarantees.
Landlord ↔ Tenant lean methodology
- Overall (STATE)
- 18 Strongly Tenant-Friendly
- State California
- 18 Strongly Tenant-Friendly · D+13
- County
- — inherits STATE
- City
- — inherits STATE
ZIP-level market 92004
- Home prices YoY
- -18.4%
- Active inventory
- 174
- Price-to-rent
- 5.1×
Monthly cashflow live
- Estimated rent
- $2,195 medium interval (Pro) →
- Mortgage (P&I)
- −$708
- Tax est. 1.5%
- −$169 /mo · $2,025/yr
- Insurance
- −$56
- Flood insurance flood zone
- −$122 /mo · $1,468/yr
- HOA
- −$550
- Vacancy / Maint / Mgmt
- −$461
- Net cashflow
- $129
Break-even live
UW: 25.0% down · 7.5% · 30yr · 1.5% tax · 5.0% vac · 8.0% maint · 8.0% mgmt
Financing live
Cash to close
- Down payment
- $33,750
- Closing costs
- $4,050
- Reserves months
- —
- Total cash needed
- —
Loan-product check · same deal, 3 products live
Conventional
25% down · 7.5% · 30yr
- Down + closing
- —
- Monthly P&I
- —
- Monthly cashflow
- —
- DSCR
- —
- Eligible?
- —
Personal DTI + credit; lowest rate.
DSCR
20% down · 8.5% · 30yr
- Down + closing
- —
- Monthly P&I
- —
- Monthly cashflow
- —
- DSCR
- —
- Eligible?
- —
No personal income docs; deal must DSCR.
Hard money
10% down · 12.0% · 12mo
- Down + closing
- —
- Monthly P&I
- —
- Monthly cashflow
- —
- DSCR
- —
- Eligible?
- —
Short-term bridge; refi at stabilization.
HOA detail condo
- Monthly dues
- $550 · $6,600/yr
- Assessments
- None detected in remarks — confirm with the listing agent.
Listing history 10 events
-
2026-06-09days on market $135,000 Active 35 DOM
-
2026-06-08days on market $135,000 Active 34 DOM
-
2026-06-07days on market $135,000 Active 33 DOM
-
2026-06-07days on market $135,000 Active 32 DOM
-
2026-06-04days on market $135,000 Active 29 DOM
-
2026-06-02days on market $135,000 Active 28 DOM
-
2026-06-01days on market $135,000 Active 27 DOM
-
2026-05-31days on market $135,000 Active 26 DOM
-
2026-05-31days on market $135,000 Active 25 DOM
-
2026-05-05$135,000 Active 268-char remark
ⓘ Source: listings_history table (triggers on properties + properties_extension) + one-shot
backfill from property_details.listing_events for pre-trigger history.
Climate risk First Street
- Flood 1/10 Low FEMA zone AO · 0% chance over 30 yrs
- Wildfire 3/10 Moderate
- Heat 9/10 Extreme 8 d/yr ≥111°F today · 24 d/yr by 30 yrs out
- Wind 1/10 Low
- Air quality 4/10 Moderate 4 unhealthy d/yr today · 5 by 30 yrs out
Nearby sold comps map
Loading sold comps map…
Walkable amenities ~0.75 mi
Loading nearby amenities…
Taxation est. · year 1
- Rental income
- $26,337
- − Mortgage interest
- −$7,562
- − Property taxes
- −$2,025
- − Insurance
- −$2,142
- − Repairs & maintenance
- −$2,107
- − Management
- −$2,107
- − HOA
- −$6,600
- − Depreciation
- −$3,927
- Taxable loss
- −$134
- Est. tax savings @ 24.0%
- +$32
- After-tax cash flow
- $1,575/yr
For passive investors: Depreciation is non-cash, so a rental often shows a tax loss while cash-flowing — sheltering income. Rental losses are passive: they offset passive income freely, and up to $25,000/yr can offset ordinary (W-2) income if you actively participate and your MAGI is under $100k (phasing out to $0 by $150k); unused losses carry forward. On sale, claimed depreciation is recaptured at up to 25%, and gains may owe capital-gains tax (a 1031 exchange can defer both). Figures are a year-1 estimate at your 24.0% rate — not tax advice; consult a CPA.
Condition & rehab AI · 2 photos
This well-maintained condo is in fair condition with some cosmetic improvements needed, such as landscaping and driveway repair, to enhance its resale and rental value.
Repairs flagged
- Major Driveway — The driveway is cracked and in poor condition.
- Minor Landscaping — The landscaping is sparse and could be improved with some additional plants and shrubs.
Value-add opportunities
- Both Landscaping — Improved landscaping would enhance both the resale and rental value by making the property more attractive.
- Both Driveway repair — Repairing the cracked driveway would improve the property's curb appeal and make it more presentable for potential buyers or renters.
Renovation cost estimate screening
| Repair item | Severity | Est. cost |
|---|---|---|
| Driveway · The driveway is cracked and in poor condition. | Major | $15,000–50,000 |
| Landscaping · The landscaping is sparse and could be improved with some additional plants and shrubs. | Minor | $500–3,000 |
| Total estimated repair cost · 2 items | $15,500–53,000 |
Value-add ROI direction
- Both Landscaping — Improved landscaping would enhance both the resale and rental value by making the property more attractive. ↑
- Both Driveway repair — Repairing the cracked driveway would improve the property's curb appeal and make it more presentable for potential buyers or renters. ↑
ⓘ Cost ranges are severity-bucket heuristics (US national rule-of-thumb). Get contractor quotes + a written scope before underwriting a rehab budget.
Schools (NCES district)
- District
- Borrego Springs Unified
- NCES district ID
- 0605700
- Math proficiency
- 20% ▼ -6.00%
- Reading proficiency
- 35% ▼ -6.00%
- Median HH income
- $42,330
- Composite
- 26.31/100
- National rank
- #12684
- State rank
- #1120 of 1400 in CA
Livability — Borrego Springs
- Score
- 58/100
- State rank
- #712
- US rank
- #21334
Category grades
Schools grade is shown separately in the Schools card above.
Census & demographics
- Census place
- Borrego Springs, CA
- Population (ZIP)
- 3,030
Population outlook (San Diego County) Hauer SSP2
- Today (2025)
- 3,678,185 people
- By 2030
- 3,856,546 · +4.8%
- By 2040
- 4,171,407 · +13.4%
- By 2050
- 4,421,607 · +20.2%
- By 2075
- 4,831,599 · +31.4%
- By 2100
- 4,832,502 · +31.4%
Race, ethnicity, and origin ACS 2023
- Neighborhood character
- Predominantly White (66%)
- Race & ethnicity
- White 66% Hispanic / Latino 33% Two or more races 24%
- Hispanic origin (detail)
- Mexican 29%
- Common ancestry
- Lithuanian 10% Slovak 5% Scotch-Irish 1%
- Foreign-born
- 27% · Canada
- Languages at home
- 70% English-only · Spanish 30%
Political lean MEDSL · San Diego
- 2024 margin
- D (+16.8) · D 56.9% · R 40.1% · Other 2.9%
- 2008→2024 swing
- +6.6pp toward D · 2008: 10.2pp · 2024: 16.8pp
- All cycles
- 2024: D+16.8 2020: D+22.8 2016: D+17.8 2012: D+5.1 2008: D+10.2
Not yet ingested
- Civics
- —
Market trends
- HPI YoY
- ▼ -50.39%
- Current HPI
- 222.8196
- Rent YoY
- —
- Metro
- —
- State GDP YoY
- ▲ 3.21%
- F500 in state
- 116
Industry mix (Fortune 500 HQ in CA)
| Industry | F500 HQs | Revenue |
|---|---|---|
| Technology | 27 | $1,492B |
|
||
| Financial Services | 3 | $174B |
|
||
| Retail | 3 | $44B |
|
||
| Insurance | 3 | $26B |
|
||
| Media / Entertainment | 2 | $115B |
|
||
| Pharmaceuticals / Biotech | 2 | $62B |
|
||
Cash-flow waterfall
monthlySold comps — $/sqft
last 12 mo · ≤1 miLoading sold comps…