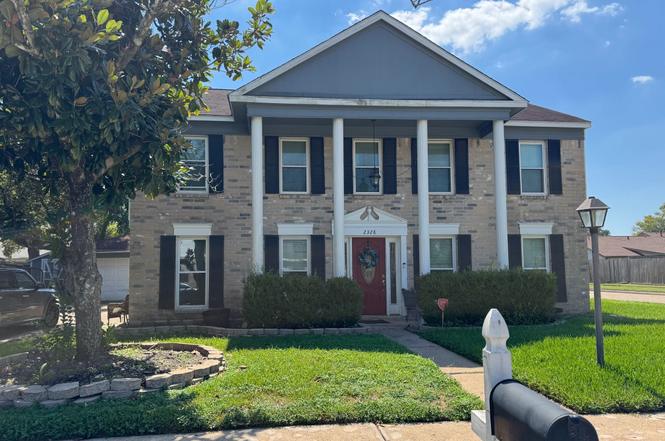
2328 Colleen Dr · Pearland, TX
Flood risk 3/10 · Minor
- FEMA flood zone
- X (unshaded)
- Chance of flooding over 30 yrs
- 0.1%
- Est. flood insurance / yr
- $507 – $1,088
Fire risk 2/10 · Minimal
- Est. fire insurance / yr
- $1,222 – $2,270
Heat risk 9/10 · Severe
- Hot days now (above 108°F)
- 7 days/yr
- Hot days in 30 yrs
- 24 days/yr
Wind risk 9/10 · Severe
- Chance of severe wind over 30 yrs
- 99.0%
Air-quality risk 2/10 · Minimal
- Unhealthy air days now
- 1 days/yr
- Unhealthy air days in 30 yrs
- 1 days/yr
Risk factors via First Street. Map © Google.
Why this score? — see what drove the C+ grade
The composite is a weighted blend of 9 inputs, each scored 0–100. Each bar is that input's sub-score; the figure is the points it added to the 100-point composite (weight × sub-score).
- Cash flow +25.7/30.0
- DSCR +8.6/10.0
- ARV discount +7.5/15.0
- 1% rule +6.8/10.0
- Schools +5.4/10.0
- Livability +4.0/5.0
- Rent growth +3.2/5.0
- Condition / age +2.5/5.0
- Appreciation +0.0/10.0
$168,000
🖨 Deal sheet 📄 Offer letter ✓ Due diligence
Listing remarks
Prime value-add opportunity for seasoned investors and rehab professionals. This property is a full renovation project with substantial upside potential. Scope of work includes new roof on both house and garage, siding replacement in multiple areas, possible foundation leveling, full kitchen overhaul, slab floor repairs, and complete plumbing and electrical updates to current code. Interior requires drywall and texture repairs throughout, full bathroom rebuilds, and fresh interior and exterior paint. Ideal for investors seeking strong ARV potential through a comprehensive rehab. Bring your vision and capitalize on this heavy-value-add opportunity.
Key facts
- Foundation leveling
- Slab floor repairs
- New roof
Tags
Neighborhood map
What this means for you Summary
Snapshot
- This is a 3-bed/2.5-bath single-family listed at $168k.
Deal economics
- At list price, monthly cash flow is $404 ($5k/yr) — positive.
- The deal already cash-flows at list — no discount required.
- Meets the 1% rule at list price ($2k rent vs $168k).
- Recommended offer: $165k (1.5% below list) — sets the bar for market timing.
- Cap rate 9.2% vs local median 3.0% in Pearland — top-decile yield for the area; either an underpriced asset or a hidden risk that comps aren't pricing in. Stress-test before assuming the spread holds.
Location & tenants
- Location reads 81/100 on livability (#32 in TX, #1,539 nationally) — a professional / high-income tenant draw. Strengths: employment A+, housing A+, crime A; Watch: amenities D-, commute F.
- Pearland ISD (suburban): math 58% / reading 59% proficiency, ranked #47 of 826 in TX (top 6%) — acceptable for families but not a draw, mixed tenant base, ~2y average lease.
- Zoned schools: Shadycrest El (math 68% / reading 58%, grade B, #300 of 4,322 statewide, top 7%, 595 students, 25% FRL); Pearland J H East (math 61% / reading 62%, grade B+, #141 of 1,662 statewide, top 9%, 848 students, 34% FRL); Pearland H S (math 58% / reading 64%, grade C+, #258 of 1,632 statewide, top 16%, 3,261 students, 36% FRL).
- Market conditions: Rents rising (+2.9%/yr); 316 active listings in the ZIP; 1 comparable units currently listed for rent nearby; high-income renter base; 3,960 units permitted in Brazoria County in 2024 (593 in 5+ unit buildings).
Forward outlook
- Local home prices are declining (-3.0%/yr); year-one equity from $1k of loan paydown is wiped out by about $5k of value loss. Plan a longer hold.
- Brazoria County population projected at +44% by 2050 — long-run rental-demand tailwind backs the buy-and-hold thesis.
Negotiation context
- It's been on market 16 days — a 2% lower offer ($165k) is reasonable based on typical stale-listing flexibility.
- 8 sale attempts since 17y ago with the ask held roughly flat each time — persistent listings suggest the price (not the market) is what's stuck; bring a comps-based counter.
Risks & watch-outs
- Climate carrying-cost: severe wind risk, 99% chance of damaging wind over 30y; extreme-heat days projected 7→24/yr by 2055 (HVAC capex compounding) — expect insurance premiums to compound above CPI over the hold.
Questions for the listing agent
- Is there a deadline driving the sale (1031 exchange, divorce, estate, relocation)? That informs how much negotiation room exists.
- Schools are A-rated — typically a magnet for longer-tenancy family renters. What's the average tenant stay here, and is there a school-zone premium baked into asking?
- What's the average days-on-market for RENTAL listings here right now (not sales)? A rising rental-DOM trend means longer vacancies and softer asking-rent achievability than the comps imply.
- What's the recent tenant-quality profile in this submarket — average credit score on applications, eviction rate, late-payment / NSF rate, and stable-employment percentage? A property-management company in the area should have these aggregated.
- How much new for-sale + rental construction is in the pipeline within 1–3 miles? Heavy new supply typically softens prices + rents 12–24 months out; constrained supply supports both.
Investment metrics
- 1% rule
- 1.18% ✓
- Cap rate
- 9.18%
- Cash-on-cash
- 10.32%
- DSCR
- 1.46
- GRM
- 7.1
CMA / ARV
- ARV (on-the-fly)
- $472,809
- Comps found
- 12
Show comp detail 12 sales within ~0.75 mi
| Address | Dist | Beds/Ba | Sqft | Sold | Price | $/sf | Match |
|---|---|---|---|---|---|---|---|
| 2328 Colleen Dr | 0.00mi | 3/2.5 | 2,733 (0%) | 0mo | $168,000 | $61 | 100 |
| 2419 Parkview Dr | 0.14mi | 4/2.0 (+1) | 2,710 (-1%) | 6mo | $325,000 | $120 | 80 |
| 2811 Knob Hill St | 0.19mi | 4/3.0 (+1) | 2,869 (+5%) | 3mo | $560,000 | $195 | 74 |
| 2824 Knob Hill St | 0.16mi | 3/2.5 | 3,089 (+13%) | 8mo | $535,000 | $173 | 65 |
| 2006 Deepbrook Dr | 0.32mi | 4/3.0 (+1) | 2,602 (-5%) | 10mo | $609,000 | $234 | 62 |
| 2705 Park Xing | 0.71mi | 3/2.5 | 2,641 (-3%) | 0mo | $460,000 | $174 | 61 |
| 3601 Dogwood Blossom Ct | 0.51mi | 4/2.0 (+1) | 2,725 (-0%) | 10mo | $485,000 | $178 | 60 |
| 1917 Oak Shire Dr | 0.73mi | 4/2.5 (+1) | 2,842 (+4%) | 3mo | $399,900 | $141 | 52 |
| 3703 Wild Oak Dr | 0.61mi | 4/2.5 (+1) | 2,487 (-9%) | 0mo | $367,900 | $148 | 51 |
| 3405 Longherridge Dr | 0.64mi | 3/2.5 | 2,421 (-11%) | 1mo | $425,000 | $176 | 50 |
| 1808 Oakland Cir | 0.73mi | 4/2.5 (+1) | 2,466 (-10%) | 1mo | $370,000 | $150 | 44 |
| 1811 Oakbrook Cir | 0.73mi | 4/2.5 (+1) | 3,024 (+11%) | 6mo | $409,000 | $135 | 38 |
Match score weights: distance 35% · size 25% · config 20% · recency 20%. Top-matched comps best support the ARV.
Projected returns pro-forma
-3.0% appreciation · 2.94% rent growth · sell at horizon
- IRR
- -0.9%
- Equity multiple
- 0.97×
- Total profit
- $-1,558
- Equity at exit
- $25,049
- IRR
- 8.8%
- Equity multiple
- 1.67×
- Total profit
- $31,439
- Equity at exit
- $14,526
Cash invested: $47,040 (down + closing). Projections, not guarantees.
Landlord ↔ Tenant lean methodology
- Overall (STATE)
- 87 Strongly Landlord-Friendly
- State Texas
- 87 Strongly Landlord-Friendly · R+5
- County
- — inherits STATE
- City
- — inherits STATE
ZIP-level market 77581
- Home prices YoY
- -29.1%
- Rents YoY
- 2.9%
- Active inventory
- 316
- Price-to-rent
- 7.1×
Monthly cashflow live
- Estimated rent
- $1,982 medium interval (Pro) →
- Mortgage (P&I)
- −$881
- Tax est. 1.5%
- −$210 /mo · $2,520/yr
- Insurance
- −$70
- HOA
- −$0
- Vacancy / Maint / Mgmt
- −$416
- Net cashflow
- $404
Break-even live
UW: 25.0% down · 7.5% · 30yr · 1.5% tax · 5.0% vac · 8.0% maint · 8.0% mgmt
Financing live
Cash to close
- Down payment
- $42,000
- Closing costs
- $5,040
- Reserves months
- —
- Total cash needed
- —
Loan-product check · same deal, 3 products live
Conventional
25% down · 7.5% · 30yr
- Down + closing
- —
- Monthly P&I
- —
- Monthly cashflow
- —
- DSCR
- —
- Eligible?
- —
Personal DTI + credit; lowest rate.
DSCR
20% down · 8.5% · 30yr
- Down + closing
- —
- Monthly P&I
- —
- Monthly cashflow
- —
- DSCR
- —
- Eligible?
- —
No personal income docs; deal must DSCR.
Hard money
10% down · 12.0% · 12mo
- Down + closing
- —
- Monthly P&I
- —
- Monthly cashflow
- —
- DSCR
- —
- Eligible?
- —
Short-term bridge; refi at stabilization.
Rent comps 1 comps
| Address | Beds | Baths | Sqft | Rent | $/sqft | DOM | Units | Dist |
|---|---|---|---|---|---|---|---|---|
| 2317 Parkview Dr Pearland, TX | 3.0 | 2.0 | 1759 | $1,450 | $0.82 | 22d | 1 | 0.09mi |
Listing history 22 events
-
2026-01-26status Pending
-
2026-01-10$168,000 Active
-
2025-12-31historical
-
2025-10-02$310,000 Active
-
2025-09-22historical
-
2025-09-22$145,000 Active
-
2025-08-19historical
-
2025-07-17$295,000 Active
-
2018-03-23soldstatus Sold
-
2018-03-23soldstatus
-
2018-02-22status Pending
-
2018-02-13status Option Pending
-
2018-01-02price $231,600
-
2018-01-02price $232,900
-
2017-11-12$240,000 Active
-
2010-12-20historical
-
2010-07-26$149,900
-
2010-07-25historical
-
2010-03-01$159,900
-
2010-02-02historical
-
2009-07-27$159,900
-
2002-04-23soldstatus
ⓘ Source: listings_history table (triggers on properties + properties_extension) + one-shot
backfill from property_details.listing_events for pre-trigger history.
Climate risk First Street
- Flood 3/10 Moderate FEMA zone X (unshaded) · 10% chance over 30 yrs
- Wildfire 2/10 Low
- Heat 9/10 Extreme 7 d/yr ≥108°F today · 24 d/yr by 30 yrs out
- Wind 9/10 Extreme 99% chance of damaging wind over 30 yrs
- Air quality 2/10 Low 1 unhealthy d/yr today · 1 by 30 yrs out
Nearby sold comps map
Loading sold comps map…
Walkable amenities ~0.75 mi
Loading nearby amenities…
Taxation est. · year 1
- Rental income
- $23,778
- − Mortgage interest
- −$9,411
- − Property taxes
- −$2,520
- − Insurance
- −$840
- − Repairs & maintenance
- −$1,902
- − Management
- −$1,902
- − Depreciation
- −$4,887
- Taxable income
- $2,316
- Est. tax owed @ 24.0%
- −$556
- After-tax cash flow
- $4,297/yr
For passive investors: Depreciation is non-cash, so a rental often shows a tax loss while cash-flowing — sheltering income. Rental losses are passive: they offset passive income freely, and up to $25,000/yr can offset ordinary (W-2) income if you actively participate and your MAGI is under $100k (phasing out to $0 by $150k); unused losses carry forward. On sale, claimed depreciation is recaptured at up to 25%, and gains may owe capital-gains tax (a 1031 exchange can defer both). Figures are a year-1 estimate at your 24.0% rate — not tax advice; consult a CPA.
Schools (NCES district)
- District
- Pearland ISD
- NCES district ID
- 4834440
- Math proficiency
- 58% ▼ -13.00%
- Reading proficiency
- 59% ▼ -6.00%
- Median HH income
- $90,091
- Composite
- 53.67/100
- National rank
- #1430
- State rank
- #47 of 826 in TX
Livability — Pearland
- Score
- 81/100
- State rank
- #32
- US rank
- #1539
Category grades
Schools grade is shown separately in the Schools card above.
Census & demographics
- Census place
- Pearland, TX
- County
- Brazoria County · 374,982 people
- City population
- 142,397
- Metro
- Houston-The Woodlands-Sugar Land, TX
- Population (ZIP)
- 51,332
- Household income
- $111,139
- Rent vs Own
- Severe rent burden
- 826.0
Population outlook (Brazoria County) Hauer SSP2
- Today (2025)
- 420,414 people
- By 2030
- 457,585 · +8.8%
- By 2040
- 532,232 · +26.6%
- By 2050
- 605,399 · +44.0%
- By 2075
- 779,358 · +85.4%
- By 2100
- 883,759 · +110.2%
Race, ethnicity, and origin ACS 2023
- Neighborhood character
- Diverse neighborhood (Simpson 0.66)
- Race & ethnicity
- White 47% Hispanic / Latino 33% Two or more races 20% Black 10% Asian 7%
- Hispanic origin (detail)
- Mexican 26% Puerto Rican 2%
- Common ancestry
- Lithuanian 2% Slovak 2% Romanian 2%
- Foreign-born
- 12% · Canada, Vietnam, Guatemala
- Languages at home
- 77% English-only · Spanish 16% Other Indo-European 3% Vietnamese 2%
Political lean MEDSL · Brazoria
- 2024 margin
- R (+19.7) · D 39.5% · R 59.2% · Other 1.3%
- 2008→2024 swing
- +9.9pp toward D · 2008: -29.6pp · 2024: -19.7pp
- All cycles
- 2024: R+19.7 2020: R+18.2 2016: R+24.6 2012: R+34.2 2008: R+29.6
Not yet ingested
- Civics
- —
Market trends
- HPI YoY
- ▼ -100.56%
- Current HPI
- 244.7942
- Rent YoY
- ▲ 2.94%
- Metro
- Houston-The Woodlands-Sugar Land, TX
- State GDP YoY
- ▲ 3.95%
- F500 in state
- 110
Industry mix (Fortune 500 HQ in TX)
| Industry | F500 HQs | Revenue |
|---|---|---|
| Energy | 16 | $1,198B |
|
||
| Technology | 5 | $198B |
|
||
| Engineering / Construction | 4 | $72B |
|
||
| Energy Services | 3 | $60B |
|
||
| Utilities | 3 | $41B |
|
||
| Healthcare | 2 | $330B |
|
||
Price history
+5.1% since first listed22 events — show timeline
- 2026-01-26 Pending — HARMLS
- 2026-01-10 Listed $168,000 HARMLS
- 2025-12-31 Listing Removed — HARMLS
- 2025-10-02 Listed $310,000 HARMLS
- 2025-09-22 Listed $145,000 HARMLS
- 2025-09-22 Listing Removed — HARMLS
- 2025-08-19 Listing Removed — HARMLS
- 2025-07-17 Listed $295,000 HARMLS
- 2018-03-23 Sold (Public Records) — Public Records
- 2018-03-23 Sold (MLS) — HARMLS
- 2018-02-22 Pending — HARMLS
- 2018-02-13 Pending — HARMLS
- 2018-01-02 Price Changed $231,600 HARMLS
- 2018-01-02 Price Changed $232,900 HARMLS
- 2017-11-12 Listed $240,000 HARMLS
- 2010-12-20 Listing Removed — HARMLS
- 2010-07-26 Listed $149,900 HARMLS
- 2010-07-25 Listing Removed — HARMLS
- 2010-03-01 Listed $159,900 HARMLS
- 2010-02-02 Listing Removed — HARMLS
- 2009-07-27 Listed $159,900 HARMLS
- 2002-04-23 Sold (Public Records) — Public Records
Property tax history
+5.6%/yrLatest (2025): $8,613 · +0.4% YoY. Source: county tax records.
Cash-flow waterfall
monthlySold comps — $/sqft
last 12 mo · ≤1 miLoading sold comps…