2903 Blue Ridge Ln · Temple, TX
Flood risk No data
- FEMA flood zone
- —
- Chance of flooding over 30 yrs
- —
- Est. flood insurance / yr
- —
Fire risk No data
- Est. fire insurance / yr
- —
Heat risk No data
- Hot days now (above threshold)
- —
- Hot days in 30 yrs
- —
Wind risk No data
- Chance of severe wind over 30 yrs
- —
Air-quality risk No data
- Unhealthy air days now
- —
- Unhealthy air days in 30 yrs
- —
Risk factors via First Street. Map © Google.
Why this score? — see what drove the D grade
The composite is a weighted blend of 9 inputs, each scored 0–100. Each bar is that input's sub-score; the figure is the points it added to the 100-point composite (weight × sub-score).
- ARV discount +14.7/15.0
- Cash flow +9.3/30.0
- Condition / age +5.0/5.0
- Livability +3.8/5.0
- 1% rule +3.0/10.0
- Schools +2.7/10.0
- DSCR +2.6/10.0
- Rent growth +2.6/5.0
- Appreciation +0.0/10.0
$194,990
🖨 Deal sheet (PDF) 📄 Offer letter ✓ Due diligence
Listing remarks
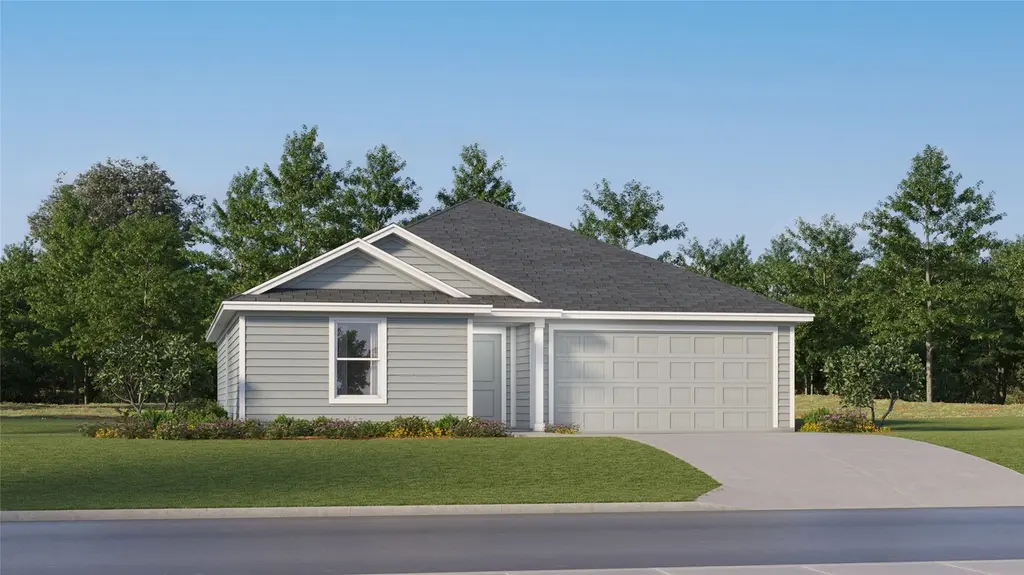
The Wagner - This new three-bedroom home offers convenient single-story living, ideal for modern lifestyles. Two bedrooms are located near the front of the home surrounding a full bathroom, adjacent to a spacious and flexible open-concept layout shared between the kitchen, living and dining areas. A luxurious owner’s suite provides a serene retreat at the back of the home with an en-suite bathroom and walk-in closet. Photos are for illustrative purposes only. Estimated Completion August 2026. The completion date, prices and features may vary and are subject to change. Please verify with Lennar directly.
Key facts
- 7,405 sq ft lot
- 2 garage spots
- Built 2026
Property features AI
Finance
- HOA & community: Homeowners association with a $30 monthly fee (includes common area maintenance); Community trails/paths
Exterior
- Parking: Attached garage; Driveway parking; Two covered parking spaces (total 2)
- Utilities: Electricity available; Public water; Public sewer (connected)
- Home design: Single-story home; New construction by Lennar; Faces northeast; Slab foundation
- Construction: Brick, cement siding, and stone exterior; Composition roof; New construction
- Exterior features: Private yard; Front porch; Back yard fencing; Back yard, front yard, interior lot
Interior
- Kitchen: Dishwasher; Range
- Bedrooms: Three main-level bedrooms
- Flooring: Carpet; Vinyl
- Bathrooms: Two full bathrooms
- Heating & cooling: Central heating; Central air conditioning
- Interior features: Open floorplan; Main-level primary bedroom; Walk-in closet(s)
- Laundry & utility: Dedicated laundry room
Neighborhood map
What this means for you Summary
Snapshot
- This is a 3-bed/2.0-bath single-family listed at $195k. Condition is rated excellent.
Deal economics
- At list price, monthly cash flow is $-144 ($-2k/yr) — negative.
- To cash-flow at today's rent, offer at most $174k (10.7% below list).
- To meet the 1% rule (rent ≥ 1% of price), the offer needs to be $156k (19.9% below list).
- Recommended offer: $156k (19.9% below list) — sets the bar for 1% rule.
- Cap rate 5.4% vs local median 3.6% in Temple — top-decile yield for the area; either an underpriced asset or a hidden risk that comps aren't pricing in. Stress-test before assuming the spread holds.
Location & tenants
- Location reads 75/100 on livability (#122 in TX, #3,814 nationally) — a middle-class / working-renter tenant base. Strengths: cost of living A+, housing A+, health & safety A+; Watch: schools C-, commute C-, crime D+.
- Temple ISD (urban): math 32% / reading 31% proficiency, ranked #590 of 826 in TX (top 71%) — families likely to look elsewhere, expect single-tenant / working-renter base with shorter leases; 66% free/reduced lunch — lower-income household profile, screen leases tightly.
- Market conditions: Rents flat; 278 active listings in the ZIP; 40 comparable units currently listed for rent nearby; rentals at typical pace (median 25d on market — plan ~3-4 weeks tenant-placement turnaround); 42% of comp listings sitting > 30 days — soft ceiling on asking rent; 3,222 units permitted in Bell County in 2024 (246 in 5+ unit buildings).
- This rent runs 35% of the median local income ($53k/yr) — at the standard rent-burdened threshold; future hikes will face affordability resistance.
Forward outlook
- Local home prices are declining (-3.0%/yr); year-one equity from $1k of loan paydown is wiped out by about $6k of value loss. Plan a longer hold.
- Bell County population projected at +21% by 2050 — long-run rental-demand tailwind backs the buy-and-hold thesis.
Negotiation context
- Only 13 days on market — expect competitive offers; lowballing is unlikely to land.
Questions for the listing agent
- What do current leases actually rent for vs. the listed asking? Can we see a recent rent roll and the last 12 months of T-12 income?
- What does the HOA fee cover, when was the last increase, and are there any pending special assessments or reserve-fund shortfalls?
- Is there a deadline driving the sale (1031 exchange, divorce, estate, relocation)? That informs how much negotiation room exists.
- Crime grade is D in this area — have there been break-ins, vandalism, or insurance claims at this property in the last 3 years? What carrier currently insures it and at what premium?
- The area grade is low — what's the realistic commute time and amenity access for the typical tenant pool here? Any planned neighborhood developments (good or bad) we should know about?
- What's the average days-on-market for RENTAL listings here right now (not sales)? A rising rental-DOM trend means longer vacancies and softer asking-rent achievability than the comps imply.
- What's the recent tenant-quality profile in this submarket — average credit score on applications, eviction rate, late-payment / NSF rate, and stable-employment percentage? A property-management company in the area should have these aggregated.
- How much new for-sale + rental construction is in the pipeline within 1–3 miles? Heavy new supply typically softens prices + rents 12–24 months out; constrained supply supports both.
Investment metrics
- 1% rule
- 0.80% ✗
- Cap rate
- 5.41%
- Cash-on-cash
- -3.16%
- DSCR
- 0.86
- GRM
- 10.4
CMA / ARV
- ARV (median comp)
- $231,990
- List price
- $194,990
- Delta
- -15.95%
- Verdict
- UNDERPRICED
- Comps
- 17 within 1.0 mi
Show comp detail 7 sales within ~0.75 mi
| Address | Dist | Beds/Ba | Sqft | Sold | Price | $/sf | Match |
|---|---|---|---|---|---|---|---|
| 2914 Blue Ridge Ln | 0.04mi | 3/2.0 | 1,413 (0%) | 3mo | $201,990 | $143 | 96 |
| 1735 Bear Grass Ridge Rd | 0.13mi | 3/2.0 | 1,360 (-4%) | 1mo | $231,990 | $171 | 87 |
| 1711 Bear Grass Ridge Rd | 0.15mi | 3/2.0 | 1,360 (-4%) | 6mo | $237,990 | $175 | 82 |
| 1715 Bear Grass Ridge Rd | 0.21mi | 3/2.0 | 1,473 (+4%) | 5mo | $234,990 | $160 | 79 |
| 2906 Blue Ridge Ln | 0.03mi | 3/2.0 | 1,569 (+11%) | 2mo | $214,990 | $137 | 78 |
| 2930 Blue Ridge Ln | 0.07mi | 3/2.0 | 1,569 (+11%) | 4mo | $217,990 | $139 | 75 |
| 1907 Bear Grass Ridge Rd | 0.11mi | 3/2.0 | 1,569 (+11%) | 7mo | $217,990 | $139 | 71 |
Match score weights: distance 35% · size 25% · config 20% · recency 20%. Top-matched comps best support the ARV.
Projected returns pro-forma
-3.0% appreciation · 0.33% rent growth · sell at horizon
- IRR
- -24.7%
- Equity multiple
- 0.18×
- Total profit
- $-44,788
- Equity at exit
- $29,074
- IRR
- -31.0%
- Equity multiple
- -0.22×
- Total profit
- $-66,506
- Equity at exit
- $16,859
Cash invested: $54,597 (down + closing). Projections, not guarantees.
Landlord ↔ Tenant lean methodology
- Overall (STATE)
- 87 Strongly Landlord-Friendly
- State Texas
- 87 Strongly Landlord-Friendly · R+5
- County
- — inherits STATE
- City
- — inherits STATE
ZIP-level market 76504
- Rents YoY
- 0.3%
- Active inventory
- 278
- Price-to-rent
- 10.4×
Monthly cashflow live
- Estimated rent
- $1,562 high interval (Pro) →
- Mortgage (P&I)
- −$1,023
- Tax est. 1.5%
- −$244 /mo · $2,925/yr
- Insurance
- −$81
- HOA
- −$30
- Vacancy / Maint / Mgmt
- −$328
- Net cashflow
- $-144
Break-even live
Sensitivity live
| Price | -10% $-9 | -5% $-76 | +0% $-144 | +5% $-211 | +10% $-278 |
|---|---|---|---|---|---|
| Rent | -10% $-267 | -5% $-205 | +0% $-144 | +5% $-82 | +10% $-20 |
| Rate | -1.0pp $-45 | -0.5pp $-94 | base $-144 | +0.5pp $-194 | +1.0pp $-246 |
UW: 25.0% down · 7.5% · 30yr · 1.5% tax · 5.0% vac · 8.0% maint · 8.0% mgmt
Financing live
Cash to close
- Down payment
- $48,748
- Closing costs
- $5,850
- Reserves months
- —
- Total cash needed
- —
Loan-product check · same deal, 3 products live
Conventional
25% down · 7.5% · 30yr
- Down + closing
- —
- Monthly P&I
- —
- Monthly cashflow
- —
- DSCR
- —
- Eligible?
- —
Personal DTI + credit; lowest rate.
DSCR
20% down · 8.5% · 30yr
- Down + closing
- —
- Monthly P&I
- —
- Monthly cashflow
- —
- DSCR
- —
- Eligible?
- —
No personal income docs; deal must DSCR.
Hard money
10% down · 12.0% · 12mo
- Down + closing
- —
- Monthly P&I
- —
- Monthly cashflow
- —
- DSCR
- —
- Eligible?
- —
Short-term bridge; refi at stabilization.
Rent comps 40 comps
| Address | Beds | Baths | Sqft | Rent | $/sqft | DOM | Units | Dist |
|---|---|---|---|---|---|---|---|---|
| 2902 Blue Ridge Ln Temple, TX | 4.0 | 2.0 | 1732 | $1,945 | $1.12 | 15d | 1 | 0.05mi |
| 2906 Blue Ridge Ln Temple, TX | 3.0 | 2.0 | 1569 | $1,695 | $1.08 | 45d | 1 | 0.05mi |
| 2928 Wildcat Ridge Rd Unit B Temple, TX | 3.0 | 2.0 | 1175 | $1,400 | $1.19 | 45d | 1 | 0.08mi |
| 2917 Quail Ridge Ln Temple, TX | 3.0 | 2.0 | 1174 | $1,395 | $1.19 | 15d | 1 | 0.11mi |
| 1907 Bear Grass Ridge Rd Temple, TX | 3.0 | 2.0 | 1569 | $1,700 | $1.08 | 45d | 1 | 0.12mi |
| 2003 Bear Grass Ridge Rd Unit B Temple, TX | 3.0 | 2.0 | 1174 | $1,300 | $1.11 | 15d | 1 | 0.13mi |
| 2007 Bear Grass Ridge Rd Unit B Temple, TX | 3.0 | 2.0 | 1395 | $1,550 | $1.11 | 15d | 1 | 0.13mi |
| 2011 Bear Grass Ridge Rd Unit A Temple, TX | 3.0 | 2.0 | 1174 | $1,395 | $1.19 | 15d | 1 | 0.13mi |
| 2509 Elk Creek St Temple, TX | 4.0 | 2.0 | 1740 | $1,825 | $1.05 | 25d | 1 | 0.76mi |
| 2072 Dade Loop Unit DADE2072 Temple, TX | 3.0 | 2.0 | 1257 | $1,535 | $1.22 | 15d | 1 | 0.93mi |
| 1218 S 26th St Unit A Temple, TX | 3.0 | 1.0 | 900 | $850 | $0.94 | 25d | 1 | 0.94mi |
| 2152 Meridian Loop Temple, TX | 3.0 | 2.0 | 1359 | $1,700 | $1.25 | 15d | 1 | 0.95mi |
| 1418 Eaton Dr Temple, TX | 3.0–4.0 | 2.0 | 1529 | $1,675 | $1.10 | 15d | 13 | 1.00mi |
| 1906 East Avenue G Unit G Temple, TX | 4.0 | 2.0 | 1347 | $1,600 | $1.19 | 25d | 1 | 1.03mi |
| 1515 Case Rd Temple, TX | 3.0 | 2.0 | 1315 | $1,600 | $1.22 | 25d | 1 | 1.04mi |
| 1115 S #B S Terrace ST Unit Terrace St unit 1115 B Temple, TX | 3.0 | 2.5 | 1355 | $1,435 | $1.06 | 45d | 1 | 1.04mi |
| 1114 Zora Dr Unit B Temple, TX | 3.0 | 2.0 | 1279 | $1,495 | $1.17 | 45d | 1 | 1.05mi |
| 1909 Euclid Dr Temple, TX | 3.0 | 2.0 | 1616 | $1,600 | $0.99 | 25d | 1 | 1.06mi |
| 1110 Zora Dr Unit B Temple, TX | 3.0 | 2.0 | 1279 | $1,495 | $1.17 | 45d | 1 | 1.06mi |
| 1551 Case Rd Temple, TX | 3.0 | 2.0 | 1315 | $1,600 | $1.22 | 45d | 1 | 1.07mi |
| 1622 Lummus Dr Temple, TX | 3.0 | 2.5 | 1518 | $1,600 | $1.05 | 45d | 1 | 1.07mi |
| 1702 E Heritage Ave Temple, TX | 3.0 | 2.0 | 1718 | $1,400 | $0.81 | 45d | 1 | 1.07mi |
| 2404 Alterman Dr Unit A Temple, TX | 3.0 | 2.0 | 1300 | $1,395 | $1.07 | 45d | 1 | 1.10mi |
| 2408 Alterman Dr Temple, TX | 3.0 | 2.0 | 1351 | $1,600 | $1.18 | 45d | 1 | 1.10mi |
| 2408 Alterman Dr Unit A Temple, TX | 3.0 | 2.0 | 1351 | $1,575 | $1.17 | 45d | 1 | 1.10mi |
| 2412 Alterman Dr Unit B Temple, TX | 3.0 | 2.0 | 1335 | $1,299 | $0.97 | 25d | 1 | 1.10mi |
| 1018 Zora Dr Unit b Temple, TX | 3.0 | 2.0 | 1310 | $1,295 | $0.99 | 45d | 1 | 1.10mi |
| 1001 S Terrace St Temple, TX | 3.0 | 2.0 | 1090 | $1,015 | $0.93 | 15d | 1 | 1.11mi |
| 1907 Delano Dr Temple, TX | 3.0 | 2.0 | 1265 | $1,700 | $1.34 | 23d | 1 | 1.11mi |
| 2420 Alterman Dr Unit A Temple, TX | 3.0 | 2.0 | 1335 | $1,325 | $0.99 | 25d | 1 | 1.11mi |
| 2306 Duntov Dr Unit B Temple, TX | 3.0 | 2.0 | 1300 | $1,395 | $1.07 | 23d | 1 | 1.14mi |
| 820 S 24th St Unit B Temple, TX | 3.0 | 2.5 | 1300 | $1,435 | $1.10 | 15d | 1 | 1.14mi |
| 708 S 28th St Unit 28th St unit 708 A Temple, TX | 3.0 | 2.5 | 1355 | $1,435 | $1.06 | 45d | 1 | 1.14mi |
| 2316 Duntov Dr Unit B Temple, TX | 3.0 | 2.0 | 1335 | $1,523 | $1.14 | 45d | 1 | 1.14mi |
| 2320 Duntov Dr Temple, TX | 3.0 | 2.0 | 1310 | $1,350 | $1.03 | 23d | 1 | 1.15mi |
| 805 S 24th St Temple, TX | 3.0 | 2.0 | 1233 | $1,245 | $1.01 | 45d | 1 | 1.15mi |
| 306 Dolphin Dr Unit 306 A Dolphin Temple, TX | 3.0 | 2.0 | 1379 | $1,350 | $0.98 | 15d | 1 | 1.15mi |
| 2306 Duntov Dr Unit A Temple, TX | 3.0 | 2.0 | 1300 | $1,395 | $1.07 | 15d | 1 | 1.16mi |
| 2307 Duntov Dr Temple, TX | 3.0 | 2.0 | 1310 | $1,350 | $1.03 | 15d | 1 | 1.16mi |
| 2311 Duntov Dr Unit a Temple, TX | 3.0 | 2.0 | 1480 | $1,400 | $0.95 | 45d | 1 | 1.16mi |
HOA detail
- Monthly dues
- $30 · $360/yr
Listing history 4 events
-
2026-05-12status Pending 616-char remark
-
2026-05-06price $194,990 616-char remark
-
2026-05-01price $209,990 616-char remark
-
2026-04-29$213,990 Active 616-char remark
ⓘ Source: listings_history table (triggers on properties + properties_extension) + one-shot
backfill from property_details.listing_events for pre-trigger history.
Nearby sold comps map
Loading sold comps map…
Walkable amenities ~0.75 mi
Loading nearby amenities…
Taxation est. · year 1
- Rental income
- $18,743
- − Mortgage interest
- −$10,922
- − Property taxes
- −$2,925
- − Insurance
- −$975
- − Repairs & maintenance
- −$1,499
- − Management
- −$1,499
- − HOA
- −$360
- − Depreciation
- −$5,672
- Taxable loss
- −$5,110
- Est. tax savings @ 24.0%
- +$1,227
- After-tax cash flow
- $-497/yr
For passive investors: Depreciation is non-cash, so a rental often shows a tax loss while cash-flowing — sheltering income. Rental losses are passive: they offset passive income freely, and up to $25,000/yr can offset ordinary (W-2) income if you actively participate and your MAGI is under $100k (phasing out to $0 by $150k); unused losses carry forward. On sale, claimed depreciation is recaptured at up to 25%, and gains may owe capital-gains tax (a 1031 exchange can defer both). Figures are a year-1 estimate at your 24.0% rate — not tax advice; consult a CPA.
Condition & rehab AI · 12 photos
This modern, single-story home is move-in ready with excellent condition and no visible repairs needed. Updates to paint and flooring would further enhance its value.
Value-add opportunities
- Both Painting the exterior and interior walls — Fresh paint enhances curb appeal and interior aesthetics.
- Both Updating the flooring in the kitchen and bathrooms — Modern flooring improves the overall look and feel of the home.
- Both Adding smart home features — Smart home features can increase both resale and rental value by making the home more convenient and energy-efficient.
Renovation cost estimate screening
Value-add ROI direction
- Both Painting the exterior and interior walls — Fresh paint enhances curb appeal and interior aesthetics. ↑
- Both Updating the flooring in the kitchen and bathrooms — Modern flooring improves the overall look and feel of the home. ↑
- Both Adding smart home features — Smart home features can increase both resale and rental value by making the home more convenient and energy-efficient. ↑
ⓘ Cost ranges are severity-bucket heuristics (US national rule-of-thumb). Get contractor quotes + a written scope before underwriting a rehab budget.
Schools (NCES district)
- District
- Temple ISD
- NCES district ID
- 4842330
- Math proficiency
- 32% ▼ -8.00%
- Reading proficiency
- 31% ▼ -4.00%
- Median HH income
- $43,120
- Composite
- 26.8/100
- National rank
- #7123
- State rank
- #590 of 826 in TX
Livability — Temple
- Score
- 75/100
- State rank
- #122
- US rank
- #3814
Category grades
Schools grade is shown separately in the Schools card above.
Census & demographics
- Census place
- Temple, TX
- County
- Bell County · 345,090 people
- City population
- 96,587
- Metro
- Killeen-Temple, TX
- Population (ZIP)
- 26,166
- Household income
- $52,803
- Rent vs Own
- Severe rent burden
- 1489.0
Population outlook (Bell County) Hauer SSP2
- Today (2025)
- 371,114 people
- By 2030
- 389,104 · +4.8%
- By 2040
- 420,592 · +13.3%
- By 2050
- 447,779 · +20.7%
- By 2075
- 499,130 · +34.5%
- By 2100
- 505,680 · +36.3%
Race, ethnicity, and origin ACS 2023
- Neighborhood character
- Diverse neighborhood (Simpson 0.65)
- Race & ethnicity
- White 49% Hispanic / Latino 29% Black 15% Two or more races 14% Asian 1%
- Hispanic origin (detail)
- Mexican 24% Puerto Rican 2%
- Common ancestry
- Italian 2% Romanian 2% Lithuanian 1%
- Foreign-born
- 8% · Canada
- Languages at home
- 81% English-only · Spanish 17% Other Indo-European 1%
Political lean MEDSL · Bell
- 2024 margin
- R (+16.2) · D 41.3% · R 57.6% · Other 1.1%
- 2008→2024 swing
- -6.5pp toward R · 2008: -9.8pp · 2024: -16.2pp
- All cycles
- 2024: R+16.2 2020: R+8.5 2016: R+15.1 2012: R+16.4 2008: R+9.8
Not yet ingested
- Civics
- —
Market trends
- HPI YoY
- ▼ -159.28%
- Current HPI
- 186.1148
- Rent YoY
- ▲ 0.33%
- Metro
- Killeen-Temple, TX
- State GDP YoY
- ▲ 3.95%
- F500 in state
- 110
Industry mix (Fortune 500 HQ in TX)
| Industry | F500 HQs | Revenue |
|---|---|---|
| Energy | 16 | $1,198B |
|
||
| Technology | 5 | $198B |
|
||
| Engineering / Construction | 4 | $72B |
|
||
| Energy Services | 3 | $60B |
|
||
| Utilities | 3 | $41B |
|
||
| Healthcare | 2 | $330B |
|
||
Price history
-8.9% since first listed4 events — show timeline
- 2026-05-12 Pending — Unlock MLS
- 2026-05-06 Price Changed $194,990 Unlock MLS
- 2026-05-01 Price Changed $209,990 Unlock MLS
- 2026-04-29 Listed $213,990 Unlock MLS
Cash-flow waterfall
monthlySold comps — $/sqft
last 12 mo · ≤1 miLoading sold comps…