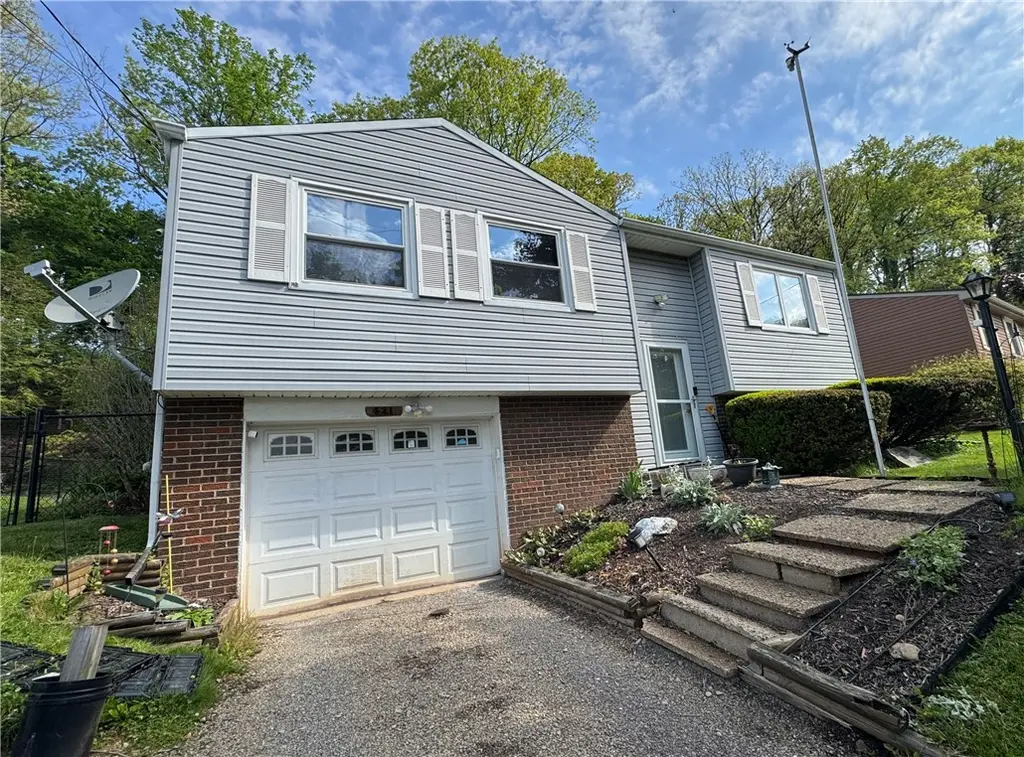
421 Tivoli Rd · Plum, PA
Flood risk 1/10 · Minimal
- FEMA flood zone
- X (unshaded)
- Chance of flooding over 30 yrs
- 0.0%
- Est. flood insurance / yr
- $473 – $860
Fire risk 1/10 · Minimal
- Est. fire insurance / yr
- $511 – $949
Heat risk 3/10 · Minor
- Hot days now (above 97°F)
- 7 days/yr
- Hot days in 30 yrs
- 18 days/yr
Wind risk 2/10 · Minimal
- Chance of severe wind over 30 yrs
- —
Air-quality risk 4/10 · Minor
- Unhealthy air days now
- 6 days/yr
- Unhealthy air days in 30 yrs
- 7 days/yr
Risk factors via First Street. Map © Google.
Why this score? — see what drove the B+ grade
The composite is a weighted blend of 9 inputs, each scored 0–100. Each bar is that input's sub-score; the figure is the points it added to the 100-point composite (weight × sub-score).
- Cash flow +29.2/30.0
- ARV discount +15.0/15.0
- DSCR +10.0/10.0
- 1% rule +9.1/10.0
- Schools +4.9/10.0
- Livability +3.6/5.0
- Rent growth +2.5/5.0
- Condition / age +2.5/5.0
- Appreciation +0.0/10.0
$134,900
🖨 Deal sheet 📄 Offer letter ✓ Due diligence
Listing remarks MLS
GREAT STARTER PRICED TO SELL SHARP GAMEROOM WITH FIREPLACE FENCED YARD HOME WARRANTY INCLUDED
Key facts
- On-street parking
- Driveway
- Integral garage
Tags
Property features AI
Exterior
- Utilities: Public water; Public sewer
- Home design: 2-story home; Resale property; Asphalt roof; Frame construction
- Construction: Frame construction; Asphalt roof
- Exterior features: Public transportation nearby
Interior
- Flooring: Hardwood; Tile
- Bathrooms: 1 full bathroom
- Heating & cooling: Forced air heating (gas); Central air conditioning
- Interior features: Hardwood and tile flooring; Basement
Neighborhood map
What this means for you Summary
Snapshot
- This is a 3-bed/1.0-bath single-family listed at $135k.
Deal economics
- At list price, monthly cash flow is $470 ($6k/yr) — positive.
- The deal already cash-flows at list — no discount required.
- Meets the 1% rule at list price ($2k rent vs $135k).
- Cap rate 10.5% vs local median 3.3% in Plum — top-decile yield for the area; either an underpriced asset or a hidden risk that comps aren't pricing in. Stress-test before assuming the spread holds.
Location & tenants
- Location reads 71/100 on livability (#730 in PA) — a middle-class / working-renter tenant base. Strengths: schools A+, crime A+, employment A+; Watch: amenities F, commute F, health & safety F.
- Plum Borough SD (suburban): math 48% / reading 63% proficiency, ranked #91 of 539 in PA (top 17%) — acceptable for families but not a draw, mixed tenant base, ~2y average lease; only 17% free/reduced lunch — higher-income household profile.
- Market conditions: 82 active listings in the ZIP; 7 comparable units currently listed for rent nearby; rentals at typical pace (median 17d on market — plan ~3-4 weeks tenant-placement turnaround); 2,996 units permitted in Allegheny County in 2024 (1,588 in 5+ unit buildings).
Forward outlook
- Local home prices are declining (-3.0%/yr); year-one equity from $933 of loan paydown is wiped out by about $4k of value loss. Plan a longer hold.
- At projected returns (-3.0% appreciation + 3.0% rent growth), your $38k cash investment doubles in ~8 years — after that, you're playing with house money.
Negotiation context
- Only 3 days on market — expect competitive offers; lowballing is unlikely to land.
- 2 sale attempts since 31y ago with the ask held roughly flat each time — persistent listings suggest the price (not the market) is what's stuck; bring a comps-based counter.
- Current owner paid $69k; list at $135k implies a 96% gain — meaningful room to come down on a strong offer.
Questions for the listing agent
- Built in 1968 — when were the roof, HVAC, electrical panel, plumbing, and water heater last replaced?
- Is there a deadline driving the sale (1031 exchange, divorce, estate, relocation)? That informs how much negotiation room exists.
- Schools are A-rated — typically a magnet for longer-tenancy family renters. What's the average tenant stay here, and is there a school-zone premium baked into asking?
- What's the average days-on-market for RENTAL listings here right now (not sales)? A rising rental-DOM trend means longer vacancies and softer asking-rent achievability than the comps imply.
- What's the recent tenant-quality profile in this submarket — average credit score on applications, eviction rate, late-payment / NSF rate, and stable-employment percentage? A property-management company in the area should have these aggregated.
- How much new for-sale + rental construction is in the pipeline within 1–3 miles? Heavy new supply typically softens prices + rents 12–24 months out; constrained supply supports both.
Investment metrics
- 1% rule
- 1.41% ✓
- Cap rate
- 10.47%
- Cash-on-cash
- 14.93%
- DSCR
- 1.66
- GRM
- 5.9
CMA / ARV
- ARV (on-the-fly)
- $229,665
- Comps found
- 12
Show comp detail 12 sales within ~0.75 mi
| Address | Dist | Beds/Ba | Sqft | Sold | Price | $/sf | Match |
|---|---|---|---|---|---|---|---|
| 665 Surfside Dr | 0.22mi | 3/2.5 | 1,300 (+4%) | 7mo | $315,000 | $242 | 72 |
| 878 Blue Ridge Rd | 0.45mi | 3/1.5 | 1,288 (+3%) | 7mo | $223,750 | $174 | 67 |
| 1541 Sugarloaf | 0.57mi | 3/1.5 | 1,260 (+0%) | 10mo | $229,900 | $182 | 62 |
| 129 Skyline Dr | 0.64mi | 3/1.5 | 1,278 (+2%) | 6mo | $178,000 | $139 | 60 |
| 508 Presque Isle Dr | 0.34mi | 3/2.0 | 1,382 (+10%) | 5mo | $180,000 | $130 | 59 |
| 361 Holiday Park Dr | 0.47mi | 3/2.0 | 1,368 (+9%) | 2mo | $249,900 | $183 | 58 |
| 267 Great Smokey Dr | 0.73mi | 3/1.5 | 1,288 (+3%) | 3mo | $287,000 | $223 | 57 |
| 210 Great Smokey Dr | 0.64mi | 3/1.5 | 1,191 (-5%) | 5mo | $215,000 | $181 | 55 |
| 306 Knollview Dr | 0.71mi | 3/2.0 | 1,293 (+3%) | 7mo | $290,000 | $224 | 52 |
| 144 Alcan Dr | 0.67mi | 4/2.0 (+1) | 1,230 (-2%) | 7mo | $180,000 | $146 | 51 |
| 2289 Chapparal Dr | 0.64mi | 3/2.5 | 1,432 (+14%) | 4mo | $319,000 | $223 | 37 |
| 283 Mckim Dr | 0.72mi | 3/2.5 | 1,417 (+13%) | 5mo | $300,000 | $212 | 35 |
Match score weights: distance 35% · size 25% · config 20% · recency 20%. Top-matched comps best support the ARV.
Projected returns pro-forma
-3.0% appreciation · 3.0% rent growth · sell at horizon
- IRR
- 5.6%
- Equity multiple
- 1.22×
- Total profit
- $8,168
- Equity at exit
- $20,114
- IRR
- 15.0%
- Equity multiple
- 2.22×
- Total profit
- $46,023
- Equity at exit
- $11,664
Cash invested: $37,772 (down + closing). Projections, not guarantees.
Landlord ↔ Tenant lean methodology
- Overall (STATE)
- 62 Landlord-Friendly
- State Pennsylvania
- 62 Landlord-Friendly · EVEN
- County
- — inherits STATE
- City
- — inherits STATE
ZIP-level market 15239
- Active inventory
- 82
- Price-to-rent
- 5.9×
Monthly cashflow live
- Estimated rent
- $1,899 high interval (Pro) →
- Mortgage (P&I)
- −$707
- Tax from tax record
- −$267 /mo · $3,198/yr
- Insurance
- −$56
- HOA
- −$0
- Vacancy / Maint / Mgmt
- −$399
- Net cashflow
- $470
Break-even live
UW: 25.0% down · 7.5% · 30yr · 1.5% tax · 5.0% vac · 8.0% maint · 8.0% mgmt
Financing live
Cash to close
- Down payment
- $33,725
- Closing costs
- $4,047
- Reserves months
- —
- Total cash needed
- —
Loan-product check · same deal, 3 products live
Conventional
25% down · 7.5% · 30yr
- Down + closing
- —
- Monthly P&I
- —
- Monthly cashflow
- —
- DSCR
- —
- Eligible?
- —
Personal DTI + credit; lowest rate.
DSCR
20% down · 8.5% · 30yr
- Down + closing
- —
- Monthly P&I
- —
- Monthly cashflow
- —
- DSCR
- —
- Eligible?
- —
No personal income docs; deal must DSCR.
Hard money
10% down · 12.0% · 12mo
- Down + closing
- —
- Monthly P&I
- —
- Monthly cashflow
- —
- DSCR
- —
- Eligible?
- —
Short-term bridge; refi at stabilization.
Rent comps 7 comps
| Address | Beds | Baths | Sqft | Rent | $/sqft | DOM | Units | Dist |
|---|---|---|---|---|---|---|---|---|
| 564 Carnival Dr Pittsburgh, PA | 3.0 | 2.0 | 1257 | $1,995 | $1.59 | 43d | 1 | 0.28mi |
| 741 Pine Valley Dr Pittsburgh, PA | 3.0 | 2.0 | 1424 | $1,795 | $1.26 | 12d | 1 | 0.61mi |
| 80 Sandune Dr Pittsburgh, PA | 3.0 | 1.0–2.5 | 1004 | $2,250 | $2.24 | 1d | 1 | 0.67mi |
| 101 Serenity Dr Plum, PA | 1.0–2.0 | 1.0 | 893 | $1,136 | $1.27 | 16d | 1 | 1.18mi |
| 9153 Saltsburg Rd Pittsburgh, PA | 4.0 | 1.0 | 1404 | $815 | $0.58 | 21d | 1 | 1.23mi |
| 104 Teton Dr Pittsburgh, PA | 3.0 | 2.5 | 1564 | $2,400 | $1.53 | 1d | 1 | 1.23mi |
| 5014 Ozark Dr Pittsburgh, PA | 3.0 | 1.5 | 1148 | $1,150 | $1.00 | 19d | 1 | 1.44mi |
Listing history 4 events
-
2026-06-07statusdays on market $134,900 Pending 3 DOM
-
2026-06-05days on market $134,900 Active 2 DOM
-
2026-06-02remarks 553-char remark
-
2026-06-02$134,900 Active 1 DOM
ⓘ Source: listings_history table (triggers on properties + properties_extension) + one-shot
backfill from property_details.listing_events for pre-trigger history.
Tax reassessment forecast PA · Partial reset (capped growth)
- Current annual tax
- $3,198 · $267/mo
- Projected year-2 tax
- $3,198 · $267/mo
- Expected delta
- $0/yr ($0/mo · 0.0%)
ⓘ Screening estimate from a state-policy table — verify with the county assessor before closing.
Climate risk First Street
- Flood 1/10 Low FEMA zone X (unshaded) · 0% chance over 30 yrs
- Wildfire 1/10 Low
- Heat 3/10 Moderate 7 d/yr ≥97°F today · 18 d/yr by 30 yrs out
- Wind 2/10 Low
- Air quality 4/10 Moderate 6 unhealthy d/yr today · 7 by 30 yrs out
Nearby sold comps map
Loading sold comps map…
Walkable amenities ~0.75 mi
Loading nearby amenities…
Taxation est. · year 1
- Rental income
- $22,788
- − Mortgage interest
- −$7,556
- − Property taxes
- −$3,198
- − Insurance
- −$674
- − Repairs & maintenance
- −$1,823
- − Management
- −$1,823
- − Depreciation
- −$3,924
- Taxable income
- $3,788
- Est. tax owed @ 24.0%
- −$909
- After-tax cash flow
- $4,731/yr
For passive investors: Depreciation is non-cash, so a rental often shows a tax loss while cash-flowing — sheltering income. Rental losses are passive: they offset passive income freely, and up to $25,000/yr can offset ordinary (W-2) income if you actively participate and your MAGI is under $100k (phasing out to $0 by $150k); unused losses carry forward. On sale, claimed depreciation is recaptured at up to 25%, and gains may owe capital-gains tax (a 1031 exchange can defer both). Figures are a year-1 estimate at your 24.0% rate — not tax advice; consult a CPA.
Schools (NCES district)
- District
- Plum Borough SD
- NCES district ID
- 4219350
- Math proficiency
- 48% ▼ -13.00%
- Reading proficiency
- 63% ▼ -16.00%
- Median HH income
- $67,665
- Composite
- 48.98/100
- National rank
- #2073
- State rank
- #91 of 539 in PA
Livability — Plum
- Score
- 71/100
- State rank
- #730
- US rank
- #7292
Category grades
Schools grade is shown separately in the Schools card above.
Census & demographics
- Census place
- Plum, PA
- City population
- 21,414
- Population (ZIP)
- 21,414
Population outlook (Allegheny County) Hauer SSP2
- Today (2025)
- 1,250,282 people
- By 2030
- 1,256,482 · +0.5%
- By 2040
- 1,256,318 · +0.5%
- By 2050
- 1,244,169 · -0.5%
- By 2075
- 1,197,693 · -4.2%
- By 2100
- 1,093,187 · -12.6%
Race, ethnicity, and origin ACS 2023
- Neighborhood character
- Predominantly White (91%)
- Race & ethnicity
- White 91% Black 3% Two or more races 3% Asian 1% Hispanic / Latino 1%
- Common ancestry
- Romanian 7% Slovak 2% Serbian 2%
- Foreign-born
- 2% · Canada
- Languages at home
- 98% English-only · Other Indo-European 1% Spanish 1%
Political lean MEDSL · Allegheny
- 2024 margin
- Strong D (+20.3) · D 59.7% · R 39.4%
- 2008→2024 swing
- +4.8pp toward D · 2008: 15.5pp · 2024: 20.3pp
- All cycles
- 2024: D+20.3 2020: D+20.4 2016: D+16.4 2012: D+14.4 2008: D+15.5
Not yet ingested
- Civics
- —
Market trends
- HPI YoY
- ▼ -182.05%
- Current HPI
- 236.4886
- Rent YoY
- —
- Metro
- —
- State GDP YoY
- ▲ 1.68%
- F500 in state
- 34
Industry mix (Fortune 500 HQ in PA)
| Industry | F500 HQs | Revenue |
|---|---|---|
| Healthcare | 2 | $309B |
|
||
| Insurance | 2 | $27B |
|
||
| Telecommunications / Media | 1 | $124B |
|
||
| Industrial Distribution | 1 | $22B |
|
||
| Financial Services | 1 | $20B |
|
||
| Chemicals / Materials | 1 | $18B |
|
||
Price history
+178.4% since first listed6 events — show timeline
- 2026-06-02 Listed $134,900 West Penn MLS
- 1995-04-28 Sold (Public Records) $69,000 Public Records
- 1995-04-27 Sold (MLS) $69,000 West Penn MLS
- 1995-01-27 Listed $74,900 West Penn MLS
- 1987-05-20 Sold (Public Records) $54,500 Public Records
- 1985-03-01 Sold (Public Records) $48,450 Public Records
Property tax history
+2.3%/yrLatest (2026): $3,198 · +1.4% YoY. Source: county tax records.
Cash-flow waterfall
monthlySold comps — $/sqft
last 12 mo · ≤1 miLoading sold comps…