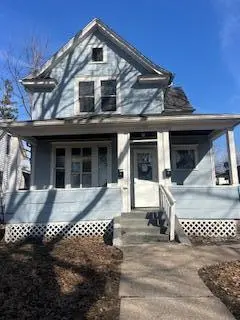
 Duplex
1232 Albemarle St · St. Paul, MN
Flood risk 1/10 · Minimal
- FEMA flood zone
- X (unshaded)
- Chance of flooding over 30 yrs
- 0.0%
- Est. flood insurance / yr
- $473 – $860
Fire risk 1/10 · Minimal
- Est. fire insurance / yr
- $888 – $1,650
Heat risk 2/10 · Minimal
- Hot days now (above 99°F)
- 7 days/yr
- Hot days in 30 yrs
- 14 days/yr
Wind risk 2/10 · Minimal
- Chance of severe wind over 30 yrs
- —
Air-quality risk 2/10 · Minimal
- Unhealthy air days now
- 1 days/yr
- Unhealthy air days in 30 yrs
- 1 days/yr
Risk factors via First Street. Map © Google.
Why this score? — see what drove the B- grade
The composite is a weighted blend of 9 inputs, each scored 0–100. Each bar is that input's sub-score; the figure is the points it added to the 100-point composite (weight × sub-score).
- Cash flow +30.0/30.0
- 1% rule +10.0/10.0
- DSCR +10.0/10.0
- ARV discount +7.5/15.0
- Rent growth +3.4/5.0
- Livability +2.5/5.0
- Condition / age +2.5/5.0
- Schools +2.4/10.0
- Appreciation +0.0/10.0
$140,000
🖨 Deal sheet 📄 Offer letter ✓ Due diligence
Multi-family units
County records classify this as Multi-Family (2-4 Unit). Listing-text estimate: 2 units. confirmed
Listing remarks MLS
Great investment property or opportunity for owner/occupant. Property is vacant and easy to show, needs work, a handyman special with the opportunity to build equity quickly. This is an up/down duplex, both units are 2 bedroom and 1 bathroom. Large detached two car garage on the alley. This property is located in the North End neighborhood of Saint Paul, close to restaurants, shopping and public transportation. Property is sold as is. A must see! Listing agent is affiliated with the company Realty Pros LLC who is selling the property. One or more members of Realty Pros LLC is a licensed real estate salesperson in the state of Minnesota.
Key facts
- Close to restaurants
- Up down duplex
- Close to shopping
Tags
Neighborhood map
What this means for you Summary
Snapshot
- This is a 2 × 2-bed/1.0-bath units multifamily listed at $140k.
Deal economics
- At list price, monthly cash flow is $882 ($11k/yr) — positive. Per door: $441/mo.
- The deal already cash-flows at list — no discount required.
- Meets the 1% rule at list price ($3k rent vs $140k).
- Recommended offer: $132k (6.0% below list) — sets the bar for market timing.
Location & tenants
- Location reads: area grade B — affects rentability + tenant quality, not the cash-flow math above.
- St. Paul Public School District (urban): math 21% / reading 33% proficiency, ranked #270 of 301 in MN (top 90%) — low school quality limits family demand, transient renter base, plan for 1-2y turnover; 64% free/reduced lunch — lower-income household profile, screen leases tightly.
- Market conditions: Rents rising (+3.6%/yr); 170 active listings in the ZIP; 2 comparable units currently listed for rent nearby; 1,202 units permitted in Ramsey County in 2024 (880 in 5+ unit buildings).
- This rent runs 44% of the median local income ($71k/yr) — at the standard rent-burdened threshold; future hikes will face affordability resistance.
Forward outlook
- Local home prices are declining (-3.0%/yr); year-one equity from $968 of loan paydown is wiped out by about $4k of value loss. Plan a longer hold.
- Ramsey County population projected at +27% by 2050 — long-run rental-demand tailwind backs the buy-and-hold thesis.
- At projected returns (-3.0% appreciation + 3.6% rent growth), your $39k cash investment doubles in ~5 years — after that, you're playing with house money.
Negotiation context
- It's been on market 75 days — a 6% lower offer ($132k) is reasonable based on typical stale-listing flexibility.
- 11 sale attempts since 35y ago; this cycle's ask has dropped $40k (22%) from the opening price — seller is motivated, your offer sets the floor, not the list.
Risks & watch-outs
- Watch-outs: property tax is 3.3% of price; built in 1910 — expect roof / HVAC / electrical / plumbing capex.
Questions for the listing agent
- It's been on market 75 days. Have you received any prior offers? Is the seller open to a 6% concession, seller financing, or rate buy-down credit?
- Can we see the unit-by-unit rent roll, current vacancy, and any below-market leases? What's the average tenancy length?
- What capital expenditures (roof, boiler, parking lot, exteriors) have been made in the last 5 years, and what's planned in the next 2?
- Built in 1910 — when were the roof, HVAC, electrical panel, plumbing, and water heater last replaced?
- Property tax is high relative to price — has the assessment been appealed recently, and will the sale trigger a re-assessment?
- Why hasn't it sold? Are there any deal-killer items the seller is aware of (foundation, flood, title, zoning, code violations)?
- Is there a deadline driving the sale (1031 exchange, divorce, estate, relocation)? That informs how much negotiation room exists.
- What's the average days-on-market for RENTAL listings here right now (not sales)? A rising rental-DOM trend means longer vacancies and softer asking-rent achievability than the comps imply.
- What's the recent tenant-quality profile in this submarket — average credit score on applications, eviction rate, late-payment / NSF rate, and stable-employment percentage? A property-management company in the area should have these aggregated.
- How much new apartment / multifamily construction is in the pipeline within 1–3 miles? Heavy new supply (>2% of stock underway) typically softens rents 12–24 months out; light construction supports rent growth.
Investment metrics
- 1% rule
- 1.86% ✓
- Cap rate
- 13.85%
- Cash-on-cash
- 27.00%
- DSCR
- 2.20
- GRM
- 4.5
CMA / ARV
No comps found within radius.
Projected returns pro-forma
-3.0% appreciation · 3.6% rent growth · sell at horizon
- IRR
- 21.8%
- Equity multiple
- 1.90×
- Total profit
- $35,227
- Equity at exit
- $20,874
- IRR
- 30.3%
- Equity multiple
- 3.81×
- Total profit
- $110,241
- Equity at exit
- $12,105
Cash invested: $39,200 (down + closing). Projections, not guarantees.
Landlord ↔ Tenant lean methodology
- Overall (STATE)
- 46 Balanced
- State Minnesota
- 46 Balanced · D+2
- County
- — inherits STATE
- City
- — inherits STATE
ZIP-level market 55117
- Rents YoY
- 3.6%
- Active inventory
- 170
- Price-to-rent
- 9.0×
Monthly cashflow live
- Estimated rent
- $2,603 medium interval (Pro) →
- Mortgage (P&I)
- −$734
- Tax from tax record
- −$382 /mo · $4,584/yr
- Insurance
- −$58
- HOA
- −$0
- Vacancy / Maint / Mgmt
- −$547
- Net cashflow
- $882
Break-even live
2-unit breakdown (identical units grouped — click to expand)
| Units | Beds | Baths | Est. rent |
|---|---|---|---|
| 2× units | 2 | 1 | $2,602 |
| #1 | 2 | 1 | $1,301 |
| #2 | 2 | 1 | $1,301 |
| Total (2 units) | $2,603 | ||
UW: 25.0% down · 7.5% · 30yr · 1.5% tax · 5.0% vac · 8.0% maint · 8.0% mgmt
Financing live
Cash to close
- Down payment
- $35,000
- Closing costs
- $4,200
- Reserves months
- —
- Total cash needed
- —
Loan-product check · same deal, 3 products live
Conventional
25% down · 7.5% · 30yr
- Down + closing
- —
- Monthly P&I
- —
- Monthly cashflow
- —
- DSCR
- —
- Eligible?
- —
Personal DTI + credit; lowest rate.
DSCR
20% down · 8.5% · 30yr
- Down + closing
- —
- Monthly P&I
- —
- Monthly cashflow
- —
- DSCR
- —
- Eligible?
- —
No personal income docs; deal must DSCR.
Hard money
10% down · 12.0% · 12mo
- Down + closing
- —
- Monthly P&I
- —
- Monthly cashflow
- —
- DSCR
- —
- Eligible?
- —
Short-term bridge; refi at stabilization.
Rent comps 2 comps
| Address | Beds | Baths | Sqft | Rent | $/sqft | DOM | Units | Dist |
|---|---|---|---|---|---|---|---|---|
| 585 Cottage Ave W Saint Paul, MN | 4.0 | 2.0 | 1940 | $2,995 | $1.54 | 20d | 1 | 0.93mi |
| 1443 Saint Albans St N Saint Paul, MN | 4.0 | 2.0 | 1500 | $2,700 | $1.80 | 17d | 1 | 1.18mi |
Listing history 50 events
-
2026-06-09days on market $140,000 Active 75 DOM
-
2026-06-08days on market $140,000 Active 74 DOM
-
2026-06-07days on market $140,000 Active 73 DOM
-
2026-06-04pricedays on market $140,000 Active 70 DOM
-
2026-06-03days on market $145,000 Active 69 DOM
-
2026-06-02days on market $145,000 Active 68 DOM
-
2026-06-01days on market $145,000 Active 67 DOM
-
2026-05-31days on market $145,000 Active 66 DOM
-
2026-05-07price $155,000 650-char remark
Show marketing remark (650 chars)
Great investment property or opportunity for owner/occupant. Property is vacant and easy to show, needs work, a handyman special with the opportunity to build equity quickly. This is an up/down duplex, both units are 2 bedroom and 1 bathroom. Large detached two car garage on the alley. This property is located in the North End neighborhood of Saint Paul, close to restaurants, shopping and public transportation. Property is sold as is. A must see! Listing agent is affiliated with the company Realty Pros LLC who is selling the property. One or more members of Realty Pros LLC is a licensed real estate salesperson in the state of Minnesota.
-
2026-04-30price $160,000 650-char remark
Show marketing remark (650 chars)
Great investment property or opportunity for owner/occupant. Property is vacant and easy to show, needs work, a handyman special with the opportunity to build equity quickly. This is an up/down duplex, both units are 2 bedroom and 1 bathroom. Large detached two car garage on the alley. This property is located in the North End neighborhood of Saint Paul, close to restaurants, shopping and public transportation. Property is sold as is. A must see! Listing agent is affiliated with the company Realty Pros LLC who is selling the property. One or more members of Realty Pros LLC is a licensed real estate salesperson in the state of Minnesota.
-
2026-04-23price $165,000 650-char remark
Show marketing remark (650 chars)
Great investment property or opportunity for owner/occupant. Property is vacant and easy to show, needs work, a handyman special with the opportunity to build equity quickly. This is an up/down duplex, both units are 2 bedroom and 1 bathroom. Large detached two car garage on the alley. This property is located in the North End neighborhood of Saint Paul, close to restaurants, shopping and public transportation. Property is sold as is. A must see! Listing agent is affiliated with the company Realty Pros LLC who is selling the property. One or more members of Realty Pros LLC is a licensed real estate salesperson in the state of Minnesota.
-
2026-04-09price $170,000 650-char remark
Show marketing remark (650 chars)
Great investment property or opportunity for owner/occupant. Property is vacant and easy to show, needs work, a handyman special with the opportunity to build equity quickly. This is an up/down duplex, both units are 2 bedroom and 1 bathroom. Large detached two car garage on the alley. This property is located in the North End neighborhood of Saint Paul, close to restaurants, shopping and public transportation. Property is sold as is. A must see! Listing agent is affiliated with the company Realty Pros LLC who is selling the property. One or more members of Realty Pros LLC is a licensed real estate salesperson in the state of Minnesota.
-
2026-03-26$180,000 Active 650-char remark
Show marketing remark (650 chars)
Great investment property or opportunity for owner/occupant. Property is vacant and easy to show, needs work, a handyman special with the opportunity to build equity quickly. This is an up/down duplex, both units are 2 bedroom and 1 bathroom. Large detached two car garage on the alley. This property is located in the North End neighborhood of Saint Paul, close to restaurants, shopping and public transportation. Property is sold as is. A must see! Listing agent is affiliated with the company Realty Pros LLC who is selling the property. One or more members of Realty Pros LLC is a licensed real estate salesperson in the state of Minnesota.
-
2025-02-19historical
-
2025-01-09historical Contingent - Other
-
2025-01-09price $160,000
-
2025-01-03price $199,999
-
2024-12-17price $214,999
-
2024-11-05price $235,000
-
2024-10-02price $240,000
-
2024-10-02$229,999 Active
-
2024-07-08soldstatus $220,000
-
2024-05-31soldstatus $220,000 Sold
-
2024-05-10status Pending
-
2024-05-02historical Contingent - Inspection
-
2024-04-05price $229,999
-
2024-03-19price $239,999
-
2024-01-26$249,999 Active
-
2018-07-23historical
-
2018-05-30price $155,000
-
2018-05-30status Active
-
2017-12-27historical
-
2017-07-24$149,900 Active
-
2016-12-02historical
-
2015-12-02price $134,900
-
2015-06-18$139,900 Active
-
2014-05-01historical
-
2013-12-12$124,900 Active
-
2011-02-28historical
-
2010-08-31$125,000
-
2008-11-12soldstatus $32,250
-
2008-10-24historical
-
2008-09-26$44,900
-
2005-12-06soldstatus $181,500
-
1997-02-12soldstatus $50,000
-
1997-01-30soldstatus $49,900
-
1992-03-27soldstatus $49,900
-
1992-03-27soldstatus $49,900
-
1992-03-14$49,900
-
1991-12-21$49,900
ⓘ Source: listings_history table (triggers on properties + properties_extension) + one-shot
backfill from property_details.listing_events for pre-trigger history.
Tax reassessment forecast MN · Partial reset (capped growth)
- Current annual tax
- $4,584 · $382/mo
- Projected year-2 tax
- $4,584 · $382/mo
- Expected delta
- $0/yr ($0/mo · 0.0%)
ⓘ Screening estimate from a state-policy table — verify with the county assessor before closing.
Climate risk First Street
- Flood 1/10 Low FEMA zone X (unshaded) · 0% chance over 30 yrs
- Wildfire 1/10 Low
- Heat 2/10 Low 7 d/yr ≥99°F today · 14 d/yr by 30 yrs out
- Wind 2/10 Low
- Air quality 2/10 Low 1 unhealthy d/yr today · 1 by 30 yrs out
Nearby sold comps map
Loading sold comps map…
Walkable amenities ~0.75 mi
Loading nearby amenities…
Taxation est. · year 1
- Rental income
- $31,236
- − Mortgage interest
- −$7,842
- − Property taxes
- −$4,584
- − Insurance
- −$700
- − Repairs & maintenance
- −$2,499
- − Management
- −$2,499
- − Depreciation
- −$4,073
- Taxable income
- $9,039
- Est. tax owed @ 24.0%
- −$2,169
- After-tax cash flow
- $8,413/yr
For passive investors: Depreciation is non-cash, so a rental often shows a tax loss while cash-flowing — sheltering income. Rental losses are passive: they offset passive income freely, and up to $25,000/yr can offset ordinary (W-2) income if you actively participate and your MAGI is under $100k (phasing out to $0 by $150k); unused losses carry forward. On sale, claimed depreciation is recaptured at up to 25%, and gains may owe capital-gains tax (a 1031 exchange can defer both). Figures are a year-1 estimate at your 24.0% rate — not tax advice; consult a CPA.
Schools (NCES district)
- District
- St. Paul Public School District
- NCES district ID
- 2733840
- Math proficiency
- 21% ▼ -11.00%
- Reading proficiency
- 33% ▼ -7.00%
- Median HH income
- $48,316
- Composite
- 23.51/100
- National rank
- #7868
- State rank
- #270 of 301 in MN
Livability — St. Paul
No livability data for this city. (Only ~50 U.S. cities are tracked.)
Census & demographics
- Census place
- St. Paul, MN
- County
- Ramsey County · 542,837 people
- Metro
- Minneapolis-St. Paul-Bloomington, MN-WI
- Population (ZIP)
- 44,697
- Household income
- $70,771
- Rent vs Own
- Severe rent burden
- 1588.0
Population outlook (Ramsey County) Hauer SSP2
- Today (2025)
- 603,431 people
- By 2030
- 636,459 · +5.5%
- By 2040
- 700,596 · +16.1%
- By 2050
- 765,819 · +26.9%
- By 2075
- 929,297 · +54.0%
- By 2100
- 1,053,924 · +74.7%
Race, ethnicity, and origin ACS 2023
- Neighborhood character
- Highly diverse neighborhood (Simpson 0.72)
- Race & ethnicity
- White 44% Asian 24% Black 15% Hispanic / Latino 10% Two or more races 10%
- Hispanic origin (detail)
- Mexican 7%
- Common ancestry
- Portuguese 6% Romanian 3% Lithuanian 2%
- Foreign-born
- 21% · Canada, Philippines, India
- Languages at home
- 68% English-only · Other Asian/Pacific 15% Spanish 8% Other Indo-European 2%
Political lean MEDSL · Ramsey
- 2024 margin
- Solid D (+43.3) · D 70.5% · R 27.2% · Other 2.3%
- 2008→2024 swing
- +9.4pp toward D · 2008: 33.9pp · 2024: 43.3pp
- All cycles
- 2024: D+43.3 2020: D+45.4 2016: D+39.4 2012: D+35.3 2008: D+33.9
Not yet ingested
- Civics
- —
Market trends
- HPI YoY
- ▼ -308.56%
- Current HPI
- 267.4216
- Rent YoY
- ▲ 3.60%
- Metro
- Minneapolis-St. Paul-Bloomington, MN-WI
- State GDP YoY
- ▲ 2.41%
- F500 in state
- 34
Industry mix (Fortune 500 HQ in MN)
| Industry | F500 HQs | Revenue |
|---|---|---|
| Healthcare | 2 | $407B |
|
||
| Retail | 2 | $150B |
|
||
| Consumer Goods | 2 | $32B |
|
||
| Industrial Machinery | 2 | $6B |
|
||
| Agriculture | 1 | $40B |
|
||
| Healthcare / Medical Devices | 1 | $32B |
|
||
Price history
+210.6% since first listed42 events — show timeline
- 2026-05-07 Price Changed $155,000 NORTHSTARMLS as Distributed by MLS Grid
- 2026-04-30 Price Changed $160,000 NORTHSTARMLS as Distributed by MLS Grid
- 2026-04-23 Price Changed $165,000 NORTHSTARMLS as Distributed by MLS Grid
- 2026-04-09 Price Changed $170,000 NORTHSTARMLS as Distributed by MLS Grid
- 2026-03-26 Listed $180,000 NORTHSTARMLS as Distributed by MLS Grid
- 2025-02-19 Listing Removed — NORTHSTARMLS as Distributed by MLS Grid
- 2025-01-09 Contingent — NORTHSTARMLS as Distributed by MLS Grid
- 2025-01-09 Price Changed $160,000 NORTHSTARMLS as Distributed by MLS Grid
- 2025-01-03 Price Changed $199,999 NORTHSTARMLS as Distributed by MLS Grid
- 2024-12-17 Price Changed $214,999 NORTHSTARMLS as Distributed by MLS Grid
- 2024-11-05 Price Changed $235,000 NORTHSTARMLS as Distributed by MLS Grid
- 2024-10-02 Price Changed $240,000 NORTHSTARMLS as Distributed by MLS Grid
- 2024-10-02 Listed $229,999 NORTHSTARMLS as Distributed by MLS Grid
- 2024-07-08 Sold (Public Records) $220,000 Public Records
- 2024-05-31 Sold (MLS) $220,000 NORTHSTARMLS as Distributed by MLS Grid
- 2024-05-10 Pending — NORTHSTARMLS as Distributed by MLS Grid
- 2024-05-02 Contingent — NORTHSTARMLS as Distributed by MLS Grid
- 2024-04-05 Price Changed $229,999 NORTHSTARMLS as Distributed by MLS Grid
- 2024-03-19 Price Changed $239,999 NORTHSTARMLS as Distributed by MLS Grid
- 2024-01-26 Listed $249,999 NORTHSTARMLS as Distributed by MLS Grid
- 2018-07-23 Listing Removed — NORTHSTARMLS as Distributed by MLS Grid
- 2018-05-30 Price Changed $155,000 NORTHSTARMLS as Distributed by MLS Grid
- 2018-05-30 Relisted — NORTHSTARMLS as Distributed by MLS Grid
- 2017-12-27 Listing Removed — NORTHSTARMLS as Distributed by MLS Grid
- 2017-07-24 Listed $149,900 NORTHSTARMLS as Distributed by MLS Grid
- 2016-12-02 Listing Removed — NORTHSTARMLS as Distributed by MLS Grid
- 2015-12-02 Price Changed $134,900 NORTHSTARMLS as Distributed by MLS Grid
- 2015-06-18 Listed $139,900 NORTHSTARMLS as Distributed by MLS Grid
- 2014-05-01 Listing Removed — NORTHSTARMLS as Distributed by MLS Grid
- 2013-12-12 Listed $124,900 NORTHSTARMLS as Distributed by MLS Grid
- 2011-02-28 Listing Removed — NORTHSTARMLS as Distributed by MLS Grid
- 2010-08-31 Listed $125,000 NORTHSTARMLS as Distributed by MLS Grid
- 2008-11-12 Sold (MLS) $32,250 NORTHSTARMLS as Distributed by MLS Grid
- 2008-10-24 Listing Removed — NORTHSTARMLS as Distributed by MLS Grid
- 2008-09-26 Listed $44,900 NORTHSTARMLS as Distributed by MLS Grid
- 2005-12-06 Sold (Public Records) $181,500 Public Records
- 1997-02-12 Sold (Public Records) $50,000 Public Records
- 1997-01-30 Sold (Public Records) $49,900 Public Records
- 1992-03-27 Sold (MLS) $49,900 NORTHSTARMLS as Distributed by MLS Grid
- 1992-03-27 Sold (MLS) $49,900 NORTHSTARMLS as Distributed by MLS Grid
- 1992-03-14 Listed $49,900 NORTHSTARMLS as Distributed by MLS Grid
- 1991-12-21 Listed $49,900 NORTHSTARMLS as Distributed by MLS Grid
Property tax history
+6.0%/yrLatest (2025): $4,584 · +15.6% YoY. Source: county tax records.
Cash-flow waterfall
monthlySold comps — $/sqft
last 12 mo · ≤1 miLoading sold comps…