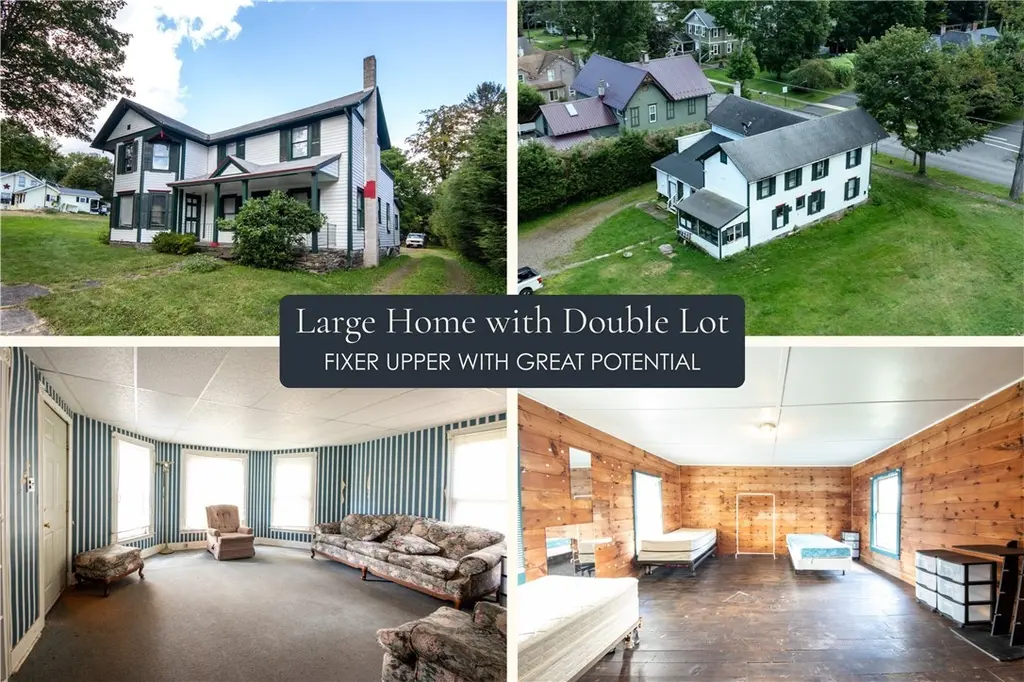
66 Spring St · Afton, NY
Flood risk 1/10 · Minimal
- FEMA flood zone
- X (unshaded)
- Chance of flooding over 30 yrs
- 0.0%
- Est. flood insurance / yr
- $473 – $860
Fire risk 1/10 · Minimal
- Est. fire insurance / yr
- $691 – $1,283
Heat risk 3/10 · Minor
- Hot days now (above 92°F)
- 7 days/yr
- Hot days in 30 yrs
- 17 days/yr
Wind risk 2/10 · Minimal
- Chance of severe wind over 30 yrs
- 1.0%
Air-quality risk 2/10 · Minimal
- Unhealthy air days now
- 0 days/yr
- Unhealthy air days in 30 yrs
- 1 days/yr
Risk factors via First Street. Map © Google.
Why this score? — see what drove the B+ grade
The composite is a weighted blend of 9 inputs, each scored 0–100. Each bar is that input's sub-score; the figure is the points it added to the 100-point composite (weight × sub-score).
- Cash flow +30.0/30.0
- 1% rule +10.0/10.0
- DSCR +10.0/10.0
- Appreciation +10.0/10.0
- ARV discount +7.5/15.0
- Schools +3.3/10.0
- Livability +3.1/5.0
- Rent growth +2.5/5.0
- Condition / age +2.5/5.0
$94,900
🖨 Deal sheet (PDF) 📄 Offer letter ✓ Due diligence
Listing remarks
Discover the potential of this spacious 2,646 square foot fixer-upper, perfectly positioned on a rare double lot in the heart of the village of Afton. With six bedrooms, two full bathrooms, and two kitchens, this home offers ample space and versatility for families or investors alike. The property includes . 64 acres, providing plenty of space for outdoor living and subdivision opportunities, and features a stately covered front porch. Enjoy abundant natural light streaming through numerous windows, creating a bright and inviting atmosphere throughout the home. The building has good bones and the large parking area and recently updated septic system are excellent building features of this s
Key facts
- Covered front porch
- Double lot
- Natural light
Tags
Property features AI
Exterior
- Parking: No garage
- Utilities: Public water connected; Septic tank sewer service; Electric service available
- Home design: Two-story home; Resale property
- Construction: Frame construction with wood siding; Asphalt shingle roof; Stone foundation; Existing (previously built) structure
- Exterior features: Dirt driveway; Rectangular lot (approx. 0.64 acres, dimensions 130 x 215)
Interior
- Kitchen: Electric oven and electric range; Refrigerator
- Bedrooms: Two main-level bedrooms
- Flooring: Hardwood; Vinyl; Varied flooring
- Bathrooms: Two full bathrooms total, one on the main level
- Heating & cooling: Oil-fired forced-air heating
- Interior features: Ceiling fans; Separate/formal living room; Pantry; Second kitchen
- Laundry & utility: Main-level laundry; Washer and dryer; Oil water heater
Neighborhood map
What this means for you Summary
Snapshot
- This is a 4-bed/2.0-bath single-family listed at $95k.
Deal economics
- At list price, monthly cash flow is $798 ($10k/yr) — positive.
- The deal already cash-flows at list — no discount required.
- Meets the 1% rule at list price ($2k rent vs $95k).
- Recommended offer: $93k (1.5% below list) — sets the bar for market timing.
Location & tenants
- Location reads 62/100 on livability (#876 in NY) — a middle-class / working-renter tenant base. Strengths: cost of living A+, housing A+, crime A-; Watch: health & safety D, schools D-, amenities F.
- Afton Central School District (rural): math 36% / reading 35% proficiency, ranked #690 of 755 in NY (top 91%) — families likely to look elsewhere, expect single-tenant / working-renter base with shorter leases.
- Market conditions: 26 active listings in the ZIP; 151 units permitted in Chenango County in 2024 (96 in 5+ unit buildings).
Forward outlook
- In year one you build about $10k of equity ($656 loan paydown + $9k appreciation (10.0% local appreciation)).
- Chenango County population projected at -26% by 2050 — secular population decline; favor cash flow + early exit over multi-decade hold.
- At projected returns (10.0% appreciation + 3.0% rent growth), your $27k cash investment doubles in ~2 years — after that, you're playing with house money.
- By year 4, paydown + projected appreciation supports a ~$36k cash-out refi (75% LTV) — recoverable capital for the next deal without selling this one.
Negotiation context
- It's been on market 28 days — a 2% lower offer ($93k) is reasonable based on typical stale-listing flexibility.
- 5 sale attempts with the ask held roughly flat each time — persistent listings suggest the price (not the market) is what's stuck; bring a comps-based counter.
- Current owner paid $35k; list at $95k implies a 171% gain — meaningful room to come down on a strong offer.
Risks & watch-outs
- Watch-outs: property tax is 2.7% of price; built in 1880 — expect roof / HVAC / electrical / plumbing capex.
Questions for the listing agent
- Built in 1880 — when were the roof, HVAC, electrical panel, plumbing, and water heater last replaced?
- Property tax is high relative to price — has the assessment been appealed recently, and will the sale trigger a re-assessment?
- Is there a deadline driving the sale (1031 exchange, divorce, estate, relocation)? That informs how much negotiation room exists.
- Schools are D-rated, which usually means shorter tenancies and higher turnover. Who's the typical renter profile here, and what's been the actual vacancy rate?
- What's the average days-on-market for RENTAL listings here right now (not sales)? A rising rental-DOM trend means longer vacancies and softer asking-rent achievability than the comps imply.
- What's the recent tenant-quality profile in this submarket — average credit score on applications, eviction rate, late-payment / NSF rate, and stable-employment percentage? A property-management company in the area should have these aggregated.
- How much new for-sale + rental construction is in the pipeline within 1–3 miles? Heavy new supply typically softens prices + rents 12–24 months out; constrained supply supports both.
Investment metrics
- 1% rule
- 2.06% ✓
- Cap rate
- 16.39%
- Cash-on-cash
- 36.06%
- DSCR
- 2.60
- GRM
- 4.0
CMA / ARV
- ARV (median comp)
- $251,749
- List price
- $94,900
- Delta
- -62.30%
- Verdict
- UNDERPRICED
- Comps
- 6 within 1.0 mi
Show comp detail 3 sales within ~0.75 mi
| Address | Dist | Beds/Ba | Sqft | Sold | Price | $/sf | Match |
|---|---|---|---|---|---|---|---|
| 14 Orchard St | 0.10mi | 4/2.0 | 2,328 (-12%) | 5mo | $160,000 | $69 | 71 |
| 13 Caswell St | 0.28mi | 4/3.0 | 2,805 (+6%) | 10mo | $178,000 | $63 | 64 |
| 197 Main St | 0.29mi | 4/2.5 | 2,589 (-2%) | 23mo | $75,000 | $29 | 62 |
Match score weights: distance 35% · size 25% · config 20% · recency 20%. Top-matched comps best support the ARV.
Projected returns pro-forma
10.0% appreciation · 3.0% rent growth · sell at horizon
- IRR
- 52.0%
- Equity multiple
- 4.86×
- Total profit
- $102,622
- Equity at exit
- $85,493
- IRR
- 45.6%
- Equity multiple
- 10.87×
- Total profit
- $262,389
- Equity at exit
- $184,370
Cash invested: $26,572 (down + closing). Projections, not guarantees.
Landlord ↔ Tenant lean methodology
- Overall (STATE)
- 15 Strongly Tenant-Friendly
- State New York
- 15 Strongly Tenant-Friendly · D+10
- County
- — inherits STATE
- City
- — inherits STATE
ZIP-level market 13730
- Home prices YoY
- 3.9%
- Active inventory
- 26
- Price-to-rent
- 4.0×
Monthly cashflow live
- Estimated rent
- $1,959 medium interval (Pro) →
- Mortgage (P&I)
- −$498
- Tax from tax record
- −$212 /mo · $2,546/yr
- Insurance
- −$40
- HOA
- −$0
- Vacancy / Maint / Mgmt
- −$411
- Net cashflow
- $798
Break-even live
Sensitivity live
| Price | -10% $852 | -5% $825 | +0% $798 | +5% $772 | +10% $745 |
|---|---|---|---|---|---|
| Rent | -10% $644 | -5% $721 | +0% $798 | +5% $876 | +10% $953 |
| Rate | -1.0pp $846 | -0.5pp $823 | base $798 | +0.5pp $774 | +1.0pp $749 |
UW: 25.0% down · 7.5% · 30yr · 1.5% tax · 5.0% vac · 8.0% maint · 8.0% mgmt
Financing live
Cash to close
- Down payment
- $23,725
- Closing costs
- $2,847
- Reserves months
- —
- Total cash needed
- —
Loan-product check · same deal, 3 products live
Conventional
25% down · 7.5% · 30yr
- Down + closing
- —
- Monthly P&I
- —
- Monthly cashflow
- —
- DSCR
- —
- Eligible?
- —
Personal DTI + credit; lowest rate.
DSCR
20% down · 8.5% · 30yr
- Down + closing
- —
- Monthly P&I
- —
- Monthly cashflow
- —
- DSCR
- —
- Eligible?
- —
No personal income docs; deal must DSCR.
Hard money
10% down · 12.0% · 12mo
- Down + closing
- —
- Monthly P&I
- —
- Monthly cashflow
- —
- DSCR
- —
- Eligible?
- —
Short-term bridge; refi at stabilization.
Listing history 16 events
-
2026-06-21days on market $94,900 Active 28 DOM
-
2026-06-18days on market $94,900 Active 26 DOM
-
2026-06-17days on market $94,900 Active 25 DOM
-
2026-06-17pricedays on market $94,900 Active 24 DOM
-
2026-06-04days on market $99,000 Active 22 DOM
-
2026-06-02days on market $99,000 Active 21 DOM
-
2026-06-01days on market $99,000 Active 20 DOM
-
2026-05-31days on market $99,000 Active 19 DOM
-
2026-05-12$99,000 Active 1334-char remark
-
2026-05-12historical
-
2025-09-29status Active
-
2025-09-29status Pending
-
2025-09-28status Active
-
2025-09-22status Pending
-
2025-09-02$99,000 Active
-
1991-04-17soldstatus $35,000
ⓘ Source: listings_history table (triggers on properties + properties_extension) + one-shot
backfill from property_details.listing_events for pre-trigger history.
Tax reassessment forecast NY · Partial reset (capped growth)
- Current annual tax
- $2,546 · $212/mo
- Projected year-2 tax
- $2,546 · $212/mo
- Expected delta
- $0/yr ($0/mo · 0.0%)
ⓘ Screening estimate from a state-policy table — verify with the county assessor before closing.
Climate risk First Street
- Flood 1/10 Low FEMA zone X (unshaded) · 0% chance over 30 yrs
- Wildfire 1/10 Low
- Heat 3/10 Moderate 7 d/yr ≥92°F today · 17 d/yr by 30 yrs out
- Wind 2/10 Low 100% chance of damaging wind over 30 yrs
- Air quality 2/10 Low 0 unhealthy d/yr today · 1 by 30 yrs out
Nearby sold comps map
Loading sold comps map…
Walkable amenities ~0.75 mi
Loading nearby amenities…
Taxation est. · year 1
- Rental income
- $23,511
- − Mortgage interest
- −$5,316
- − Property taxes
- −$2,546
- − Insurance
- −$474
- − Repairs & maintenance
- −$1,881
- − Management
- −$1,881
- − Depreciation
- −$2,761
- Taxable income
- $8,652
- Est. tax owed @ 24.0%
- −$2,076
- After-tax cash flow
- $7,504/yr
For passive investors: Depreciation is non-cash, so a rental often shows a tax loss while cash-flowing — sheltering income. Rental losses are passive: they offset passive income freely, and up to $25,000/yr can offset ordinary (W-2) income if you actively participate and your MAGI is under $100k (phasing out to $0 by $150k); unused losses carry forward. On sale, claimed depreciation is recaptured at up to 25%, and gains may owe capital-gains tax (a 1031 exchange can defer both). Figures are a year-1 estimate at your 24.0% rate — not tax advice; consult a CPA.
Schools (NCES district)
- District
- Afton Central School District
- NCES district ID
- 3602400
- Math proficiency
- 36% ▼ -5.00%
- Reading proficiency
- 35% ▼ -3.00%
- Median HH income
- $46,188
- Composite
- 33.01/100
- National rank
- #10669
- State rank
- #690 of 755 in NY
Livability — Afton
- Score
- 62/100
- State rank
- #876
- US rank
- #16945
Category grades
Schools grade is shown separately in the Schools card above.
Census & demographics
- Census place
- Afton, NY
- City population
- 2,763
- Population (ZIP)
- 2,763
Population outlook (Chenango County) Hauer SSP2
- Today (2025)
- 45,669 people
- By 2030
- 43,484 · -4.8%
- By 2040
- 38,774 · -15.1%
- By 2050
- 34,000 · -25.6%
- By 2075
- 24,637 · -46.1%
- By 2100
- 16,452 · -64.0%
Race, ethnicity, and origin ACS 2023
- Neighborhood character
- Predominantly White (93%)
- Race & ethnicity
- White 93% Two or more races 4% Hispanic / Latino 2%
- Common ancestry
- Iranian 5% Serbian 3% Romanian 3%
- Foreign-born
- 2% · Canada, China
- Languages at home
- 98% English-only · German/W. Germanic 1% Spanish 1%
Political lean MEDSL · Chenango
- 2024 margin
- Strong R (+27.2) · D 36.4% · R 63.6%
- 2008→2024 swing
- -26.1pp toward R · 2008: -1.1pp · 2024: -27.2pp
- All cycles
- 2024: R+27.2 2020: R+23.3 2016: R+28.1 2012: R+3.4 2008: R+1.1
Not yet ingested
- Civics
- —
Market trends
- HPI YoY
- ▲ 12.25%
- Current HPI
- 325.5182
- Rent YoY
- —
- Metro
- —
- State GDP YoY
- ▲ 2.60%
- F500 in state
- 92
Industry mix (Fortune 500 HQ in NY)
| Industry | F500 HQs | Revenue |
|---|---|---|
| Financial Services | 10 | $950B |
|
||
| Consumer Goods | 9 | $162B |
|
||
| Insurance | 4 | $225B |
|
||
| Telecommunications | 2 | $144B |
|
||
| Pharmaceuticals | 2 | $112B |
|
||
| Media / Entertainment | 2 | $69B |
|
||
Price history
+171.1% since first listed10 events — show timeline
- 2026-06-16 Relisted — UNYREIS
- 2026-06-16 Price Changed $94,900 UNYREIS
- 2026-05-12 Listing Removed — UNYREIS
- 2026-05-12 Listed $99,000 UNYREIS
- 2025-09-29 Relisted — UNYREIS
- 2025-09-29 Pending — UNYREIS
- 2025-09-28 Relisted — UNYREIS
- 2025-09-22 Pending — UNYREIS
- 2025-09-02 Listed $99,000 UNYREIS
- 1991-04-17 Sold (Public Records) $35,000 Public Records
Property tax history
+1.5%/yrLatest (2025): $2,546 · +4.8% YoY. Source: county tax records.
Cash-flow waterfall
monthlySold comps — $/sqft
last 12 mo · ≤1 miLoading sold comps…