402 Mallard Dr SE · DeMotte, IN
Flood risk 1/10 · Minimal
- FEMA flood zone
- X (unshaded)
- Chance of flooding over 30 yrs
- 0.0%
- Est. flood insurance / yr
- $507 – $1,088
Fire risk 1/10 · Minimal
- Est. fire insurance / yr
- $717 – $1,331
Heat risk 3/10 · Minor
- Hot days now (above 101°F)
- 7 days/yr
- Hot days in 30 yrs
- 16 days/yr
Wind risk 2/10 · Minimal
- Chance of severe wind over 30 yrs
- —
Air-quality risk 2/10 · Minimal
- Unhealthy air days now
- 1 days/yr
- Unhealthy air days in 30 yrs
- 2 days/yr
Risk factors via First Street. Map © Google.
Why this score? — see what drove the B+ grade
The composite is a weighted blend of 9 inputs, each scored 0–100. Each bar is that input's sub-score; the figure is the points it added to the 100-point composite (weight × sub-score).
- Cash flow +30.0/30.0
- 1% rule +10.0/10.0
- DSCR +10.0/10.0
- Appreciation +10.0/10.0
- ARV discount +7.5/15.0
- Schools +4.4/10.0
- Rent growth +2.5/5.0
- Livability +2.5/5.0
- Condition / age +1.0/5.0
$69,999
🖨 Deal sheet 📄 Offer letter ✓ Due diligence
Listing remarks MLS
Brand-New 3 Bedroom / 2 Bathroom Homes - Rent to Own in DeMotte! Rent to Own Opportunity: Move in for just $3,000 down and monthly payments of $1,250. Looking for an affordable path to homeownership? Discover our beautiful new homes in DeMotte, built with comfort and convenience in mind! Contact us for more details on rent to own or to purchase we work with lenders who require 10% down. ✨ Home Features: Spacious 3 bedrooms, 2 full bathrooms Modern, open-concept floor plan Energy-efficient appliances and contemporary finishes Private driveway and yard space Move-in ready - everything brand new!
Key facts
- Built 2026
- Listed 114 days
Neighborhood map
What this means for you Summary
Snapshot
- This is a 3-bed/2.0-bath manufactured listed at $70k. Condition is rated poor.
Deal economics
- At list price, monthly cash flow is $380 ($5k/yr) — positive.
- The deal already cash-flows at list — no discount required.
- Meets the 1% rule at list price ($1k rent vs $70k).
- Recommended offer: $64k (9.0% below list) — sets the bar for market timing.
- Cap rate 12.8% vs local median 2.4% in DeMotte — top-decile yield for the area; either an underpriced asset or a hidden risk that comps aren't pricing in. Stress-test before assuming the spread holds.
Location & tenants
- Location reads: area grade B — affects rentability + tenant quality, not the cash-flow math above.
- Kankakee Valley School Corporation (rural): math 47% / reading 54% proficiency, ranked #45 of 301 in IN (top 15%) — acceptable for families but not a draw, mixed tenant base, ~2y average lease.
- Market conditions: 4 active listings in the ZIP; 93 units permitted in Jasper County in 2024 (5 in 5+ unit buildings).
Forward outlook
- In year one you build about $7k of equity ($484 loan paydown + $7k appreciation (10.0% local appreciation)).
- Jasper County population projected at -11% by 2050 — secular population decline; favor cash flow + early exit over multi-decade hold.
- At projected returns (10.0% appreciation + 3.0% rent growth), your $20k cash investment doubles in ~2 years — after that, you're playing with house money.
- By year 5, paydown + projected appreciation supports a ~$35k cash-out refi (75% LTV) — recoverable capital for the next deal without selling this one.
Negotiation context
- It's been on market 115 days — a 9% lower offer ($64k) is reasonable based on typical stale-listing flexibility.
Questions for the listing agent
- It's been on market 115 days. Have you received any prior offers? Is the seller open to a 9% concession, seller financing, or rate buy-down credit?
- Have any recent inspections been done? Can we get a copy of the seller's disclosures and any deferred-maintenance estimates?
- Why hasn't it sold? Are there any deal-killer items the seller is aware of (foundation, flood, title, zoning, code violations)?
- Is there a deadline driving the sale (1031 exchange, divorce, estate, relocation)? That informs how much negotiation room exists.
- What's the average days-on-market for RENTAL listings here right now (not sales)? A rising rental-DOM trend means longer vacancies and softer asking-rent achievability than the comps imply.
- What's the recent tenant-quality profile in this submarket — average credit score on applications, eviction rate, late-payment / NSF rate, and stable-employment percentage? A property-management company in the area should have these aggregated.
- How much new for-sale + rental construction is in the pipeline within 1–3 miles? Heavy new supply typically softens prices + rents 12–24 months out; constrained supply supports both.
Investment metrics
- 1% rule
- 1.56% ✓
- Cap rate
- 12.80%
- Cash-on-cash
- 23.24%
- DSCR
- 2.03
- GRM
- 5.3
CMA / ARV
No comps found within radius.
Projected returns pro-forma
10.0% appreciation · 3.0% rent growth · sell at horizon
- IRR
- 41.7%
- Equity multiple
- 4.18×
- Total profit
- $62,318
- Equity at exit
- $63,061
- IRR
- 36.0%
- Equity multiple
- 9.39×
- Total profit
- $164,535
- Equity at exit
- $135,993
Cash invested: $19,600 (down + closing). Projections, not guarantees.
Landlord ↔ Tenant lean methodology
- Overall (STATE)
- 90 Strongly Landlord-Friendly
- State Indiana
- 90 Strongly Landlord-Friendly · R+11
- County
- — inherits STATE
- City
- — inherits STATE
ZIP-level market 46760
- Home prices YoY
- 11.2%
- Active inventory
- 4
- Price-to-rent
- 5.3×
Monthly cashflow live
- Estimated rent
- $1,093 medium interval (Pro) →
- Mortgage (P&I)
- −$367
- Tax est. 1.5%
- −$87 /mo · $1,050/yr
- Insurance
- −$29
- HOA
- −$0
- Vacancy / Maint / Mgmt
- −$230
- Net cashflow
- $380
Break-even live
UW: 25.0% down · 7.5% · 30yr · 1.5% tax · 5.0% vac · 8.0% maint · 8.0% mgmt
Financing live
Cash to close
- Down payment
- $17,500
- Closing costs
- $2,100
- Reserves months
- —
- Total cash needed
- —
Loan-product check · same deal, 3 products live
Conventional
25% down · 7.5% · 30yr
- Down + closing
- —
- Monthly P&I
- —
- Monthly cashflow
- —
- DSCR
- —
- Eligible?
- —
Personal DTI + credit; lowest rate.
DSCR
20% down · 8.5% · 30yr
- Down + closing
- —
- Monthly P&I
- —
- Monthly cashflow
- —
- DSCR
- —
- Eligible?
- —
No personal income docs; deal must DSCR.
Hard money
10% down · 12.0% · 12mo
- Down + closing
- —
- Monthly P&I
- —
- Monthly cashflow
- —
- DSCR
- —
- Eligible?
- —
Short-term bridge; refi at stabilization.
Listing history 16 events
-
2026-06-18days on market $69,999 Active 115 DOM
-
2026-06-17days on market $69,999 Active 114 DOM
-
2026-06-16days on market $69,999 Active 113 DOM
-
2026-06-15days on market $69,999 Active 112 DOM
-
2026-06-13days on market $69,999 Active 110 DOM
-
2026-06-12days on market $69,999 Active 109 DOM
-
2026-06-09days on market $69,999 Active 106 DOM
-
2026-06-08days on market $69,999 Active 105 DOM
-
2026-06-07days on market $69,999 Active 104 DOM
-
2026-06-05days on market $69,999 Active 102 DOM
-
2026-06-04days on market $69,999 Active 100 DOM
-
2026-06-02days on market $69,999 Active 99 DOM
-
2026-06-01days on market $69,999 Active 98 DOM
-
2026-05-31days on market $69,999 Active 97 DOM
-
2026-05-31days on market $69,999 Active 96 DOM
-
2026-02-24$69,999 Active 601-char remark
Show marketing remark (601 chars)
Brand-New 3 Bedroom / 2 Bathroom Homes - Rent to Own in DeMotte! Rent to Own Opportunity: Move in for just $3,000 down and monthly payments of $1,250. Looking for an affordable path to homeownership? Discover our beautiful new homes in DeMotte, built with comfort and convenience in mind! Contact us for more details on rent to own or to purchase we work with lenders who require 10% down. ✨ Home Features: Spacious 3 bedrooms, 2 full bathrooms Modern, open-concept floor plan Energy-efficient appliances and contemporary finishes Private driveway and yard space Move-in ready - everything brand new!
ⓘ Source: listings_history table (triggers on properties + properties_extension) + one-shot
backfill from property_details.listing_events for pre-trigger history.
Climate risk First Street
- Flood 1/10 Low FEMA zone X (unshaded) · 0% chance over 30 yrs
- Wildfire 1/10 Low
- Heat 3/10 Moderate 7 d/yr ≥101°F today · 16 d/yr by 30 yrs out
- Wind 2/10 Low
- Air quality 2/10 Low 1 unhealthy d/yr today · 2 by 30 yrs out
Nearby sold comps map
Loading sold comps map…
Walkable amenities ~0.75 mi
Loading nearby amenities…
Taxation est. · year 1
- Rental income
- $13,114
- − Mortgage interest
- −$3,921
- − Property taxes
- −$1,050
- − Insurance
- −$350
- − Repairs & maintenance
- −$1,049
- − Management
- −$1,049
- − Depreciation
- −$2,036
- Taxable income
- $3,659
- Est. tax owed @ 24.0%
- −$878
- After-tax cash flow
- $3,677/yr
For passive investors: Depreciation is non-cash, so a rental often shows a tax loss while cash-flowing — sheltering income. Rental losses are passive: they offset passive income freely, and up to $25,000/yr can offset ordinary (W-2) income if you actively participate and your MAGI is under $100k (phasing out to $0 by $150k); unused losses carry forward. On sale, claimed depreciation is recaptured at up to 25%, and gains may owe capital-gains tax (a 1031 exchange can defer both). Figures are a year-1 estimate at your 24.0% rate — not tax advice; consult a CPA.
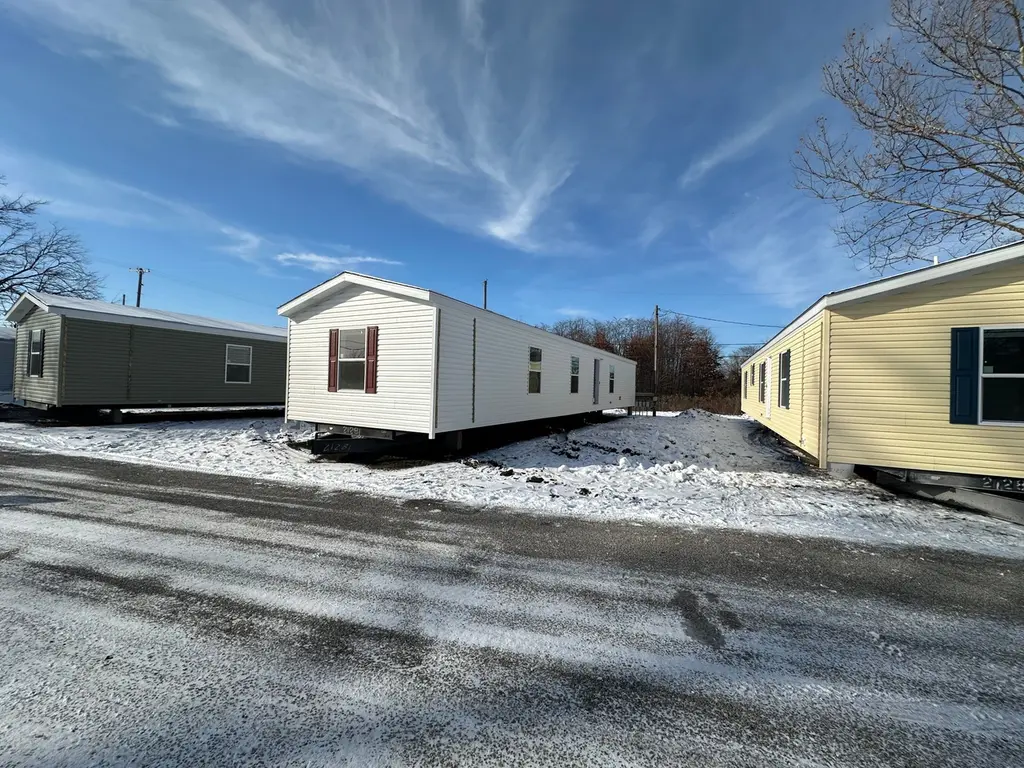
Condition & rehab AI · 2 photos
This manufactured home is in poor condition with significant repairs and maintenance needed, including roof replacement, siding and paint repair, HVAC system replacement, and landscaping improvements. The home is not move-in ready and requires extensive renovation to increase its resale or rental value.
Repairs flagged
- Major roof — The roof appears to be missing or damaged.
- Major siding — The siding is peeling and the paint is chipping.
- Major HVAC condensers — The HVAC condensers are in poor condition.
- Major landscaping — The landscaping is minimal and the curb appeal is low.
- Major interior walls/paint — The interior walls and paint are not visible in the photos, but the exterior condition suggests they may be in poor condition.
- Major windows — The windows are not visible in the photos, but the exterior condition suggests they may be in poor condition.
- Major systems — The systems are not visible in the photos, but the overall condition of the home suggests they may be in poor condition.
Value-add opportunities
- Both roof replacement — Replacing the roof would significantly improve the home's appearance and functionality.
- Both siding and paint repair — Repairing the siding and repainting would improve the home's curb appeal and functionality.
- Both HVAC system replacement — Replacing the HVAC system would improve the home's comfort and energy efficiency.
- Both landscaping and curb appeal improvements — Improving the landscaping and curb appeal would enhance the home's overall appearance and value.
- Both interior paint and repairs — Repainting and repairing the interior would improve the home's functionality and appearance.
- Both window repairs or replacements — Repairing or replacing the windows would improve the home's functionality and energy efficiency.
- Both system upgrades — Upgrading the systems would improve the home's functionality and energy efficiency.
Renovation cost estimate screening
| Repair item | Severity | Est. cost |
|---|---|---|
| roof · The roof appears to be missing or damaged. | Major | $15,000–50,000 |
| siding · The siding is peeling and the paint is chipping. | Major | $15,000–50,000 |
| HVAC condensers · The HVAC condensers are in poor condition. | Major | $15,000–50,000 |
| landscaping · The landscaping is minimal and the curb appeal is low. | Major | $15,000–50,000 |
| interior walls/paint · The interior walls and paint are not visible in the photos, but the exterior condition suggests they may be in poor condition. | Major | $15,000–50,000 |
| windows · The windows are not visible in the photos, but the exterior condition suggests they may be in poor condition. | Major | $15,000–50,000 |
| systems · The systems are not visible in the photos, but the overall condition of the home suggests they may be in poor condition. | Major | $15,000–50,000 |
| Total estimated repair cost · 7 items | $105,000–350,000 |
Value-add ROI direction
- Both roof replacement — Replacing the roof would significantly improve the home's appearance and functionality. ↑
- Both siding and paint repair — Repairing the siding and repainting would improve the home's curb appeal and functionality. ↑
- Both HVAC system replacement — Replacing the HVAC system would improve the home's comfort and energy efficiency. ↑
- Both landscaping and curb appeal improvements — Improving the landscaping and curb appeal would enhance the home's overall appearance and value. ↑
- Both interior paint and repairs — Repainting and repairing the interior would improve the home's functionality and appearance. ↑
- Both window repairs or replacements — Repairing or replacing the windows would improve the home's functionality and energy efficiency. ↑
- Both system upgrades — Upgrading the systems would improve the home's functionality and energy efficiency. ↑
ⓘ Cost ranges are severity-bucket heuristics (US national rule-of-thumb). Get contractor quotes + a written scope before underwriting a rehab budget.
Schools (NCES district)
- District
- Kankakee Valley School Corporation
- NCES district ID
- 1805280
- Math proficiency
- 47% ▼ -3.00%
- Reading proficiency
- 54% ▼ -1.00%
- Median HH income
- $58,135
- Composite
- 43.95/100
- National rank
- #2901
- State rank
- #45 of 301 in IN
Livability — DeMotte
No livability data for this city. (Only ~50 U.S. cities are tracked.)
Census & demographics
- Census place
- DeMotte, IN
- Population (ZIP)
- 1,129
Population outlook (Jasper County) Hauer SSP2
- Today (2025)
- 33,185 people
- By 2030
- 32,635 · -1.7%
- By 2040
- 31,232 · -5.9%
- By 2050
- 29,630 · -10.7%
- By 2075
- 25,938 · -21.8%
- By 2100
- 21,635 · -34.8%
Race, ethnicity, and origin ACS 2023
- Neighborhood character
- Predominantly White (99%)
- Race & ethnicity
- White 99% Hispanic / Latino 1% Two or more races 1%
- Common ancestry
- Romanian 5% Italian 4% Lithuanian 2%
Political lean MEDSL · Jasper
- 2024 margin
- Solid R (+54.3) · D 22.1% · R 76.4% · Other 1.6%
- 2008→2024 swing
- -33.9pp toward R · 2008: -20.4pp · 2024: -54.3pp
- All cycles
- 2024: R+54.3 2020: R+49.0 2016: R+45.4 2012: R+25.5 2008: R+20.4
Not yet ingested
- Civics
- —
Market trends
- HPI YoY
- ▲ 27.76%
- Current HPI
- 275.592
- Rent YoY
- —
- Metro
- —
- State GDP YoY
- ▲ 2.90%
- F500 in state
- 18
Industry mix (Fortune 500 HQ in IN)
| Industry | F500 HQs | Revenue |
|---|---|---|
| Industrial Machinery | 2 | $37B |
|
||
| Healthcare | 1 | $177B |
|
||
| Pharmaceuticals | 1 | $45B |
|
||
| Metals / Steel | 1 | $18B |
|
||
| Agriculture | 1 | $17B |
|
||
| Packaging | 1 | $12B |
|
||
Price history
1 event — show timeline
- 2026-02-24 Listed $69,999 Zillow
Cash-flow waterfall
monthlySold comps — $/sqft
last 12 mo · ≤1 miLoading sold comps…