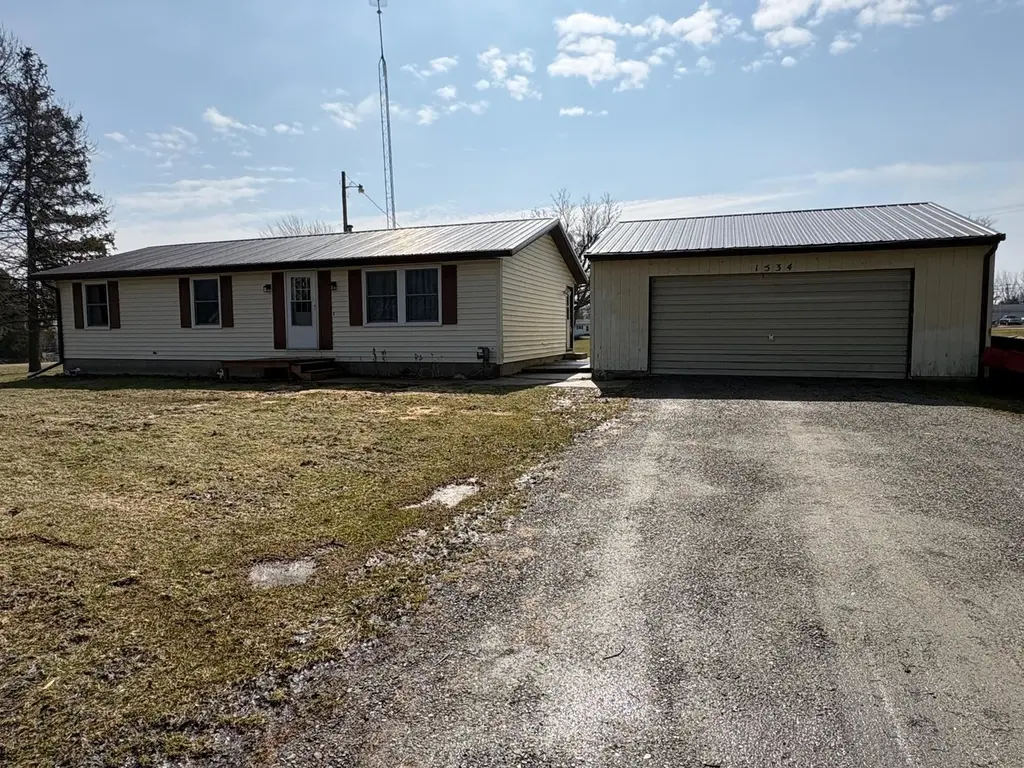
1534 Grummett St · Minden, MI
Flood risk 1/10 · Minimal
- FEMA flood zone
- X (unshaded)
- Chance of flooding over 30 yrs
- 0.0%
- Est. flood insurance / yr
- $507 – $1,088
Fire risk 1/10 · Minimal
- Est. fire insurance / yr
- $784 – $1,456
Heat risk 1/10 · Minimal
- Hot days now (above 99°F)
- 7 days/yr
- Hot days in 30 yrs
- 13 days/yr
Wind risk 1/10 · Minimal
- Chance of severe wind over 30 yrs
- —
Air-quality risk 2/10 · Minimal
- Unhealthy air days now
- 1 days/yr
- Unhealthy air days in 30 yrs
- 2 days/yr
Risk factors via First Street. Map © Google.
Why this score? — see what drove the C- grade
The composite is a weighted blend of 9 inputs, each scored 0–100. Each bar is that input's sub-score; the figure is the points it added to the 100-point composite (weight × sub-score).
- Cash flow +18.7/30.0
- ARV discount +6.5/15.0
- DSCR +5.9/10.0
- Appreciation +5.8/10.0
- 1% rule +3.9/10.0
- Schools +3.6/10.0
- Rent growth +2.5/5.0
- Livability +2.5/5.0
- Condition / age +2.5/5.0
$144,400
🖨 Deal sheet 📄 Offer letter ✓ Due diligence
Listing remarks MLS
This charming 3-bedroom, 2-bath ranch at 1534 Grummett St in Minden City offers single-story living with comfort and convenience. Built in 1985, this home boasts a spacious layout, a welcoming front porch and deck, a 2-car detached garage, and is just minutes from shopping and local amenities. Don't miss your chance-schedule a visit today!
Key facts
- 8,712 sq ft lot
- 2 garage spots
- Built 1985
Neighborhood map
What this means for you Summary
Snapshot
- This is a 3-bed/2.0-bath single-family listed at $144k.
Deal economics
- At list price, monthly cash flow is $143 ($2k/yr) — positive.
- The deal already cash-flows at list — no discount required.
- To meet the 1% rule (rent ≥ 1% of price), the offer needs to be $128k (11.2% below list).
- Recommended offer: $128k (11.2% below list) — sets the bar for 1% rule.
Location & tenants
- Location reads: area grade C — affects rentability + tenant quality, not the cash-flow math above.
- Ubly Community Schools (rural): math 32% / reading 52% proficiency, ranked #188 of 540 in MI (top 35%) — families likely to look elsewhere, expect single-tenant / working-renter base with shorter leases.
- Market conditions: 1 active listings in the ZIP; 63 units permitted in Sanilac County in 2024 (0 in 5+ unit buildings).
Forward outlook
- In year one you build about $3k of equity ($998 loan paydown + $2k appreciation (1.7% local appreciation)).
- Sanilac County population projected at -31% by 2050 — secular population decline; favor cash flow + early exit over multi-decade hold.
- At projected returns (1.7% appreciation + 3.0% rent growth), your $40k cash investment doubles in ~7 years — after that, you're playing with house money.
- By year 10, paydown + projected appreciation supports a ~$34k cash-out refi (75% LTV) — recoverable capital for the next deal without selling this one.
Negotiation context
- It's been on market 87 days — a 6% lower offer ($136k) is reasonable based on typical stale-listing flexibility.
- 7 sale attempts since 17y ago with the ask held roughly flat each time — persistent listings suggest the price (not the market) is what's stuck; bring a comps-based counter.
- Current owner paid $70k; list at $144k implies a 106% gain — meaningful room to come down on a strong offer.
Questions for the listing agent
- It's been on market 87 days. Have you received any prior offers? Is the seller open to a 11% concession, seller financing, or rate buy-down credit?
- Why hasn't it sold? Are there any deal-killer items the seller is aware of (foundation, flood, title, zoning, code violations)?
- Is there a deadline driving the sale (1031 exchange, divorce, estate, relocation)? That informs how much negotiation room exists.
- What's the average days-on-market for RENTAL listings here right now (not sales)? A rising rental-DOM trend means longer vacancies and softer asking-rent achievability than the comps imply.
- What's the recent tenant-quality profile in this submarket — average credit score on applications, eviction rate, late-payment / NSF rate, and stable-employment percentage? A property-management company in the area should have these aggregated.
- How much new for-sale + rental construction is in the pipeline within 1–3 miles? Heavy new supply typically softens prices + rents 12–24 months out; constrained supply supports both.
Investment metrics
- 1% rule
- 0.89% ✗
- Cap rate
- 7.48%
- Cash-on-cash
- 4.24%
- DSCR
- 1.19
- GRM
- 9.4
CMA / ARV
- ARV (median comp)
- $141,314
- List price
- $144,400
- Delta
- 2.18%
- Verdict
- FAIR
- Comps
- 1 within 2.0 mi
Projected returns pro-forma
1.68% appreciation · 3.0% rent growth · sell at horizon
- IRR
- 7.8%
- Equity multiple
- 1.41×
- Total profit
- $16,613
- Equity at exit
- $54,476
- IRR
- 11.2%
- Equity multiple
- 2.46×
- Total profit
- $59,232
- Equity at exit
- $76,586
Cash invested: $40,432 (down + closing). Projections, not guarantees.
Landlord ↔ Tenant lean methodology
- Overall (STATE)
- 62 Landlord-Friendly
- State Michigan
- 62 Landlord-Friendly · EVEN
- County
- — inherits STATE
- City
- — inherits STATE
ZIP-level market 48456
- Home prices YoY
- 2.2%
- Active inventory
- 1
- Price-to-rent
- 9.4×
Monthly cashflow live
- Estimated rent
- $1,282 medium interval (Pro) →
- Mortgage (P&I)
- −$757
- Tax from tax record
- −$52 /mo · $629/yr
- Insurance
- −$60
- HOA
- −$0
- Vacancy / Maint / Mgmt
- −$269
- Net cashflow
- $143
Break-even live
UW: 25.0% down · 7.5% · 30yr · 1.5% tax · 5.0% vac · 8.0% maint · 8.0% mgmt
Financing live
Cash to close
- Down payment
- $36,100
- Closing costs
- $4,332
- Reserves months
- —
- Total cash needed
- —
Loan-product check · same deal, 3 products live
Conventional
25% down · 7.5% · 30yr
- Down + closing
- —
- Monthly P&I
- —
- Monthly cashflow
- —
- DSCR
- —
- Eligible?
- —
Personal DTI + credit; lowest rate.
DSCR
20% down · 8.5% · 30yr
- Down + closing
- —
- Monthly P&I
- —
- Monthly cashflow
- —
- DSCR
- —
- Eligible?
- —
No personal income docs; deal must DSCR.
Hard money
10% down · 12.0% · 12mo
- Down + closing
- —
- Monthly P&I
- —
- Monthly cashflow
- —
- DSCR
- —
- Eligible?
- —
Short-term bridge; refi at stabilization.
Listing history 37 events
-
2026-06-18days on market $144,400 Active 87 DOM
-
2026-06-17days on market $144,400 Active 86 DOM
-
2026-06-16days on market $144,400 Active 85 DOM
-
2026-06-15days on market $144,400 Active 84 DOM
-
2026-06-13days on market $144,400 Active 82 DOM
-
2026-06-12days on market $144,400 Active 81 DOM
-
2026-06-09days on market $144,400 Active 78 DOM
-
2026-06-08days on market $144,400 Active 77 DOM
-
2026-06-07days on market $144,400 Active 76 DOM
-
2026-06-05pricedays on market $144,400 Active 74 DOM
-
2026-06-04days on market $145,900 Active 72 DOM
-
2026-06-02days on market $145,900 Active 71 DOM
-
2026-06-01days on market $145,900 Active 70 DOM
-
2026-05-31days on market $145,900 Active 69 DOM
-
2026-05-31days on market $145,900 Active 68 DOM
-
2026-03-23$145,900 Active 341-char remark
Show marketing remark (353 chars)
This charming 3-bedroom, 2-bath ranch at 1534 Grummett St in Minden City offers single-story living with comfort and convenience. Built in 1985, this home boasts a spacious layout, a welcoming front porch and deck, a 2-car detached garage, and is just minutes from shopping and local amenities. Don’t miss your chance—schedule a visit today!
-
2026-03-23$145,900 Active 353-char remark
Show marketing remark (353 chars)
This charming 3-bedroom, 2-bath ranch at 1534 Grummett St in Minden City offers single-story living with comfort and convenience. Built in 1985, this home boasts a spacious layout, a welcoming front porch and deck, a 2-car detached garage, and is just minutes from shopping and local amenities. Don’t miss your chance—schedule a visit today!
-
2018-07-03soldstatus $70,000
-
2018-06-22soldstatus $70,000
-
2018-06-22soldstatus $70,000 Closed
-
2018-04-22status Pending
-
2018-01-25price $68,000
-
2017-10-28price $69,900
-
2017-09-26price $72,000
-
2017-09-08price $74,000
-
2017-08-06$75,000 Active
-
2017-08-06$68,000
-
2016-12-22soldstatus $27,000 Sold
-
2016-12-22soldstatus $27,000 Closed
-
2016-12-14status Pending
-
2016-12-14status Pending
-
2016-10-24$34,000 Active
-
2016-10-24$34,000 Active
-
2009-07-02soldstatus $29,000
-
2009-06-10historical
-
2009-06-04$29,000
-
2007-06-12soldstatus $55,000
ⓘ Source: listings_history table (triggers on properties + properties_extension) + one-shot
backfill from property_details.listing_events for pre-trigger history.
Tax reassessment forecast MI · Partial reset (capped growth)
- Current annual tax
- $629 · $52/mo
- Projected year-2 tax
- $1,427 · $119/mo
- Expected delta
- +$797/yr (+$66/mo · 126.7%)
ⓘ Screening estimate from a state-policy table — verify with the county assessor before closing.
Climate risk First Street
- Flood 1/10 Low FEMA zone X (unshaded) · 0% chance over 30 yrs
- Wildfire 1/10 Low
- Heat 1/10 Low 7 d/yr ≥99°F today · 13 d/yr by 30 yrs out
- Wind 1/10 Low
- Air quality 2/10 Low 1 unhealthy d/yr today · 2 by 30 yrs out
Nearby sold comps map
Loading sold comps map…
Walkable amenities ~0.75 mi
Loading nearby amenities…
Taxation est. · year 1
- Rental income
- $15,384
- − Mortgage interest
- −$8,089
- − Property taxes
- −$629
- − Insurance
- −$722
- − Repairs & maintenance
- −$1,231
- − Management
- −$1,231
- − Depreciation
- −$4,201
- Taxable loss
- −$718
- Est. tax savings @ 24.0%
- +$172
- After-tax cash flow
- $1,887/yr
For passive investors: Depreciation is non-cash, so a rental often shows a tax loss while cash-flowing — sheltering income. Rental losses are passive: they offset passive income freely, and up to $25,000/yr can offset ordinary (W-2) income if you actively participate and your MAGI is under $100k (phasing out to $0 by $150k); unused losses carry forward. On sale, claimed depreciation is recaptured at up to 25%, and gains may owe capital-gains tax (a 1031 exchange can defer both). Figures are a year-1 estimate at your 24.0% rate — not tax advice; consult a CPA.
Schools (NCES district)
- District
- Ubly Community Schools
- NCES district ID
- 2634380
- Math proficiency
- 32% ▼ -6.00%
- Reading proficiency
- 52% ▼ -3.00%
- Median HH income
- $45,820
- Composite
- 35.67/100
- National rank
- #4876
- State rank
- #188 of 540 in MI
Livability — Minden
No livability data for this city. (Only ~50 U.S. cities are tracked.)
Census & demographics
- Census place
- Minden City, MI
- Population (ZIP)
- 768
Population outlook (Sanilac County) Hauer SSP2
- Today (2025)
- 37,948 people
- By 2030
- 35,772 · -5.7%
- By 2040
- 30,996 · -18.3%
- By 2050
- 26,280 · -30.7%
- By 2075
- 17,471 · -54.0%
- By 2100
- 10,572 · -72.1%
Race, ethnicity, and origin ACS 2023
- Neighborhood character
- Predominantly White (97%)
- Race & ethnicity
- White 97% Hispanic / Latino 1% Two or more races 1%
- Common ancestry
- Romanian 24% Lithuanian 6% Slovak 2%
- Foreign-born
- 1% · Canada
- Languages at home
- 98% English-only · Spanish 2%
Political lean MEDSL · Sanilac
- 2024 margin
- Solid R (+47.7) · D 25.5% · R 73.2% · Other 1.3%
- 2008→2024 swing
- -39.6pp toward R · 2008: -8.1pp · 2024: -47.7pp
- All cycles
- 2024: R+47.7 2020: R+45.6 2016: R+44.5 2012: R+20.4 2008: R+8.1
Not yet ingested
- Civics
- —
Market trends
- HPI YoY
- ▲ 1.68%
- Current HPI
- 77.4943
- Rent YoY
- —
- Metro
- —
- State GDP YoY
- ▲ 1.37%
- F500 in state
- 28
Industry mix (Fortune 500 HQ in MI)
| Industry | F500 HQs | Revenue |
|---|---|---|
| Automotive Parts | 3 | $48B |
|
||
| Automotive | 2 | $372B |
|
||
| Chemicals | 1 | $45B |
|
||
| Automotive Retail | 1 | $29B |
|
||
| Healthcare / Medical Devices | 1 | $23B |
|
||
| Automotive Technology | 1 | $20B |
|
||
Price history
+165.3% since first listed22 events — show timeline
- 2026-03-23 Listed $145,900 REALCOMP
- 2026-03-23 Listed $145,900 MiRealSource-MiMLS
- 2018-07-03 Sold (Public Records) $70,000 Public Records
- 2018-06-22 Sold (MLS) $70,000 MiRealSource-MiMLS
- 2018-06-22 Sold (MLS) $70,000 REALCOMP
- 2018-04-22 Pending — MiRealSource-MiMLS
- 2018-01-25 Price Changed $68,000 MiRealSource-MiMLS
- 2017-10-28 Price Changed $69,900 MiRealSource-MiMLS
- 2017-09-26 Price Changed $72,000 MiRealSource-MiMLS
- 2017-09-08 Price Changed $74,000 MiRealSource-MiMLS
- 2017-08-06 Listed $75,000 MiRealSource-MiMLS
- 2017-08-06 Listed $68,000 REALCOMP
- 2016-12-22 Sold (MLS) $27,000 MiRealSource-MiMLS
- 2016-12-22 Sold (MLS) $27,000 REALCOMP
- 2016-12-14 Pending — MiRealSource-MiMLS
- 2016-12-14 Pending — REALCOMP
- 2016-10-24 Listed $34,000 MiRealSource-MiMLS
- 2016-10-24 Listed $34,000 REALCOMP
- 2009-07-02 Sold (MLS) $29,000 MiRealSource-MiMLS
- 2009-06-10 Listing Removed — MiRealSource-MiMLS
- 2009-06-04 Listed $29,000 MiRealSource-MiMLS
- 2007-06-12 Sold (Public Records) $55,000 Public Records
Property tax history
-8.3%/yrLatest (2025): $629 · -41.3% YoY. Source: county tax records.
Cash-flow waterfall
monthlySold comps — $/sqft
last 12 mo · ≤1 miLoading sold comps…