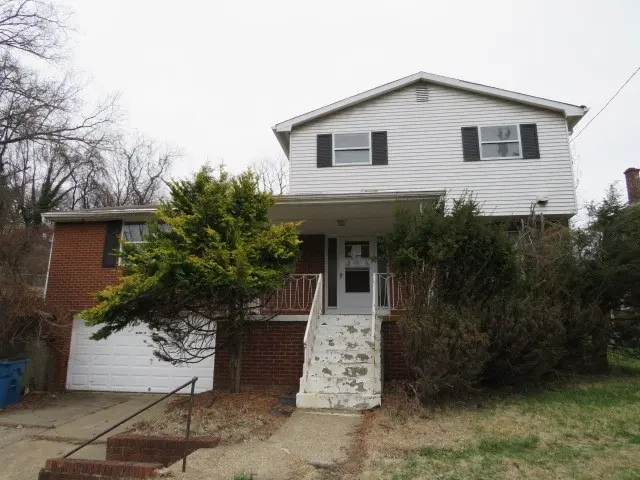
7967 Aber Rd · Penn Hills, PA
Flood risk 1/10 · Minimal
- FEMA flood zone
- X (unshaded)
- Chance of flooding over 30 yrs
- 0.0%
- Est. flood insurance / yr
- $473 – $860
Fire risk 1/10 · Minimal
- Est. fire insurance / yr
- $511 – $949
Heat risk 3/10 · Minor
- Hot days now (above 96°F)
- 6 days/yr
- Hot days in 30 yrs
- 15 days/yr
Wind risk 2/10 · Minimal
- Chance of severe wind over 30 yrs
- —
Air-quality risk 4/10 · Minor
- Unhealthy air days now
- 5 days/yr
- Unhealthy air days in 30 yrs
- 7 days/yr
Risk factors via First Street. Map © Google.
Why this score? — see what drove the C+ grade
The composite is a weighted blend of 9 inputs, each scored 0–100. Each bar is that input's sub-score; the figure is the points it added to the 100-point composite (weight × sub-score).
- Cash flow +24.4/30.0
- ARV discount +15.0/15.0
- 1% rule +8.0/10.0
- DSCR +7.9/10.0
- Rent growth +2.5/5.0
- Livability +2.5/5.0
- Condition / age +2.5/5.0
- Schools +1.6/10.0
- Appreciation +0.0/10.0
$130,000
🖨 Deal sheet 📄 Offer letter ✓ Due diligence
Listing remarks MLS
14x10 Front Porch, 20x12 Covered Rear Porch 9x8 Laundry Room, Laundry Chute, Updated Roof, Shed, Great Home.
Key facts
- Front covered porch
- Formal dining room
- Cozy brick fireplace
Tags
Property features AI
Exterior
- Parking: Attached garage with built-in parking (2 spaces)
- Home design: Two-story home
- Construction: Brick and frame construction
- Exterior features: 60x130 (approx.) lot; Resale condition
Interior
- Kitchen: Kitchen on main level (approx. 11x13)
- Bedrooms: Three bedrooms (two on upper level, one upper — sizes approx. 10x10, 10x11, 12x17)
- Flooring: Carpet; Hardwood; Vinyl
- Bathrooms: 1 full bathroom; 1 half bathroom
- Interior features: Full unfinished basement; 7 total rooms
Neighborhood map
What this means for you Summary
Snapshot
- This is a 3-bed/1.5-bath single-family listed at $130k.
Deal economics
- At list price, monthly cash flow is $265 ($3k/yr) — positive.
- The deal already cash-flows at list — no discount required.
- Meets the 1% rule at list price ($2k rent vs $130k).
- Recommended offer: $122k (6.0% below list) — sets the bar for market timing.
Location & tenants
- Location reads: area grade C — affects rentability + tenant quality, not the cash-flow math above.
- Penn Hills SD (suburban): math 13% / reading 24% proficiency, ranked #496 of 539 in PA (top 92%) — low school quality limits family demand, transient renter base, plan for 1-2y turnover.
- Market conditions: 64 active listings in the ZIP; 19 comparable units currently listed for rent nearby; rentals at typical pace (median 15d on market — plan ~3-4 weeks tenant-placement turnaround); 2,996 units permitted in Allegheny County in 2024 (1,588 in 5+ unit buildings).
- This rent runs 30% of the median local income ($67k/yr) — at the standard rent-burdened threshold; future hikes will face affordability resistance.
Forward outlook
- Local home prices are declining (-3.0%/yr); year-one equity from $899 of loan paydown is wiped out by about $4k of value loss. Plan a longer hold.
Negotiation context
- It's been on market 73 days — a 6% lower offer ($122k) is reasonable based on typical stale-listing flexibility.
- 2 sale attempts since 23y ago with the ask held roughly flat each time — persistent listings suggest the price (not the market) is what's stuck; bring a comps-based counter.
- Current owner paid $87k; 49% above their basis — modest negotiation headroom, anchor on the comps not their cost.
Risks & watch-outs
- Watch-outs: property tax is 3.1% of price.
Questions for the listing agent
- It's been on market 73 days. Have you received any prior offers? Is the seller open to a 6% concession, seller financing, or rate buy-down credit?
- Built in 1967 — when were the roof, HVAC, electrical panel, plumbing, and water heater last replaced?
- Property tax is high relative to price — has the assessment been appealed recently, and will the sale trigger a re-assessment?
- Why hasn't it sold? Are there any deal-killer items the seller is aware of (foundation, flood, title, zoning, code violations)?
- Is there a deadline driving the sale (1031 exchange, divorce, estate, relocation)? That informs how much negotiation room exists.
- What's the average days-on-market for RENTAL listings here right now (not sales)? A rising rental-DOM trend means longer vacancies and softer asking-rent achievability than the comps imply.
- What's the recent tenant-quality profile in this submarket — average credit score on applications, eviction rate, late-payment / NSF rate, and stable-employment percentage? A property-management company in the area should have these aggregated.
- How much new for-sale + rental construction is in the pipeline within 1–3 miles? Heavy new supply typically softens prices + rents 12–24 months out; constrained supply supports both.
Investment metrics
- 1% rule
- 1.30% ✓
- Cap rate
- 8.74%
- Cash-on-cash
- 8.72%
- DSCR
- 1.39
- GRM
- 6.4
CMA / ARV
- ARV (on-the-fly)
- $206,916
- Comps found
- 12
Show comp detail 12 sales within ~0.75 mi
| Address | Dist | Beds/Ba | Sqft | Sold | Price | $/sf | Match |
|---|---|---|---|---|---|---|---|
| 409 Grove Rd | 0.20mi | 3/1.5 | 1,450 (-10%) | 4mo | $232,000 | $160 | 72 |
| 277 Suncrest Dr | 0.26mi | 3/2.5 | 1,536 (-4%) | 7mo | $256,000 | $167 | 71 |
| 9620 Emerson St | 0.52mi | 3/2.0 | 1,598 (-0%) | 7mo | $29,000 | $18 | 67 |
| 8952 Eastwood Rd | 0.40mi | 3/2.0 | 1,714 (+7%) | 2mo | $245,000 | $143 | 66 |
| 162 Conestoga Rd | 0.34mi | 3/2.0 | 1,435 (-10%) | 4mo | $185,500 | $129 | 62 |
| 451 Grove Rd | 0.31mi | 3/1.5 | 1,412 (-12%) | 5mo | $164,900 | $117 | 61 |
| 2173 Sampson St | 0.56mi | 3/1.0 | 1,714 (+7%) | 3mo | $160,000 | $93 | 58 |
| 8527 Westwood Rd | 0.67mi | 3/1.0 | 1,528 (-5%) | 4mo | $156,000 | $102 | 55 |
| 200 Champa St | 0.46mi | 3/3.0 | 1,756 (+10%) | 4mo | $130,000 | $74 | 53 |
| 7720 Mark Dr | 0.51mi | 3/2.5 | 1,418 (-12%) | 5mo | $235,000 | $166 | 49 |
| 8250 Aber Rd | 0.50mi | 3/2.0 | 1,364 (-15%) | 1mo | $220,000 | $161 | 49 |
| 86 Woods Rd | 0.57mi | 3/1.0 | 1,420 (-12%) | 8mo | $62,000 | $44 | 45 |
Match score weights: distance 35% · size 25% · config 20% · recency 20%. Top-matched comps best support the ARV.
Projected returns pro-forma
-3.0% appreciation · 3.0% rent growth · sell at horizon
- IRR
- -3.0%
- Equity multiple
- 0.89×
- Total profit
- $-4,081
- Equity at exit
- $19,383
- IRR
- 6.8%
- Equity multiple
- 1.51×
- Total profit
- $18,676
- Equity at exit
- $11,240
Cash invested: $36,400 (down + closing). Projections, not guarantees.
Landlord ↔ Tenant lean methodology
- Overall (STATE)
- 62 Landlord-Friendly
- State Pennsylvania
- 62 Landlord-Friendly · EVEN
- County
- — inherits STATE
- City
- — inherits STATE
ZIP-level market 15147
- Home prices YoY
- -26.0%
- Active inventory
- 64
- Price-to-rent
- 6.4×
Monthly cashflow live
- Estimated rent
- $1,686 high interval (Pro) →
- Mortgage (P&I)
- −$682
- Tax from tax record
- −$332 /mo · $3,980/yr
- Insurance
- −$54
- HOA
- −$0
- Vacancy / Maint / Mgmt
- −$354
- Net cashflow
- $265
Break-even live
UW: 25.0% down · 7.5% · 30yr · 1.5% tax · 5.0% vac · 8.0% maint · 8.0% mgmt
Financing live
Cash to close
- Down payment
- $32,500
- Closing costs
- $3,900
- Reserves months
- —
- Total cash needed
- —
Loan-product check · same deal, 3 products live
Conventional
25% down · 7.5% · 30yr
- Down + closing
- —
- Monthly P&I
- —
- Monthly cashflow
- —
- DSCR
- —
- Eligible?
- —
Personal DTI + credit; lowest rate.
DSCR
20% down · 8.5% · 30yr
- Down + closing
- —
- Monthly P&I
- —
- Monthly cashflow
- —
- DSCR
- —
- Eligible?
- —
No personal income docs; deal must DSCR.
Hard money
10% down · 12.0% · 12mo
- Down + closing
- —
- Monthly P&I
- —
- Monthly cashflow
- —
- DSCR
- —
- Eligible?
- —
Short-term bridge; refi at stabilization.
Rent comps 19 comps
| Address | Beds | Baths | Sqft | Rent | $/sqft | DOM | Units | Dist |
|---|---|---|---|---|---|---|---|---|
| 103 Grove Rd Verona, PA | 3.0 | 1.5 | 1460 | $1,450 | $0.99 | 12d | 1 | 0.02mi |
| 216 Grove Rd Verona, PA | 3.0 | 1.0 | 1165 | $1,550 | $1.33 | 43d | 1 | 0.09mi |
| 251 Selvin Dr Verona, PA | 3.0 | 1.0 | 1320 | $1,295 | $0.98 | 3d | 1 | 0.45mi |
| 273 Bramble St Verona, PA | 3.0 | 1.5 | 1076 | $1,720 | $1.60 | 4d | 1 | 0.51mi |
| 8612 Oakcrest Rd Pittsburgh, PA | 2.0 | 1.0 | 1218 | $1,450 | $1.19 | 23d | 1 | 0.52mi |
| 8918 Frankstown Rd Pittsburgh, PA | 3.0 | 1.0 | 1400 | $1,907 | $1.36 | 14d | 1 | 0.52mi |
| 8075 Chaske St Verona, PA | 3.0 | 1.5 | 1092 | $1,425 | $1.30 | 7d | 1 | 0.58mi |
| 8606 Westwood Rd Pittsburgh, PA | 4.0 | 1.0 | 1596 | $1,425 | $0.89 | 43d | 1 | 0.64mi |
| 10135 Pearl Rd Pittsburgh, PA | 3.0 | 2.0 | 1163 | $1,450 | $1.25 | 23d | 1 | 0.74mi |
| 3005 Laketon Rd Pittsburgh, PA | 3.0 | 1.0 | 1100 | $1,295 | $1.18 | 14d | 1 | 1.03mi |
| 1250 Blackadore Ave Pittsburgh, PA | 3.0 | 1.0 | 1440 | $1,750 | $1.22 | 23d | 1 | 1.03mi |
| 648 Southern Ave Penn Hills, PA | 3.0 | 1.0 | 1100 | $1,600 | $1.45 | 7d | 1 | 1.11mi |
| 610 Churchill Ave Pittsburgh, PA | 3.0 | 1.0 | 1100 | $1,395 | $1.27 | 2d | 1 | 1.13mi |
| 2031 Chalfant St Pittsburgh, PA | 3.0 | 1.5 | 1150 | $1,950 | $1.70 | 43d | 1 | 1.27mi |
| 131 Jacob Dr Pittsburgh, PA | 3.0 | 1.0 | 1144 | $2,300 | $2.01 | 1d | 1 | 1.39mi |
| 100 Vista Cir #402 Pittsburgh, PA | 2.0 | 2.0 | 1961 | $4,350 | $2.22 | 1d | 1 | 1.41mi |
| 1526 Edwards St Verona, PA | 3.0 | 1.0 | 1296 | $1,730 | $1.33 | 43d | 1 | 1.41mi |
| 1962 McNary Blvd Pittsburgh, PA | 3.0 | 1.0 | 1517 | $1,545 | $1.02 | 7d | 1 | 1.45mi |
| 154 Park Sq Pittsburgh, PA | 3.0 | 2.5 | 2040 | $3,800 | $1.86 | 43d | 1 | 1.46mi |
Listing history 12 events
-
2026-06-18days on market $130,000 Active 73 DOM
-
2026-06-17days on market $130,000 Active 72 DOM
-
2026-06-16days on market $130,000 Active 71 DOM
-
2026-06-15status $130,000 Active 70 DOM
-
2026-06-02statusdays on market $130,000 Pending 70 DOM
-
2026-06-01days on market $130,000 Contingent 69 DOM
-
2026-05-31days on market $130,000 Contingent 68 DOM
-
2026-04-07historical Contingent
-
2026-03-24$130,000 Active
-
2003-07-31soldstatus $87,000
-
2003-07-25soldstatus $87,000 108-char remark
Show marketing remark (108 chars)
14x10 Front Porch, 20x12 Covered Rear Porch 9x8 Laundry Room, Laundry Chute, Updated Roof, Shed, Great Home.
-
2003-04-25$87,900 108-char remark
Show marketing remark (108 chars)
14x10 Front Porch, 20x12 Covered Rear Porch 9x8 Laundry Room, Laundry Chute, Updated Roof, Shed, Great Home.
ⓘ Source: listings_history table (triggers on properties + properties_extension) + one-shot
backfill from property_details.listing_events for pre-trigger history.
Tax reassessment forecast PA · Partial reset (capped growth)
- Current annual tax
- $3,980 · $332/mo
- Projected year-2 tax
- $3,980 · $332/mo
- Expected delta
- $0/yr ($0/mo · 0.0%)
ⓘ Screening estimate from a state-policy table — verify with the county assessor before closing.
Climate risk First Street
- Flood 1/10 Low FEMA zone X (unshaded) · 0% chance over 30 yrs
- Wildfire 1/10 Low
- Heat 3/10 Moderate 6 d/yr ≥96°F today · 15 d/yr by 30 yrs out
- Wind 2/10 Low
- Air quality 4/10 Moderate 5 unhealthy d/yr today · 7 by 30 yrs out
Nearby sold comps map
Loading sold comps map…
Walkable amenities ~0.75 mi
Loading nearby amenities…
Taxation est. · year 1
- Rental income
- $20,236
- − Mortgage interest
- −$7,282
- − Property taxes
- −$3,980
- − Insurance
- −$650
- − Repairs & maintenance
- −$1,619
- − Management
- −$1,619
- − Depreciation
- −$3,782
- Taxable income
- $1,304
- Est. tax owed @ 24.0%
- −$313
- After-tax cash flow
- $2,863/yr
For passive investors: Depreciation is non-cash, so a rental often shows a tax loss while cash-flowing — sheltering income. Rental losses are passive: they offset passive income freely, and up to $25,000/yr can offset ordinary (W-2) income if you actively participate and your MAGI is under $100k (phasing out to $0 by $150k); unused losses carry forward. On sale, claimed depreciation is recaptured at up to 25%, and gains may owe capital-gains tax (a 1031 exchange can defer both). Figures are a year-1 estimate at your 24.0% rate — not tax advice; consult a CPA.
Schools (NCES district)
- District
- Penn Hills SD
- NCES district ID
- 4218590
- Math proficiency
- 13% ▼ -6.00%
- Reading proficiency
- 24% ▼ -14.00%
- Median HH income
- $47,794
- Composite
- 16.42/100
- National rank
- #9192
- State rank
- #496 of 539 in PA
Livability — Penn Hills
No livability data for this city. (Only ~50 U.S. cities are tracked.)
Census & demographics
- County
- Allegheny County · 1,022,028 people
- Metro
- Pittsburgh, PA
- Population (ZIP)
- 15,798
- Household income
- $66,757
- Rent vs Own
- Severe rent burden
- 511.0
Population outlook (Allegheny County) Hauer SSP2
- Today (2025)
- 1,250,282 people
- By 2030
- 1,256,482 · +0.5%
- By 2040
- 1,256,318 · +0.5%
- By 2050
- 1,244,169 · -0.5%
- By 2075
- 1,197,693 · -4.2%
- By 2100
- 1,093,187 · -12.6%
Race, ethnicity, and origin ACS 2023
- Neighborhood character
- Predominantly White (69%)
- Race & ethnicity
- White 69% Black 21% Two or more races 6% Hispanic / Latino 4%
- Common ancestry
- Romanian 6% Slovak 2% Serbian 1%
- Foreign-born
- 3% · Canada
- Languages at home
- 95% English-only · Spanish 3% Other Indo-European 1%
Political lean MEDSL · Allegheny
- 2024 margin
- Strong D (+20.3) · D 59.7% · R 39.4%
- 2008→2024 swing
- +4.8pp toward D · 2008: 15.5pp · 2024: 20.3pp
- All cycles
- 2024: D+20.3 2020: D+20.4 2016: D+16.4 2012: D+14.4 2008: D+15.5
Not yet ingested
- Civics
- —
Market trends
- HPI YoY
- ▼ -87.47%
- Current HPI
- 249.3773
- Rent YoY
- —
- Metro
- Pittsburgh, PA
- State GDP YoY
- ▲ 1.68%
- F500 in state
- 34
Industry mix (Fortune 500 HQ in PA)
| Industry | F500 HQs | Revenue |
|---|---|---|
| Healthcare | 2 | $309B |
|
||
| Insurance | 2 | $27B |
|
||
| Telecommunications / Media | 1 | $124B |
|
||
| Industrial Distribution | 1 | $22B |
|
||
| Financial Services | 1 | $20B |
|
||
| Chemicals / Materials | 1 | $18B |
|
||
Price history
+47.9% since first listed5 events — show timeline
- 2026-04-07 Contingent — West Penn MLS
- 2026-03-24 Listed $130,000 West Penn MLS
- 2003-07-31 Sold (Public Records) $87,000 Public Records
- 2003-07-25 Sold (MLS) $87,000 West Penn MLS
- 2003-04-25 Listed $87,900 West Penn MLS
Property tax history
+4.1%/yrLatest (2026): $3,980 · +25.5% YoY. Source: county tax records.
Cash-flow waterfall
monthlySold comps — $/sqft
last 12 mo · ≤1 miLoading sold comps…