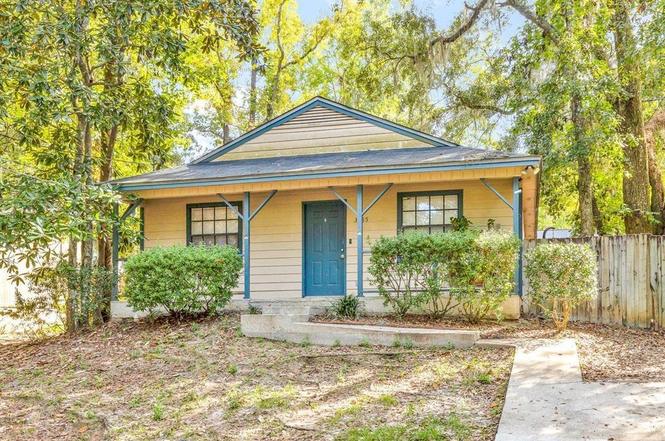
3085 Manison Ln · Tallahassee, FL
Flood risk 1/10 · Minimal
- FEMA flood zone
- X (unshaded)
- Chance of flooding over 30 yrs
- 0.0%
- Est. flood insurance / yr
- $507 – $1,088
Fire risk 3/10 · Minor
- Est. fire insurance / yr
- $947 – $1,759
Heat risk 8/10 · Major
- Hot days now (above 108°F)
- 7 days/yr
- Hot days in 30 yrs
- 21 days/yr
Wind risk 9/10 · Severe
- Chance of severe wind over 30 yrs
- 99.0%
Air-quality risk 4/10 · Minor
- Unhealthy air days now
- 6 days/yr
- Unhealthy air days in 30 yrs
- 7 days/yr
Risk factors via First Street. Map © Google.
Why this score? — see what drove the C- grade
The composite is a weighted blend of 9 inputs, each scored 0–100. Each bar is that input's sub-score; the figure is the points it added to the 100-point composite (weight × sub-score).
- ARV discount +15.0/15.0
- Cash flow +13.4/30.0
- Schools +4.3/10.0
- Livability +4.3/5.0
- DSCR +4.0/10.0
- Rent growth +3.5/5.0
- 1% rule +3.2/10.0
- Condition / age +2.5/5.0
- Appreciation +0.0/10.0
$210,000
🖨 Deal sheet 📄 Offer letter ✓ Due diligence
Listing remarks MLS
Nestled just minutes from downtown Tallahassee and the Capitol Park, this spacious 3 bedroom 2 bath house feels larger than sq. ft reflects. Conveniently close to all major highways leading around Tallahassee for an easy commute when needed. Perfect opportunity to add personal touch and make this house a home.
Key facts
- Newer roof
- Conveniently located
- 6,969 sq ft lot
Tags
Property features AI
Finance
- Other: No additional financial details provided
- Financial info: Offered for sale
- HOA & community: No HOA information provided
Exterior
- Parking: Driveway
- Security: No security features listed
- Utilities: Electric heating and cooling
- Home design: Wood siding construction
- Construction: Wood siding
- Exterior features: Paved road access; Lot approximately 0.16 acre
Interior
- Kitchen: Dishwasher; Disposal; Oven; Range; Refrigerator
- Bedrooms: Bedroom 2 — 14 x 11; Bedroom 3 — 12 x 11
- Flooring: Plank flooring; Vinyl flooring
- Bathrooms: 2 full bathrooms
- Heating & cooling: Central heating (electric); Central air conditioning (electric); Ceiling fans
- Interior features: Split bedroom floor plan; No additional interior features listed
- Laundry & utility: No laundry or utility details provided
Neighborhood map
What this means for you Summary
Snapshot
- This is a 3-bed/2.0-bath single-family listed at $210k.
Deal economics
- At list price, monthly cash flow is $5 ($64/yr) — positive.
- The deal already cash-flows at list — no discount required.
- To meet the 1% rule (rent ≥ 1% of price), the offer needs to be $173k (17.6% below list).
- Recommended offer: $173k (17.6% below list) — sets the bar for 1% rule.
- Cap rate 6.3% vs local median 4.2% in Tallahassee — top-decile yield for the area; either an underpriced asset or a hidden risk that comps aren't pricing in. Stress-test before assuming the spread holds.
Location & tenants
- Location reads 86/100 on livability (#19 in FL, #429 nationally) — a professional / high-income tenant draw. Strengths: amenities A+, commute A+, health & safety A+; Watch: employment D.
- Leon (urban): math 48% / reading 53% proficiency, ranked #33 of 73 in FL (top 45%) — acceptable for families but not a draw, mixed tenant base, ~2y average lease.
- Market conditions: Rents rising fast (+4.2%/yr); 121 active listings in the ZIP; 22 comparable units currently listed for rent nearby; rentals at typical pace (median 21d on market — plan ~3-4 weeks tenant-placement turnaround); 1,765 units permitted in Leon County in 2024 (975 in 5+ unit buildings).
- This rent runs 41% of the median local income ($51k/yr) — at the standard rent-burdened threshold; future hikes will face affordability resistance.
Forward outlook
- Local home prices are declining (-3.0%/yr); year-one equity from $1k of loan paydown is wiped out by about $6k of value loss. Plan a longer hold.
- Leon County population projected at +23% by 2050 — long-run rental-demand tailwind backs the buy-and-hold thesis.
Negotiation context
- Only 1 days on market — expect competitive offers; lowballing is unlikely to land.
- 3 sale attempts since 7y ago with the ask held roughly flat each time — persistent listings suggest the price (not the market) is what's stuck; bring a comps-based counter.
- Current owner paid $177k; 19% above their basis — modest negotiation headroom, anchor on the comps not their cost.
Risks & watch-outs
- Climate carrying-cost: severe wind risk, 99% chance of damaging wind over 30y; extreme-heat days projected 7→21/yr by 2055 (HVAC capex compounding) — expect insurance premiums to compound above CPI over the hold.
Questions for the listing agent
- Is there a deadline driving the sale (1031 exchange, divorce, estate, relocation)? That informs how much negotiation room exists.
- Schools are B-rated — typically a magnet for longer-tenancy family renters. What's the average tenant stay here, and is there a school-zone premium baked into asking?
- What's the average days-on-market for RENTAL listings here right now (not sales)? A rising rental-DOM trend means longer vacancies and softer asking-rent achievability than the comps imply.
- What's the recent tenant-quality profile in this submarket — average credit score on applications, eviction rate, late-payment / NSF rate, and stable-employment percentage? A property-management company in the area should have these aggregated.
- How much new for-sale + rental construction is in the pipeline within 1–3 miles? Heavy new supply typically softens prices + rents 12–24 months out; constrained supply supports both.
Investment metrics
- 1% rule
- 0.82% ✗
- Cap rate
- 6.32%
- Cash-on-cash
- 0.11%
- DSCR
- 1.00
- GRM
- 10.1
CMA / ARV
- ARV (on-the-fly)
- $261,184
- Comps found
- 12
Show comp detail 12 sales within ~0.75 mi
| Address | Dist | Beds/Ba | Sqft | Sold | Price | $/sf | Match |
|---|---|---|---|---|---|---|---|
| 2934 Modred Ln | 0.31mi | 3/2.0 | 1,283 (+4%) | 2mo | $273,000 | $213 | 77 |
| 439 Grail Dr | 0.39mi | 3/2.0 | 1,293 (+5%) | 1mo | $275,000 | $213 | 73 |
| 447 Grail Dr | 0.38mi | 3/2.0 | 1,279 (+4%) | 11mo | $287,000 | $224 | 67 |
| 2854 Morningside Dr | 0.44mi | 2/1.5 (-1) | 1,208 (-2%) | 7mo | $228,500 | $189 | 63 |
| 1111 Idlewild Dr | 0.73mi | 3/2.0 | 1,222 (-1%) | 5mo | $219,900 | $180 | 61 |
| 2810 Morningside Dr | 0.61mi | 3/2.0 | 1,320 (+7%) | 1mo | $290,000 | $220 | 59 |
| 3424 Miami Dr | 0.73mi | 3/2.5 | 1,272 (+3%) | 2mo | $209,000 | $164 | 57 |
| 3420 Orlando Dr | 0.72mi | 4/2.0 (+1) | 1,344 (+9%) | 0mo | $182,000 | $135 | 46 |
| 1128 Carrin Dr | 0.56mi | 3/2.0 | 1,368 (+11%) | 13mo | $195,000 | $143 | 44 |
| 119 Dawn Lauren Ln | 0.71mi | 3/2.0 | 1,179 (-4%) | 19mo | $255,000 | $216 | 44 |
| 1122 Rosewood | 0.60mi | 3/2.0 | 1,356 (+10%) | 19mo | $272,500 | $201 | 39 |
| 1115 Beachum Dr | 0.63mi | 3/2.0 | 1,404 (+14%) | 20mo | $297,500 | $212 | 31 |
Match score weights: distance 35% · size 25% · config 20% · recency 20%. Top-matched comps best support the ARV.
Projected returns pro-forma
-3.0% appreciation · 4.16% rent growth · sell at horizon
- IRR
- -14.9%
- Equity multiple
- 0.46×
- Total profit
- $-31,676
- Equity at exit
- $31,312
- IRR
- -4.6%
- Equity multiple
- 0.68×
- Total profit
- $-18,679
- Equity at exit
- $18,157
Cash invested: $58,800 (down + closing). Projections, not guarantees.
Landlord ↔ Tenant lean methodology
- Overall (STATE)
- 87 Strongly Landlord-Friendly
- State Florida
- 87 Strongly Landlord-Friendly · R+3
- County
- — inherits STATE
- City
- — inherits STATE
ZIP-level market 32301
- Rents YoY
- 4.2%
- Active inventory
- 121
- Price-to-rent
- 10.1×
Monthly cashflow live
- Estimated rent
- $1,730 high interval (Pro) →
- Mortgage (P&I)
- −$1,101
- Tax from tax record
- −$173 /mo · $2,075/yr
- Insurance
- −$88
- HOA
- −$0
- Vacancy / Maint / Mgmt
- −$363
- Net cashflow
- $5
Break-even live
UW: 25.0% down · 7.5% · 30yr · 1.5% tax · 5.0% vac · 8.0% maint · 8.0% mgmt
Financing live
Cash to close
- Down payment
- $52,500
- Closing costs
- $6,300
- Reserves months
- —
- Total cash needed
- —
Loan-product check · same deal, 3 products live
Conventional
25% down · 7.5% · 30yr
- Down + closing
- —
- Monthly P&I
- —
- Monthly cashflow
- —
- DSCR
- —
- Eligible?
- —
Personal DTI + credit; lowest rate.
DSCR
20% down · 8.5% · 30yr
- Down + closing
- —
- Monthly P&I
- —
- Monthly cashflow
- —
- DSCR
- —
- Eligible?
- —
No personal income docs; deal must DSCR.
Hard money
10% down · 12.0% · 12mo
- Down + closing
- —
- Monthly P&I
- —
- Monthly cashflow
- —
- DSCR
- —
- Eligible?
- —
Short-term bridge; refi at stabilization.
Rent comps 22 comps
| Address | Beds | Baths | Sqft | Rent | $/sqft | DOM | Units | Dist |
|---|---|---|---|---|---|---|---|---|
| 3148 Dick Wilson Blvd Tallahassee, FL | 1.0–3.0 | 1.0–2.0 | 1536 | $1,940 | $1.26 | 13d | 14 | 0.32mi |
| 2902 Battle Mountain Rd Tallahassee, FL | 2.0 | 2.0 | 1160 | $1,324 | $1.14 | 21d | 4 | 0.44mi |
| 430 Grail Ct Tallahassee, FL | 3.0 | 2.0 | 1252 | $2,300 | $1.84 | 21d | 1 | 0.45mi |
| 432 Merlin Way Tallahassee, FL | 3.0 | 2.0 | 1453 | $2,150 | $1.48 | 21d | 1 | 0.63mi |
| 2912 Capital Park Dr Tallahassee, FL | 3.0 | 2.0 | 1236 | $1,650 | $1.33 | 13d | 1 | 0.69mi |
| 2750 Old Saint Augustine Rd Tallahassee, FL | 1.0–3.0 | 1.0–2.0 | 1230 | $1,739 | $1.41 | 21d | 2 | 0.76mi |
| 1736 Augustine Pl Tallahassee, FL | 3.0 | 2.0 | 1400 | $2,000 | $1.43 | 21d | 1 | 0.76mi |
| 3373 Apalachee Pkwy Tallahassee, FL | 1.0–2.0 | 1.0–2.0 | 779 | $1,258 | $1.61 | 13d | 1 | 0.80mi |
| 599 Chicopee Ct Unit D Tallahassee, FL | 2.0 | 1.0 | 900 | $1,095 | $1.22 | 21d | 1 | 0.83mi |
| 581 Holyoke Ct Apt C Tallahassee, FL | 2.0 | 1.0 | 995 | $1,125 | $1.13 | 21d | 1 | 0.87mi |
| 410 Victory Garden Dr Tallahassee, FL | 1.0–3.0 | 1.0–2.5 | 1183 | $1,695 | $1.43 | 21d | 1 | 0.97mi |
| 2102 E Park Ave Tallahassee, FL | 1.0–2.0 | 1.0–1.5 | 715 | $1,545 | $2.16 | 13d | 8 | 0.99mi |
| 501 S Blair Stone Rd Tallahassee, FL | 1.0–3.0 | 1.0–2.0 | 1080 | $1,605 | $1.49 | 21d | 1 | 1.01mi |
| 1515 Paul Russell Rd #85 Tallahassee, FL | 3.0 | 2.5 | 1482 | $1,400 | $0.94 | 21d | 1 | 1.15mi |
| 2250 Bluff Oak Way Tallahassee, FL | 1.0–3.0 | 1.0–2.0 | 1538 | $1,978 | $1.29 | 13d | 17 | 1.15mi |
| 2001 Old Saint Augustine Rd Tallahassee, FL | 1.0–2.0 | 1.0–2.0 | 875 | $1,436 | $1.64 | 13d | 11 | 1.19mi |
| 2074 Midyette Rd Tallahassee, FL | 2.0–3.0 | 2.0 | 1033 | $1,346 | $1.30 | 13d | 1 | 1.21mi |
| 1572 Keily Run Unit 1572 Tallahassee, FL | 2.0 | 2.0 | 1200 | $1,250 | $1.04 | 21d | 1 | 1.21mi |
| 3909 Reserve Dr Tallahassee, FL | 1.0–3.0 | 1.0–2.0 | 1220 | $1,825 | $1.50 | 13d | 1 | 1.24mi |
| 2729 Blair stone Ln Unit 1 Tallahassee, FL | 3.0 | 1.5 | 1280 | $1,550 | $1.21 | 21d | 1 | 1.36mi |
| 1942 Darryl Dr Unit 1 Tallahassee, FL | 2.0 | 2.0 | 1200 | $2,300 | $1.92 | 21d | 1 | 1.39mi |
| 1872 Darryl Dr Tallahassee, FL | 2.0 | 2.0 | 1062 | $1,500 | $1.41 | 21d | 1 | 1.42mi |
Listing history 2 events
-
2026-06-18remarks 505-char remark
-
2026-06-18$210,000 Active 1 DOM
ⓘ Source: listings_history table (triggers on properties + properties_extension) + one-shot
backfill from property_details.listing_events for pre-trigger history.
Tax reassessment forecast FL · Resets to sale price
- Current annual tax
- $2,075 · $173/mo
- Projected year-2 tax
- $2,075 · $173/mo
- Expected delta
- $0/yr ($0/mo · 0.0%)
ⓘ Screening estimate from a state-policy table — verify with the county assessor before closing.
Climate risk First Street
- Flood 1/10 Low FEMA zone X (unshaded) · 0% chance over 30 yrs
- Wildfire 3/10 Moderate
- Heat 8/10 Severe 7 d/yr ≥108°F today · 21 d/yr by 30 yrs out
- Wind 9/10 Extreme 99% chance of damaging wind over 30 yrs
- Air quality 4/10 Moderate 6 unhealthy d/yr today · 7 by 30 yrs out
Nearby sold comps map
Loading sold comps map…
Walkable amenities ~0.75 mi
Loading nearby amenities…
Taxation est. · year 1
- Rental income
- $20,765
- − Mortgage interest
- −$11,763
- − Property taxes
- −$2,075
- − Insurance
- −$1,050
- − Repairs & maintenance
- −$1,661
- − Management
- −$1,661
- − Depreciation
- −$6,109
- Taxable loss
- −$3,555
- Est. tax savings @ 24.0%
- +$853
- After-tax cash flow
- $917/yr
For passive investors: Depreciation is non-cash, so a rental often shows a tax loss while cash-flowing — sheltering income. Rental losses are passive: they offset passive income freely, and up to $25,000/yr can offset ordinary (W-2) income if you actively participate and your MAGI is under $100k (phasing out to $0 by $150k); unused losses carry forward. On sale, claimed depreciation is recaptured at up to 25%, and gains may owe capital-gains tax (a 1031 exchange can defer both). Figures are a year-1 estimate at your 24.0% rate — not tax advice; consult a CPA.
Schools (NCES district)
- District
- Leon
- NCES district ID
- 1201110
- Math proficiency
- 48% ▼ -13.00%
- Reading proficiency
- 53% ▼ -5.00%
- Median HH income
- $46,339
- Composite
- 42.84/100
- National rank
- #3131
- State rank
- #33 of 73 in FL
Livability — Tallahassee
- Score
- 86/100
- State rank
- #19
- US rank
- #429
Category grades
Schools grade is shown separately in the Schools card above.
Census & demographics
- Census place
- Tallahassee, FL
- County
- Leon County · 294,472 people
- City population
- 294,472
- Metro
- Tallahassee, FL
- Population (ZIP)
- 32,017
- Household income
- $50,942
- Rent vs Own
- Severe rent burden
- 2625.0
Population outlook (Leon County) Hauer SSP2
- Today (2025)
- 315,507 people
- By 2030
- 330,677 · +4.8%
- By 2040
- 358,465 · +13.6%
- By 2050
- 386,804 · +22.6%
- By 2075
- 465,480 · +47.5%
- By 2100
- 519,959 · +64.8%
Race, ethnicity, and origin ACS 2023
- Neighborhood character
- Diverse neighborhood (Simpson 0.61)
- Race & ethnicity
- Black 49% White 38% Hispanic / Latino 6% Two or more races 6% Asian 3%
- Hispanic origin (detail)
- Puerto Rican 1% Cuban 1%
- Common ancestry
- Slovak 2% Romanian 1% Lithuanian 1%
- Foreign-born
- 7% · Canada, China, Vietnam
- Languages at home
- 91% English-only · Spanish 4% Other Indo-European 1% French/Haitian/Cajun 1%
Political lean MEDSL · Leon
- 2024 margin
- Strong D (+21.8) · D 60.3% · R 38.5% · Other 1.2%
- 2008→2024 swing
- -2.5pp toward R · 2008: 24.3pp · 2024: 21.8pp
- All cycles
- 2024: D+21.8 2020: D+28.3 2016: D+25.1 2012: D+23.6 2008: D+24.3
Not yet ingested
- Civics
- —
Market trends
- HPI YoY
- ▼ -231.50%
- Current HPI
- 231.103
- Rent YoY
- ▲ 4.16%
- Metro
- Tallahassee, FL
- State GDP YoY
- ▲ 3.28%
- F500 in state
- 36
Industry mix (Fortune 500 HQ in FL)
| Industry | F500 HQs | Revenue |
|---|---|---|
| Industrial Technology | 2 | $29B |
|
||
| Insurance | 2 | $17B |
|
||
| Retail | 1 | $60B |
|
||
| Technology Distribution | 1 | $58B |
|
||
| Homebuilding | 1 | $35B |
|
||
| Technology Manufacturing | 1 | $35B |
|
||
Price history
+111.9% since first listed9 events — show timeline
- 2026-06-15 Listed $210,000 CATRS
- 2021-12-13 Sold (Public Records) $177,000 Public Records
- 2021-12-10 Sold (MLS) $177,000 CATRS
- 2021-11-13 Contingent — CATRS
- 2021-11-01 Listed $169,000 CATRS
- 2020-10-08 Sold (Public Records) $124,900 Public Records
- 2020-09-30 Sold (MLS) $124,900 CATRS
- 2019-11-17 Listed $124,900 CATRS
- 2004-06-24 Sold (Public Records) $99,100 Public Records
Property tax history
+2.3%/yrLatest (2025): $2,075 · +3.4% YoY. Source: county tax records.
Cash-flow waterfall
monthlySold comps — $/sqft
last 12 mo · ≤1 miLoading sold comps…