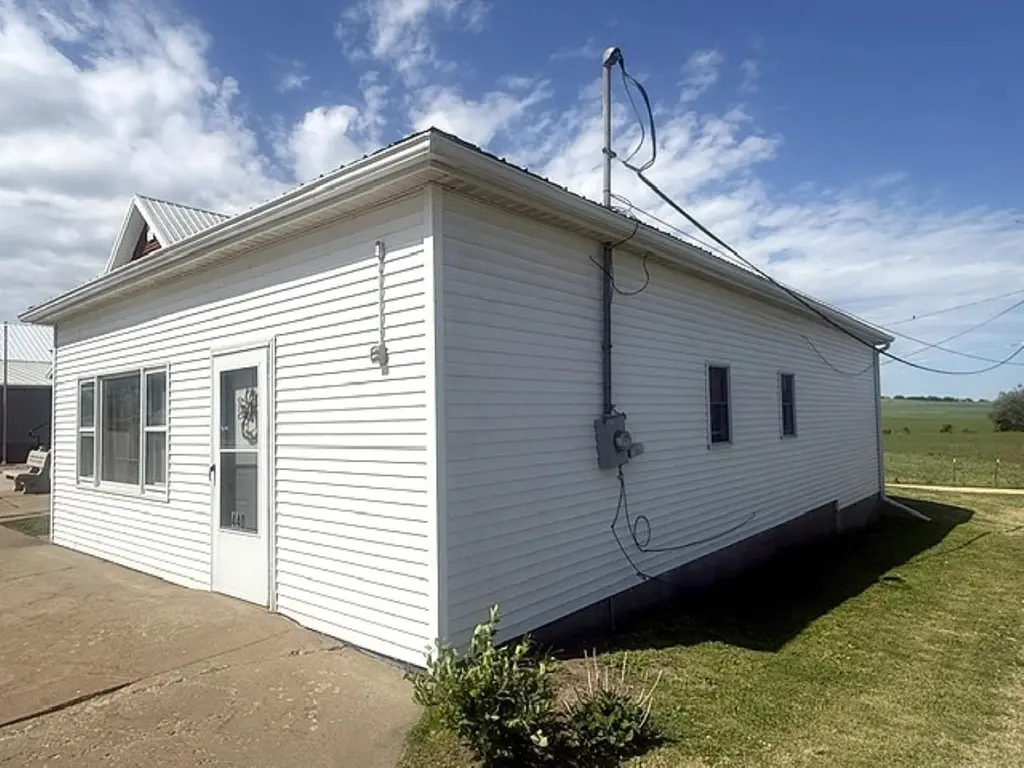
440 Ferry Rd · Miles, IA
Flood risk 1/10 · Minimal
- FEMA flood zone
- X (unshaded)
- Chance of flooding over 30 yrs
- 0.0%
- Est. flood insurance / yr
- $473 – $860
Fire risk 1/10 · Minimal
- Est. fire insurance / yr
- $902 – $1,676
Heat risk 3/10 · Minor
- Hot days now (above 101°F)
- 7 days/yr
- Hot days in 30 yrs
- 16 days/yr
Wind risk 2/10 · Minimal
- Chance of severe wind over 30 yrs
- —
Air-quality risk 3/10 · Minor
- Unhealthy air days now
- 2 days/yr
- Unhealthy air days in 30 yrs
- 3 days/yr
Risk factors via First Street. Map © Google.
Why this score? — see what drove the B grade
The composite is a weighted blend of 9 inputs, each scored 0–100. Each bar is that input's sub-score; the figure is the points it added to the 100-point composite (weight × sub-score).
- Cash flow +27.3/30.0
- DSCR +9.5/10.0
- ARV discount +7.5/15.0
- 1% rule +7.3/10.0
- Schools +5.3/10.0
- Appreciation +5.0/10.0
- Livability +3.3/5.0
- Rent growth +2.5/5.0
- Condition / age +2.5/5.0
$78,000
🖨 Deal sheet 📄 Offer letter ✓ Due diligence
Listing remarks
Very nice, well-maintained 2-bedroom home located on Main Street in the quiet town of Miles, IA. This property offers comfortable and affordable living with a convenient location. If you're looking for your first home, downsizers, or seeking small-town living this move-in ready home may be ideal for you.
Key facts
- Built 1982
- Listed 17 days
Property features AI
Exterior
- Parking: Other parking
- Utilities: Public water; Public sewer
- Home design: Single-family residence; One level; Detached
- Construction: Block foundation
- Exterior features: No notable exterior features listed; Metal roof
Interior
- Kitchen: Refrigerator; Range
- Bedrooms: 2 bedrooms on the main level
- Bathrooms: 1 full bathroom (main level)
- Heating & cooling: Central air conditioning; Forced air heating with natural gas
- Interior features: Window treatments; Partial basement
- Laundry & utility: Washer and dryer on the main level
Neighborhood map
What this means for you Summary
Snapshot
- This is a 1-bed/1.5-bath other listed at $78k.
Deal economics
- At list price, monthly cash flow is $226 ($3k/yr) — positive.
- The deal already cash-flows at list — no discount required.
- Meets the 1% rule at list price ($959 rent vs $78k).
- Recommended offer: $77k (1.5% below list) — sets the bar for market timing.
Location & tenants
- Location reads 66/100 on livability (#512 in IA) — a middle-class / working-renter tenant base. Strengths: cost of living A+, housing A+; Watch: amenities F, commute F, health & safety F.
- Easton Valley Community School District (rural): math 62% / reading 63% proficiency, ranked #218 of 289 in IA (top 75%) — acceptable for families but not a draw, mixed tenant base, ~2y average lease.
- Zoned schools: Easton Valley Elementary School (math 57% / reading 62%, grade B-, #390 of 616 statewide, top 69%, 288 students, 39% FRL); Easton Valley Junior High / High School (math 67% / reading 62%, grade B-, #211 of 336 statewide, top 70%, 211 students, 34% FRL).
- Market conditions: 7 active listings in the ZIP; 20 units permitted in Jackson County in 2024 (0 in 5+ unit buildings).
Forward outlook
- In year one you build about $3k of equity ($539 loan paydown + $2k appreciation (3.0% local appreciation)).
- Jackson County population projected at -15% by 2050 — secular population decline; favor cash flow + early exit over multi-decade hold.
- At projected returns (3.0% appreciation + 3.0% rent growth), your $22k cash investment doubles in ~4 years — after that, you're playing with house money.
Negotiation context
- It's been on market 18 days — a 2% lower offer ($77k) is reasonable based on typical stale-listing flexibility.
Questions for the listing agent
- Is there a deadline driving the sale (1031 exchange, divorce, estate, relocation)? That informs how much negotiation room exists.
- Schools are B-rated — typically a magnet for longer-tenancy family renters. What's the average tenant stay here, and is there a school-zone premium baked into asking?
- What's the average days-on-market for RENTAL listings here right now (not sales)? A rising rental-DOM trend means longer vacancies and softer asking-rent achievability than the comps imply.
- What's the recent tenant-quality profile in this submarket — average credit score on applications, eviction rate, late-payment / NSF rate, and stable-employment percentage? A property-management company in the area should have these aggregated.
- How much new for-sale + rental construction is in the pipeline within 1–3 miles? Heavy new supply typically softens prices + rents 12–24 months out; constrained supply supports both.
Investment metrics
- 1% rule
- 1.23% ✓
- Cap rate
- 9.78%
- Cash-on-cash
- 12.44%
- DSCR
- 1.55
- GRM
- 6.8
CMA / ARV
No comps found within radius.
Projected returns pro-forma
3.0% appreciation · 3.0% rent growth · sell at horizon
- IRR
- 19.2%
- Equity multiple
- 2.09×
- Total profit
- $23,828
- Equity at exit
- $35,072
- IRR
- 20.4%
- Equity multiple
- 3.96×
- Total profit
- $64,640
- Equity at exit
- $54,050
Cash invested: $21,840 (down + closing). Projections, not guarantees.
Landlord ↔ Tenant lean methodology
- Overall (STATE)
- 83 Strongly Landlord-Friendly
- State Iowa
- 83 Strongly Landlord-Friendly · R+6
- County
- — inherits STATE
- City
- — inherits STATE
ZIP-level market 52064
- Active inventory
- 7
- Price-to-rent
- 6.8×
Monthly cashflow live
- Estimated rent
- $959 medium interval (Pro) →
- Mortgage (P&I)
- −$409
- Tax from tax record
- −$90 /mo · $1,080/yr
- Insurance
- −$32
- HOA
- −$0
- Vacancy / Maint / Mgmt
- −$201
- Net cashflow
- $226
Break-even live
UW: 25.0% down · 7.5% · 30yr · 1.5% tax · 5.0% vac · 8.0% maint · 8.0% mgmt
Financing live
Cash to close
- Down payment
- $19,500
- Closing costs
- $2,340
- Reserves months
- —
- Total cash needed
- —
Loan-product check · same deal, 3 products live
Conventional
25% down · 7.5% · 30yr
- Down + closing
- —
- Monthly P&I
- —
- Monthly cashflow
- —
- DSCR
- —
- Eligible?
- —
Personal DTI + credit; lowest rate.
DSCR
20% down · 8.5% · 30yr
- Down + closing
- —
- Monthly P&I
- —
- Monthly cashflow
- —
- DSCR
- —
- Eligible?
- —
No personal income docs; deal must DSCR.
Hard money
10% down · 12.0% · 12mo
- Down + closing
- —
- Monthly P&I
- —
- Monthly cashflow
- —
- DSCR
- —
- Eligible?
- —
Short-term bridge; refi at stabilization.
Listing history 14 events
-
2026-06-19days on market $78,000 Active 18 DOM
-
2026-06-18days on market $78,000 Active 17 DOM
-
2026-06-17days on market $78,000 Active 16 DOM
-
2026-06-16days on market $78,000 Active 15 DOM
-
2026-06-15days on market $78,000 Active 14 DOM
-
2026-06-14days on market $78,000 Active 12 DOM
-
2026-06-12days on market $78,000 Active 11 DOM
-
2026-06-09days on market $78,000 Active 8 DOM
-
2026-06-08days on market $78,000 Active 7 DOM
-
2026-06-07days on market $78,000 Active 6 DOM
-
2026-06-05days on market $78,000 Active 4 DOM
-
2026-06-03days on market $78,000 Active 2 DOM
-
2026-06-01remarks 305-char remark
-
2026-06-01$78,000 Active 1 DOM
ⓘ Source: listings_history table (triggers on properties + properties_extension) + one-shot
backfill from property_details.listing_events for pre-trigger history.
Tax reassessment forecast IA · Partial reset (capped growth)
- Current annual tax
- $1,080 · $90/mo
- Projected year-2 tax
- $1,152 · $96/mo
- Expected delta
- +$72/yr (+$6/mo · 6.7%)
ⓘ Screening estimate from a state-policy table — verify with the county assessor before closing.
Climate risk First Street
- Flood 1/10 Low FEMA zone X (unshaded) · 0% chance over 30 yrs
- Wildfire 1/10 Low
- Heat 3/10 Moderate 7 d/yr ≥101°F today · 16 d/yr by 30 yrs out
- Wind 2/10 Low
- Air quality 3/10 Moderate 2 unhealthy d/yr today · 3 by 30 yrs out
Nearby sold comps map
Loading sold comps map…
Walkable amenities ~0.75 mi
Loading nearby amenities…
Taxation est. · year 1
- Rental income
- $11,514
- − Mortgage interest
- −$4,369
- − Property taxes
- −$1,080
- − Insurance
- −$390
- − Repairs & maintenance
- −$921
- − Management
- −$921
- − Depreciation
- −$2,269
- Taxable income
- $1,563
- Est. tax owed @ 24.0%
- −$375
- After-tax cash flow
- $2,342/yr
For passive investors: Depreciation is non-cash, so a rental often shows a tax loss while cash-flowing — sheltering income. Rental losses are passive: they offset passive income freely, and up to $25,000/yr can offset ordinary (W-2) income if you actively participate and your MAGI is under $100k (phasing out to $0 by $150k); unused losses carry forward. On sale, claimed depreciation is recaptured at up to 25%, and gains may owe capital-gains tax (a 1031 exchange can defer both). Figures are a year-1 estimate at your 24.0% rate — not tax advice; consult a CPA.
Schools (NCES district)
- District
- Easton Valley Community School District
- NCES district ID
- 1910130
- Math proficiency
- 62% ▼ -2.00%
- Reading proficiency
- 63% ▬ 0.00%
- Median HH income
- $51,496
- Composite
- 53.29/100
- National rank
- #1484
- State rank
- #218 of 289 in IA
Livability — Miles
- Score
- 66/100
- State rank
- #512
- US rank
- #11390
Category grades
Schools grade is shown separately in the Schools card above.
Census & demographics
- Census place
- Miles, IA
- Population (ZIP)
- 727
Population outlook (Jackson County) Hauer SSP2
- Today (2025)
- 18,736 people
- By 2030
- 18,227 · -2.7%
- By 2040
- 17,049 · -9.0%
- By 2050
- 15,848 · -15.4%
- By 2075
- 13,660 · -27.1%
- By 2100
- 11,167 · -40.4%
Race, ethnicity, and origin ACS 2023
- Neighborhood character
- Predominantly White (97%)
- Race & ethnicity
- White 97% Two or more races 3%
- Common ancestry
- Danish 3% Iranian 3% Italian 1%
- Foreign-born
- 1% · Canada
- Languages at home
- 98% English-only · Spanish 1%
Political lean MEDSL · Jackson
- 2024 margin
- Solid R (+32.5) · D 33.1% · R 65.6% · Other 1.3%
- 2008→2024 swing
- -56.9pp toward R · 2008: 24.4pp · 2024: -32.5pp
- All cycles
- 2024: R+32.5 2020: R+26.1 2016: R+19.4 2012: D+16.8 2008: D+24.4
Not yet ingested
- Civics
- —
Market trends
- HPI YoY
- —
- Current HPI
- —
- Rent YoY
- —
- Metro
- —
- State GDP YoY
- ▲ 2.48%
- F500 in state
- 4
Industry mix (Fortune 500 HQ in IA)
| Industry | F500 HQs | Revenue |
|---|---|---|
| Financial Services | 1 | $16B |
|
||
| Retail / Convenience | 1 | $15B |
|
||
Price history
1 event — show timeline
- 2026-06-01 Listed $78,000 ECIMLS
Property tax history
+5.3%/yrLatest (2025): $1,080 · +4.9% YoY. Source: county tax records.
Cash-flow waterfall
monthlySold comps — $/sqft
last 12 mo · ≤1 miLoading sold comps…