122 Ward Ave · Towanda, PA
Flood risk 6/10 · Moderate
- FEMA flood zone
- X (unshaded)
- Chance of flooding over 30 yrs
- 0.68%
- Est. flood insurance / yr
- $507 – $1,088
Fire risk 1/10 · Minimal
- Est. fire insurance / yr
- $511 – $949
Heat risk 3/10 · Minor
- Hot days now (above 95°F)
- 7 days/yr
- Hot days in 30 yrs
- 16 days/yr
Wind risk 2/10 · Minimal
- Chance of severe wind over 30 yrs
- 2.0%
Air-quality risk 2/10 · Minimal
- Unhealthy air days now
- 0 days/yr
- Unhealthy air days in 30 yrs
- 1 days/yr
Risk factors via First Street. Map © Google.
Why this score? — see what drove the B+ grade
The composite is a weighted blend of 9 inputs, each scored 0–100. Each bar is that input's sub-score; the figure is the points it added to the 100-point composite (weight × sub-score).
- Cash flow +30.0/30.0
- ARV discount +15.0/15.0
- 1% rule +10.0/10.0
- DSCR +10.0/10.0
- Livability +3.6/5.0
- Schools +3.3/10.0
- Rent growth +2.5/5.0
- Condition / age +2.5/5.0
- Appreciation +0.0/10.0
$59,000
🖨 Deal sheet 📄 Offer letter ✓ Due diligence
Listing remarks MLS
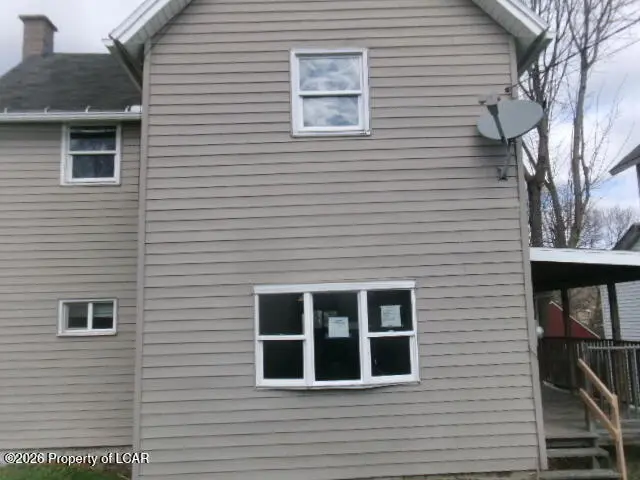
Great in town property! This 2BR 1 FB two story home is located on a quiet street and is close to schools and in town conveniences! The first floor offers a huge living room, dining room, spacious kitchen, and full bath with washer and dryer! The second-floor features 2 spacious bedrooms and a landing at the top of the steps with built in shelving and extra storage space! The natural gas furnace and water heater have been recently installed! The large yard is fenced in and offers two large storage sheds! With vinyl siding, newer vinyl replacement windows, newer roof, and newer side porch, the exterior is virtually maintenance free! Don't miss this great home at a great price!
Key facts
- Close to schools
- Formal dining room
- Spacious kitchen
Tags
Property features AI
Exterior
- Utilities: Public water; Public sewer
- Home design: Single-family residence; Two levels
- Construction: Vinyl siding
- Exterior features: Lot in a residential zone
Interior
- Bathrooms: 1 full bathroom
- Heating & cooling: Natural gas heating; Forced air heating
- Interior features: Basement with dirt floor; Total of 5 rooms
Neighborhood map
What this means for you Summary
Snapshot
- This is a 2-bed/1.0-bath single-family listed at $59k.
Deal economics
- At list price, monthly cash flow is $347 ($4k/yr) — positive.
- The deal already cash-flows at list — no discount required.
- Meets the 1% rule at list price ($1k rent vs $59k).
Location & tenants
- Location reads 72/100 on livability (#661 in PA) — a middle-class / working-renter tenant base. Strengths: cost of living A+, health & safety A+, housing A; Watch: amenities D, employment D, commute F.
- Towanda Area SD (town): math 32% / reading 45% proficiency, ranked #372 of 539 in PA (top 69%) — families likely to look elsewhere, expect single-tenant / working-renter base with shorter leases.
- Market conditions: 74 active listings in the ZIP; 66 units permitted in Bradford County in 2024 (0 in 5+ unit buildings).
Forward outlook
- Local home prices are declining (-3.0%/yr); year-one equity from $408 of loan paydown is wiped out by about $2k of value loss. Plan a longer hold.
- Bradford County population projected at -23% by 2050 — secular population decline; favor cash flow + early exit over multi-decade hold.
- At projected returns (-3.0% appreciation + 3.0% rent growth), your $17k cash investment doubles in ~5 years — after that, you're playing with house money.
Negotiation context
- Only 9 days on market — expect competitive offers; lowballing is unlikely to land.
- 2 sale attempts since 4y ago with the ask held roughly flat each time — persistent listings suggest the price (not the market) is what's stuck; bring a comps-based counter.
Risks & watch-outs
- Climate carrying-cost: major flood risk — expect insurance premiums to compound above CPI over the hold.
Questions for the listing agent
- Is there a deadline driving the sale (1031 exchange, divorce, estate, relocation)? That informs how much negotiation room exists.
- What's the average days-on-market for RENTAL listings here right now (not sales)? A rising rental-DOM trend means longer vacancies and softer asking-rent achievability than the comps imply.
- What's the recent tenant-quality profile in this submarket — average credit score on applications, eviction rate, late-payment / NSF rate, and stable-employment percentage? A property-management company in the area should have these aggregated.
- How much new for-sale + rental construction is in the pipeline within 1–3 miles? Heavy new supply typically softens prices + rents 12–24 months out; constrained supply supports both.
Investment metrics
- 1% rule
- 1.72% ✓
- Cap rate
- 13.35%
- Cash-on-cash
- 25.19%
- DSCR
- 2.12
- GRM
- 4.8
CMA / ARV
- ARV (on-the-fly)
- $109,692
- Comps found
- 2
Show comp detail 2 sales within ~0.75 mi
| Address | Dist | Beds/Ba | Sqft | Sold | Price | $/sf | Match |
|---|---|---|---|---|---|---|---|
| 21 Mechanic St | 0.33mi | 2/1.0 | 1,036 (-6%) | 22mo | $103,000 | $99 | 55 |
| 219 N 4th St | 0.40mi | 2/2.0 | 948 (-14%) | 16mo | $37,800 | $40 | 40 |
Match score weights: distance 35% · size 25% · config 20% · recency 20%. Top-matched comps best support the ARV.
Projected returns pro-forma
-3.0% appreciation · 3.0% rent growth · sell at horizon
- IRR
- 18.8%
- Equity multiple
- 1.76×
- Total profit
- $12,571
- Equity at exit
- $8,797
- IRR
- 27.1%
- Equity multiple
- 3.40×
- Total profit
- $39,570
- Equity at exit
- $5,101
Cash invested: $16,520 (down + closing). Projections, not guarantees.
Landlord ↔ Tenant lean methodology
- Overall (STATE)
- 62 Landlord-Friendly
- State Pennsylvania
- 62 Landlord-Friendly · EVEN
- County
- — inherits STATE
- City
- — inherits STATE
ZIP-level market 18848
- Home prices YoY
- -21.2%
- Active inventory
- 74
- Price-to-rent
- 4.8×
Monthly cashflow live
- Estimated rent
- $1,016 medium interval (Pro) →
- Mortgage (P&I)
- −$309
- Tax from tax record
- −$122 /mo · $1,461/yr
- Insurance
- −$25
- HOA
- −$0
- Vacancy / Maint / Mgmt
- −$213
- Net cashflow
- $347
Break-even live
UW: 25.0% down · 7.5% · 30yr · 1.5% tax · 5.0% vac · 8.0% maint · 8.0% mgmt
Financing live
Cash to close
- Down payment
- $14,750
- Closing costs
- $1,770
- Reserves months
- —
- Total cash needed
- —
Loan-product check · same deal, 3 products live
Conventional
25% down · 7.5% · 30yr
- Down + closing
- —
- Monthly P&I
- —
- Monthly cashflow
- —
- DSCR
- —
- Eligible?
- —
Personal DTI + credit; lowest rate.
DSCR
20% down · 8.5% · 30yr
- Down + closing
- —
- Monthly P&I
- —
- Monthly cashflow
- —
- DSCR
- —
- Eligible?
- —
No personal income docs; deal must DSCR.
Hard money
10% down · 12.0% · 12mo
- Down + closing
- —
- Monthly P&I
- —
- Monthly cashflow
- —
- DSCR
- —
- Eligible?
- —
Short-term bridge; refi at stabilization.
Listing history 7 events
-
2026-06-12statusdays on market $59,000 Pending 9 DOM
-
2026-06-09days on market $59,000 Active 7 DOM
-
2026-06-08days on market $59,000 Active 6 DOM
-
2026-06-08days on market $59,000 Active 5 DOM
-
2026-06-07days on market $59,000 Active 4 DOM
-
2026-06-02remarks 302-char remark
-
2026-06-02$59,000 Active 1 DOM
ⓘ Source: listings_history table (triggers on properties + properties_extension) + one-shot
backfill from property_details.listing_events for pre-trigger history.
Tax reassessment forecast PA · Partial reset (capped growth)
- Current annual tax
- $1,461 · $122/mo
- Projected year-2 tax
- $1,461 · $122/mo
- Expected delta
- $0/yr ($0/mo · 0.0%)
ⓘ Screening estimate from a state-policy table — verify with the county assessor before closing.
Climate risk First Street
- Flood 6/10 Major FEMA zone X (unshaded) · 68% chance over 30 yrs
- Wildfire 1/10 Low
- Heat 3/10 Moderate 7 d/yr ≥95°F today · 16 d/yr by 30 yrs out
- Wind 2/10 Low 2% chance of damaging wind over 30 yrs
- Air quality 2/10 Low 0 unhealthy d/yr today · 1 by 30 yrs out
Nearby sold comps map
Loading sold comps map…
Walkable amenities ~0.75 mi
Loading nearby amenities…
Taxation est. · year 1
- Rental income
- $12,190
- − Mortgage interest
- −$3,305
- − Property taxes
- −$1,461
- − Insurance
- −$295
- − Repairs & maintenance
- −$975
- − Management
- −$975
- − Depreciation
- −$1,716
- Taxable income
- $3,463
- Est. tax owed @ 24.0%
- −$831
- After-tax cash flow
- $3,330/yr
For passive investors: Depreciation is non-cash, so a rental often shows a tax loss while cash-flowing — sheltering income. Rental losses are passive: they offset passive income freely, and up to $25,000/yr can offset ordinary (W-2) income if you actively participate and your MAGI is under $100k (phasing out to $0 by $150k); unused losses carry forward. On sale, claimed depreciation is recaptured at up to 25%, and gains may owe capital-gains tax (a 1031 exchange can defer both). Figures are a year-1 estimate at your 24.0% rate — not tax advice; consult a CPA.
Schools (NCES district)
- District
- Towanda Area SD
- NCES district ID
- 4223550
- Math proficiency
- 32% ▼ -10.00%
- Reading proficiency
- 45% ▼ -14.00%
- Median HH income
- $45,242
- Composite
- 32.74/100
- National rank
- #5638
- State rank
- #372 of 539 in PA
Livability — Towanda
- Score
- 72/100
- State rank
- #661
- US rank
- #6466
Category grades
Schools grade is shown separately in the Schools card above.
Census & demographics
- Census place
- Towanda, PA
- Population (ZIP)
- 8,625
Population outlook (Bradford County) Hauer SSP2
- Today (2025)
- 57,236 people
- By 2030
- 54,660 · -4.5%
- By 2040
- 49,502 · -13.5%
- By 2050
- 44,277 · -22.6%
- By 2075
- 33,420 · -41.6%
- By 2100
- 22,919 · -60.0%
Race, ethnicity, and origin ACS 2023
- Neighborhood character
- Predominantly White (96%)
- Race & ethnicity
- White 96% Black 1% Hispanic / Latino 1% Two or more races 1%
- Common ancestry
- Iranian 3% Polish 3% Romanian 3%
- Foreign-born
- 2% · Canada
- Languages at home
- 97% English-only · Spanish 2%
Political lean MEDSL · Bradford
- 2024 margin
- Solid R (+47.9) · D 25.6% · R 73.5%
- 2008→2024 swing
- -29.5pp toward R · 2008: -18.4pp · 2024: -47.9pp
- All cycles
- 2024: R+47.9 2020: R+44.9 2016: R+46.0 2012: R+24.6 2008: R+18.4
Not yet ingested
- Civics
- —
Market trends
- HPI YoY
- ▼ -42.57%
- Current HPI
- 158.5429
- Rent YoY
- —
- Metro
- —
- State GDP YoY
- ▲ 1.68%
- F500 in state
- 34
Industry mix (Fortune 500 HQ in PA)
| Industry | F500 HQs | Revenue |
|---|---|---|
| Healthcare | 2 | $309B |
|
||
| Insurance | 2 | $27B |
|
||
| Telecommunications / Media | 1 | $124B |
|
||
| Industrial Distribution | 1 | $22B |
|
||
| Financial Services | 1 | $20B |
|
||
| Chemicals / Materials | 1 | $18B |
|
||
Price history
-5.9% since first listed5 events — show timeline
- 2026-05-30 Listed $59,000 LCAR
- 2023-01-11 Sold (Public Records) $126,000 Public Records
- 2023-01-10 Sold (MLS) $126,000 NMPA
- 2022-10-06 Listed $124,900 NMPA
- 2011-02-22 Sold (Public Records) $62,700 Public Records
Property tax history
+2.5%/yrLatest (2026): $1,461 · +2.5% YoY. Source: county tax records.
Cash-flow waterfall
monthlySold comps — $/sqft
last 12 mo · ≤1 miLoading sold comps…