 🏗️ New Construction
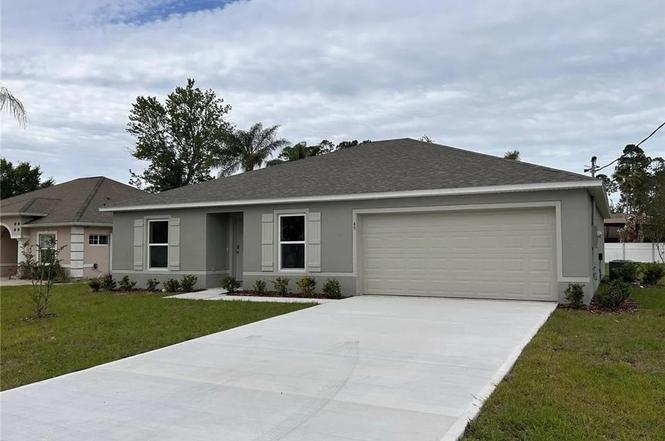
49 Bannbury Ln · Palm Coast, FL
Flood risk 4/10 · Minor
- FEMA flood zone
- X (unshaded)
- Chance of flooding over 30 yrs
- 0.2%
- Est. flood insurance / yr
- $507 – $1,088
Fire risk 2/10 · Minimal
- Est. fire insurance / yr
- $947 – $1,759
Heat risk 9/10 · Severe
- Hot days now (above 106°F)
- 7 days/yr
- Hot days in 30 yrs
- 20 days/yr
Wind risk 10/10 · Severe
- Chance of severe wind over 30 yrs
- 99.0%
Air-quality risk 2/10 · Minimal
- Unhealthy air days now
- 2 days/yr
- Unhealthy air days in 30 yrs
- 2 days/yr
Risk factors via First Street. Map © Google.
Why this score? — see what drove the F grade
The composite is a weighted blend of 9 inputs, each scored 0–100. Each bar is that input's sub-score; the figure is the points it added to the 100-point composite (weight × sub-score).
- ARV discount +7.5/15.0
- Cash flow +7.2/30.0
- Schools +4.6/10.0
- Livability +3.5/5.0
- Rent growth +2.8/5.0
- Condition / age +2.5/5.0
- 1% rule +2.0/10.0
- DSCR +1.4/10.0
- Appreciation +0.0/10.0
$5,000
🖨 Deal sheet 📄 Offer letter ✓ Due diligence
Listing remarks MLS
MOVE-IN READY TODAY NEW CONSTRUCTION! OWNER FINANCING IS AVAILABLE AT 10% DOWN 6% INTEREST! Enjoy this 3 Bed/2 Bath split floor plan home with open concept that's ready for a new family. Greeted from the entryway is a Family room to the left and the dining room to the right. The dining room leads into the spacious kitchen open to the living room with a breakfast bar. Cook a family dinner in the spacious kitchen with all new whirlpool appliances. Watch your favorite movie in the spacious living room with a sliding glass door that leads out to the back patio and large yard for entertaining during those cool spring nights. The 2 spacious bedrooms are separated from the owner's suite and share a large bath with tub/shower combo. Relax in the spacious owner's suite and ensuite bathroom with large walk-in shower, a walk-in closet, and vanity sink. Washer/Dryer hookup in the laundry room that leads to the 2-car garage. This home is located near public schools, community centers, shopping and more that Palm Coast offers. CALL TODAY MOVE IN TOMORROW! This home is also available for lease or lease-to-own.
Key facts
- 0.23 acre lot
- 2 garage spots
- Built 2023
Property features AI
Exterior
- Parking: 2-car garage
- Utilities: Other water source; Other sewer
- Home design: Single-family residence; One level
- Construction: Construction details: see remarks
- Exterior features: Front porch; Other roof
Interior
- Bedrooms: 1 total room
- Flooring: Other
- Bathrooms: 2 full bathrooms
- Heating & cooling: No heating; No cooling
- Interior features: Other flooring
Neighborhood map
What this means for you Summary
Snapshot
- This is a 3-bed/2.0-bath single-family listed at $5k.
Deal economics
- At list price, monthly cash flow is $-404 ($-5k/yr) — negative.
- The deal already cash-flows at list — no discount required.
- Meets the 1% rule at list price ($2k rent vs $5k).
- Cap rate 4.6% vs local median 3.8% in Palm Coast — meaningfully above typical; check what's discounted (condition, days-on-market, listing class) to confirm the premium yield is real.
Location & tenants
- Location reads 69/100 on livability (#478 in FL) — a middle-class / working-renter tenant base. Strengths: housing A+, health & safety A+, cost of living B+; Watch: amenities F, commute F.
- Flagler (rural): math 53% / reading 56% proficiency, ranked #20 of 73 in FL (top 27%) — acceptable for families but not a draw, mixed tenant base, ~2y average lease.
- Market conditions: Rents rising (+1.2%/yr); 1367 active listings in the ZIP; 32 comparable units currently listed for rent nearby; rentals at typical pace (median 14d on market — plan ~3-4 weeks tenant-placement turnaround); solid renter incomes; 2,588 units permitted in Flagler County in 2024 (0 in 5+ unit buildings).
- This rent runs 32% of the median local income ($76k/yr) — at the standard rent-burdened threshold; future hikes will face affordability resistance.
Forward outlook
- Local home prices are declining (-3.0%/yr); year-one equity from $2k of loan paydown is wiped out by about $9k of value loss. Plan a longer hold.
- Flagler County population projected at +28% by 2050 — long-run rental-demand tailwind backs the buy-and-hold thesis.
Negotiation context
- Only 7 days on market — expect competitive offers; lowballing is unlikely to land.
- 5 sale attempts since 5y ago with the ask held roughly flat each time — persistent listings suggest the price (not the market) is what's stuck; bring a comps-based counter.
Risks & watch-outs
- Watch-outs: property tax is 88.5% of price.
- Climate carrying-cost: severe wind risk, 99% chance of damaging wind over 30y; extreme-heat days projected 7→20/yr by 2055 (HVAC capex compounding) — expect insurance premiums to compound above CPI over the hold.
Questions for the listing agent
- What do current leases actually rent for vs. the listed asking? Can we see a recent rent roll and the last 12 months of T-12 income?
- Property tax is high relative to price — has the assessment been appealed recently, and will the sale trigger a re-assessment?
- Is there a deadline driving the sale (1031 exchange, divorce, estate, relocation)? That informs how much negotiation room exists.
- The area grade is low — what's the realistic commute time and amenity access for the typical tenant pool here? Any planned neighborhood developments (good or bad) we should know about?
- What's the average days-on-market for RENTAL listings here right now (not sales)? A rising rental-DOM trend means longer vacancies and softer asking-rent achievability than the comps imply.
- What's the recent tenant-quality profile in this submarket — average credit score on applications, eviction rate, late-payment / NSF rate, and stable-employment percentage? A property-management company in the area should have these aggregated.
- How much new for-sale + rental construction is in the pipeline within 1–3 miles? Heavy new supply typically softens prices + rents 12–24 months out; constrained supply supports both.
Investment metrics
- 1% rule
- 0.70% ✗
- Cap rate
- 4.65%
- Cash-on-cash
- -5.87%
- DSCR
- 0.74
- GRM
- 11.9
CMA / ARV
- ARV (on-the-fly)
- $294,880
- Comps found
- 12
Show comp detail 12 sales within ~0.75 mi
| Address | Dist | Beds/Ba | Sqft | Sold | Price | $/sf | Match |
|---|---|---|---|---|---|---|---|
| 171 Bayside Dr | 0.40mi | 3/2.0 | 1,497 (-4%) | 0mo | $180,000 | $120 | 75 |
| 10 Barring | 0.27mi | 3/2.0 | 1,663 (+7%) | 3mo | $305,000 | $183 | 73 |
| 102 Beauford Ln | 0.47mi | 3/2.0 | 1,500 (-3%) | 1mo | $361,500 | $241 | 71 |
| 33 Bannerwood Ln | 0.08mi | 3/2.0 | 1,336 (-14%) | 3mo | $279,900 | $210 | 71 |
| 57 Botany Ln | 0.58mi | 3/2.0 | 1,535 (-1%) | 1mo | $245,000 | $160 | 70 |
| 48 Bradmore Ln | 0.56mi | 4/2.0 (+1) | 1,574 (+1%) | 3mo | $315,000 | $200 | 64 |
| 32 Barkley Ln | 0.58mi | 3/2.0 | 1,471 (-5%) | 2mo | $338,000 | $230 | 62 |
| 19 Barrington Dr | 0.43mi | 3/2.0 | 1,379 (-11%) | 0mo | $245,000 | $178 | 61 |
| 29 Beckner Ln | 0.57mi | 3/2.0 | 1,668 (+8%) | 1mo | $282,000 | $169 | 60 |
| 123 Boulder Rock Dr | 0.64mi | 3/2.0 | 1,668 (+8%) | 0mo | $366,000 | $219 | 58 |
| 15 Botany Ln | 0.68mi | 3/2.0 | 1,368 (-12%) | 2mo | $257,900 | $189 | 47 |
| 7 Beechwood Ln | 0.58mi | 3/2.0 | 1,768 (+14%) | 3mo | $336,000 | $190 | 47 |
Match score weights: distance 35% · size 25% · config 20% · recency 20%. Top-matched comps best support the ARV.
Projected returns pro-forma
-3.0% appreciation · 1.18% rent growth · sell at horizon
- IRR
- -28.4%
- Equity multiple
- 0.07×
- Total profit
- $-77,197
- Equity at exit
- $43,968
- IRR
- -36.4%
- Equity multiple
- -0.39×
- Total profit
- $-114,937
- Equity at exit
- $25,496
Cash invested: $82,566 (down + closing). Projections, not guarantees.
Landlord ↔ Tenant lean methodology
- Overall (STATE)
- 87 Strongly Landlord-Friendly
- State Florida
- 87 Strongly Landlord-Friendly · R+3
- County
- — inherits STATE
- City
- — inherits STATE
ZIP-level market 32164
- Home prices YoY
- -6.3%
- Rents YoY
- 1.2%
- Active inventory
- 1367
- Price-to-rent
- 0.2×
Monthly cashflow live
- Estimated rent
- $2,068 high interval (Pro) →
- Mortgage (P&I)
- −$1,546
- Tax est. 1.5%
- −$369 /mo · $4,423/yr
- Insurance
- −$123
- HOA
- −$0
- Vacancy / Maint / Mgmt
- −$434
- Net cashflow
- $-404
Break-even live
UW: 25.0% down · 7.5% · 30yr · 1.5% tax · 5.0% vac · 8.0% maint · 8.0% mgmt
Financing live
Cash to close
- Down payment
- $73,720
- Closing costs
- $8,846
- Reserves months
- —
- Total cash needed
- —
Loan-product check · same deal, 3 products live
Conventional
25% down · 7.5% · 30yr
- Down + closing
- —
- Monthly P&I
- —
- Monthly cashflow
- —
- DSCR
- —
- Eligible?
- —
Personal DTI + credit; lowest rate.
DSCR
20% down · 8.5% · 30yr
- Down + closing
- —
- Monthly P&I
- —
- Monthly cashflow
- —
- DSCR
- —
- Eligible?
- —
No personal income docs; deal must DSCR.
Hard money
10% down · 12.0% · 12mo
- Down + closing
- —
- Monthly P&I
- —
- Monthly cashflow
- —
- DSCR
- —
- Eligible?
- —
Short-term bridge; refi at stabilization.
Rent comps 32 comps
| Address | Beds | Baths | Sqft | Rent | $/sqft | DOM | Units | Dist |
|---|---|---|---|---|---|---|---|---|
| 273 Beachway Dr Palm Coast, FL | 3.0 | 2.0 | 1784 | $2,450 | $1.37 | 23d | 1 | 0.23mi |
| 24 Barring Pl Palm Coast, FL | 3.0 | 2.0 | 1668 | $1,875 | $1.12 | 23d | 1 | 0.26mi |
| 44 Barrington Dr Palm Coast, FL | 4.0 | 2.0 | 1862 | $2,250 | $1.21 | 14d | 1 | 0.35mi |
| 26 Brooklyn Ln Palm Coast, FL | 4.0 | 2.0 | 1862 | $2,250 | $1.21 | 19d | 1 | 0.60mi |
| 53 Brownstone Ln Palm Coast, FL | 4.0 | 2.0 | 1582 | $1,950 | $1.23 | 2d | 1 | 0.61mi |
| 63 Beaverdam Ln Palm Coast, FL | 3.0 | 2.0 | 1591 | $1,895 | $1.19 | 2d | 1 | 0.68mi |
| 69 Beckner Ln Unit NA Palm Coast, FL | 3.0 | 2.0 | 1412 | $1,998 | $1.42 | 2d | 1 | 0.69mi |
| 121 Pine Lakes Pkwy N Palm Coast, FL | 1.0–3.0 | 1.0–2.0 | 1090 | $1,966 | $1.80 | 2d | 10 | 0.69mi |
| 20 Bressler Ln Palm Coast, FL | 4.0 | 3.0 | 2141 | $2,060 | $0.96 | 23d | 1 | 0.83mi |
| 73 Bruce Ln Palm Coast, FL | 3.0 | 3.0 | 2245 | $2,189 | $0.98 | 2d | 1 | 0.84mi |
| 102 Brittany Ln Palm Coast, FL | 4.0 | 2.0 | 1902 | $2,450 | $1.29 | 23d | 1 | 0.86mi |
| 1 Fanshawe Ln Unit 1B Palm Coast, FL | 3.0 | 2.5 | 2085 | $2,350 | $1.13 | 23d | 1 | 0.88mi |
| 1 Fanshawe Ln Palm Coast, FL | 3.0 | 2.5 | 2085 | $2,350 | $1.13 | 14d | 1 | 0.88mi |
| 78 Belvedere Ln Palm Coast, FL | 3.0 | 2.0 | 1557 | $1,750 | $1.12 | 14d | 1 | 0.88mi |
| 101 Athens Ct Palm Coast, FL | 2.0 | 2.0 | 1170 | $1,516 | $1.30 | 2d | 15 | 0.89mi |
| 134 Beechwood Ln Palm Coast, FL | 3.0 | 2.0 | 1368 | $1,870 | $1.37 | 21d | 1 | 1.02mi |
| 55 Brittany Ln Palm Coast, FL | 3.0 | 2.0 | 1281 | $1,850 | $1.44 | 19d | 1 | 1.03mi |
| 113 Brunswick Ln Unit A Palm Coast, FL | 3.0 | 2.0 | 1198 | $1,550 | $1.29 | 2d | 1 | 1.03mi |
| 12 Bunker View Pl Palm Coast, FL | 3.0 | 2.5 | 1600 | $1,725 | $1.08 | 2d | 1 | 1.05mi |
| 32 Bunker View Dr Unit A Palm Coast, FL | 2.0 | 2.0 | 1434 | $1,500 | $1.05 | 2d | 1 | 1.11mi |
| 11 Birchtree Way Palm Coast, FL | 3.0 | 2.0 | 1360 | $1,800 | $1.32 | 2d | 1 | 1.14mi |
| 14 Bunker View Dr Unit 2 Palm Coast, FL | 3.0 | 2.0 | 1190 | $1,645 | $1.38 | 2d | 1 | 1.24mi |
| 42 Farmsworth Dr Unit A Palm Coast, FL | 3.0 | 2.0 | 1338 | $1,995 | $1.49 | 2d | 1 | 1.29mi |
| 34 Bunker Ln Palm Coast, FL | 4.0 | 2.0 | 1733 | $2,200 | $1.27 | 23d | 1 | 1.32mi |
| 75A Wellwood Ln Palm Coast, FL | 3.0 | 2.0 | 1093 | $1,500 | $1.37 | 23d | 1 | 1.35mi |
| 116 Wellwood Ln Unit B Palm Coast, FL | 3.0 | 2.0 | 1217 | $1,475 | $1.21 | 23d | 1 | 1.35mi |
| 75 Wellwood Ln Unit A Palm Coast, FL | 3.0 | 2.0 | 1093 | $1,500 | $1.37 | 23d | 1 | 1.36mi |
| 59 Wellhaven Ln Unit B Palm Coast, FL | 3.0 | 2.0 | 1198 | $1,900 | $1.59 | 14d | 1 | 1.36mi |
| 45 Wellham Ln Unit B Palm Coast, FL | 3.0 | 2.0 | 1505 | $1,850 | $1.23 | 2d | 1 | 1.36mi |
| 129 Wellwood Ln Unit B Palm Coast, FL | 3.0 | 2.0 | 1287 | $1,650 | $1.28 | 23d | 1 | 1.39mi |
| 13 Freemont Ct Palm Coast, FL | 3.0 | 2.0 | 1637 | $2,300 | $1.41 | 2d | 1 | 1.40mi |
| 35 Wellham Ln Palm Coast, FL | 3.0 | 2.0 | 1298 | $1,750 | $1.35 | 23d | 1 | 1.42mi |
Listing history 7 events
-
2026-06-18days on market $5,000 Active 7 DOM
-
2026-06-17days on market $5,000 Active 6 DOM
-
2026-06-16days on market $5,000 Active 5 DOM
-
2026-06-15days on market $5,000 Active 4 DOM
-
2026-06-14days on market $5,000 Active 2 DOM
-
2026-06-13remarks 298-char remark
-
2026-06-13$5,000 Active 1 DOM
ⓘ Source: listings_history table (triggers on properties + properties_extension) + one-shot
backfill from property_details.listing_events for pre-trigger history.
Climate risk First Street
- Flood 4/10 Moderate FEMA zone X (unshaded) · 20% chance over 30 yrs
- Wildfire 2/10 Low
- Heat 9/10 Extreme 7 d/yr ≥106°F today · 20 d/yr by 30 yrs out
- Wind 10/10 Extreme 99% chance of damaging wind over 30 yrs
- Air quality 2/10 Low 2 unhealthy d/yr today · 2 by 30 yrs out
Nearby sold comps map
Loading sold comps map…
Walkable amenities ~0.75 mi
Loading nearby amenities…
Taxation est. · year 1
- Rental income
- $24,819
- − Mortgage interest
- −$16,518
- − Property taxes
- −$4,423
- − Insurance
- −$1,474
- − Repairs & maintenance
- −$1,986
- − Management
- −$1,986
- − Depreciation
- −$8,578
- Taxable loss
- −$10,145
- Est. tax savings @ 24.0%
- +$2,435
- After-tax cash flow
- $-2,412/yr
For passive investors: Depreciation is non-cash, so a rental often shows a tax loss while cash-flowing — sheltering income. Rental losses are passive: they offset passive income freely, and up to $25,000/yr can offset ordinary (W-2) income if you actively participate and your MAGI is under $100k (phasing out to $0 by $150k); unused losses carry forward. On sale, claimed depreciation is recaptured at up to 25%, and gains may owe capital-gains tax (a 1031 exchange can defer both). Figures are a year-1 estimate at your 24.0% rate — not tax advice; consult a CPA.
Schools (NCES district)
- District
- Flagler
- NCES district ID
- 1200540
- Math proficiency
- 53% ▼ -9.00%
- Reading proficiency
- 56% ▼ -4.00%
- Median HH income
- $48,354
- Composite
- 46.35/100
- National rank
- #2464
- State rank
- #20 of 73 in FL
Livability — Palm Coast
- Score
- 69/100
- State rank
- #478
- US rank
- #8721
Category grades
Schools grade is shown separately in the Schools card above.
Census & demographics
- Census place
- Palm Coast, FL
- County
- Flagler County · 113,412 people
- City population
- 105,049
- Metro
- Deltona-Daytona Beach-Ormond Beach, FL
- Population (ZIP)
- 56,658
- Household income
- $76,399
- Rent vs Own
- Severe rent burden
- 1291.0
Population outlook (Flagler County) Hauer SSP2
- Today (2025)
- 123,474 people
- By 2030
- 131,864 · +6.8%
- By 2040
- 146,176 · +18.4%
- By 2050
- 157,398 · +27.5%
- By 2075
- 177,990 · +44.2%
- By 2100
- 183,381 · +48.5%
Race, ethnicity, and origin ACS 2023
- Neighborhood character
- Predominantly White (65%)
- Race & ethnicity
- White 65% Hispanic / Latino 14% Black 13% Two or more races 8% Asian 2%
- Hispanic origin (detail)
- Mexican 4% Puerto Rican 4% Cuban 2%
- Common ancestry
- Romanian 3% Russian 2% Slovak 2%
- Foreign-born
- 16% · Canada, Jamaica
- Languages at home
- 81% English-only · Spanish 9% Russian/Polish/Slavic 3% Other Indo-European 3%
Political lean MEDSL · Flagler
- 2024 margin
- Strong R (+28.2) · D 35.6% · R 63.8%
- 2008→2024 swing
- -29.8pp toward R · 2008: 1.6pp · 2024: -28.2pp
- All cycles
- 2024: R+28.2 2020: R+20.8 2016: R+20.6 2012: R+7.4 2008: D+1.6
Not yet ingested
- Civics
- —
Market trends
- HPI YoY
- ▼ -19.89%
- Current HPI
- 297.4942
- Rent YoY
- ▲ 1.18%
- Metro
- Deltona-Daytona Beach-Ormond Beach, FL
- State GDP YoY
- ▲ 3.28%
- F500 in state
- 36
Industry mix (Fortune 500 HQ in FL)
| Industry | F500 HQs | Revenue |
|---|---|---|
| Industrial Technology | 2 | $29B |
|
||
| Insurance | 2 | $17B |
|
||
| Retail | 1 | $60B |
|
||
| Technology Distribution | 1 | $58B |
|
||
| Homebuilding | 1 | $35B |
|
||
| Technology Manufacturing | 1 | $35B |
|
||
Price history
-47.4% since first listed13 events — show timeline
- 2026-06-11 Listed $5,000 HAOR as distributed by MLS GRID
- 2023-05-30 Sold (MLS) $349,900 Stellar MLS as Distributed by MLS Grid
- 2023-05-25 Rental Removed — STELLARMLS
- 2023-05-18 Pending — Stellar MLS as Distributed by MLS Grid
- 2023-05-04 Relisted — Stellar MLS as Distributed by MLS Grid
- 2023-05-04 Pending — Stellar MLS as Distributed by MLS Grid
- 2023-04-24 Listed $349,900 Stellar MLS as Distributed by MLS Grid
- 2023-04-11 Sold (MLS) $295,990 Stellar MLS as Distributed by MLS Grid
- 2022-07-19 Pending — Stellar MLS as Distributed by MLS Grid
- 2022-07-17 Listed $295,990 Stellar MLS as Distributed by MLS Grid
- 2021-04-29 Sold (MLS) $39,900 Stellar MLS as Distributed by MLS Grid
- 2021-03-12 Listed $39,000 Stellar MLS as Distributed by MLS Grid
- 1996-05-28 Sold (Public Records) $9,500 Public Records
Property tax history
+75.5%/yrLatest (2025): $4,935 · +3.2% YoY. Source: county tax records.
Cash-flow waterfall
monthlySold comps — $/sqft
last 12 mo · ≤1 miLoading sold comps…