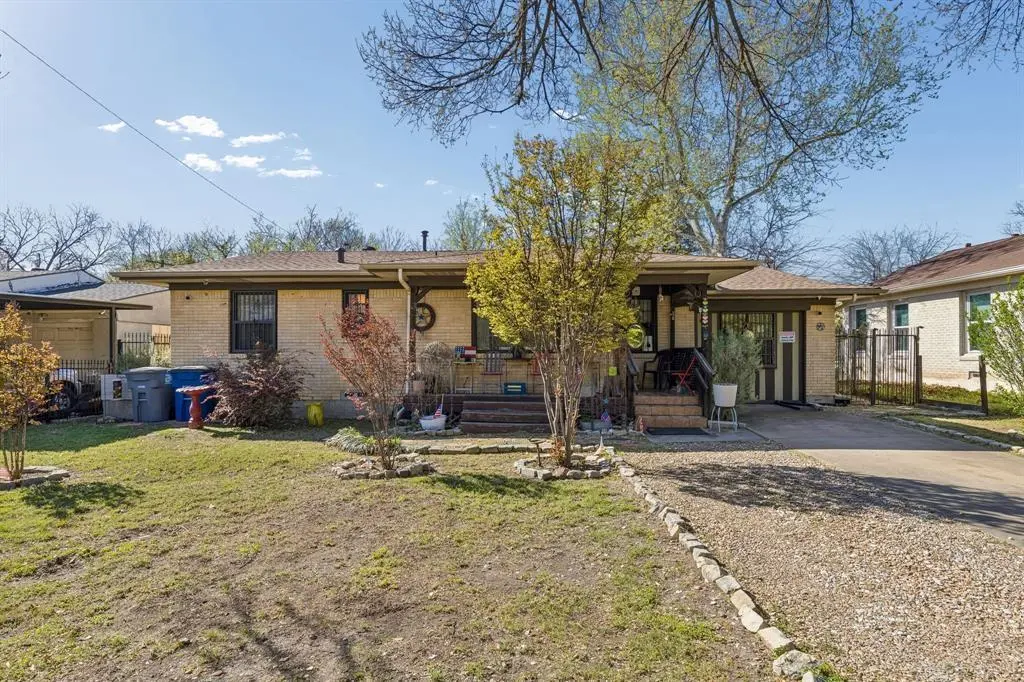
2622 Centerville Rd · Dallas, TX
Flood risk 1/10 · Minimal
- FEMA flood zone
- X (unshaded)
- Chance of flooding over 30 yrs
- 0.0%
- Est. flood insurance / yr
- $507 – $1,088
Fire risk 1/10 · Minimal
- Est. fire insurance / yr
- $1,222 – $2,270
Heat risk 7/10 · Major
- Hot days now (above 109°F)
- 6 days/yr
- Hot days in 30 yrs
- 20 days/yr
Wind risk 6/10 · Moderate
- Chance of severe wind over 30 yrs
- 27.0%
Air-quality risk 2/10 · Minimal
- Unhealthy air days now
- 2 days/yr
- Unhealthy air days in 30 yrs
- 2 days/yr
Risk factors via First Street. Map © Google.
Why this score? — see what drove the D grade
The composite is a weighted blend of 9 inputs, each scored 0–100. Each bar is that input's sub-score; the figure is the points it added to the 100-point composite (weight × sub-score).
- ARV discount +15.0/15.0
- Cash flow +9.5/30.0
- Livability +4.0/5.0
- 1% rule +3.8/10.0
- Schools +2.8/10.0
- DSCR +2.7/10.0
- Condition / age +2.5/5.0
- Rent growth +1.3/5.0
- Appreciation +0.0/10.0
$200,000
🖨 Deal sheet 📄 Offer letter ✓ Due diligence
Listing remarks MLS
Opportunity is knocking! This 3-bedroom, 2-bath, one-story home offers 1,338 square feet and is ready for a new owner to bring it back to life. Whether you’re an investor or a buyer looking to create their dream space, this property has great bones and major system updates already in place. Key improvements include a roof replaced in 2024 and cast iron plumbing updated to PVC. In 2020, extensive energy-efficiency upgrades were completed, including air filtration, caulking and weatherstripping, duct sealing, upgraded insulation (R-38 in attic, R-13 in walls), and a full HVAC system replacement (both interior and exterior units). Foundation work was completed in 2009 and 2015; as typical with pier-and-beam homes, some movement is present. Refrigerator and microwave convey with property. AS IS - NO REPAIRS With the big-ticket items addressed, this home is a perfect canvas for cosmetic updates and personal touches. Bring your vision and unlock the potential! (See Transaction Desk for full list of improvements.)
Key facts
- Roof replaced
- 7,275 sq ft lot
- Garage
Tags
Neighborhood map
What this means for you Summary
Snapshot
- This is a 3-bed/2.0-bath single-family listed at $200k.
Deal economics
- At list price, monthly cash flow is $-138 ($-2k/yr) — negative.
- To cash-flow at today's rent, offer at most $176k (12.2% below list).
- To meet the 1% rule (rent ≥ 1% of price), the offer needs to be $176k (11.8% below list).
- Recommended offer: $176k (12.2% below list) — sets the bar for cash-flow.
- Cap rate 5.5% vs local median 2.3% in Dallas — top-decile yield for the area; either an underpriced asset or a hidden risk that comps aren't pricing in. Stress-test before assuming the spread holds.
Location & tenants
- Location reads 81/100 on livability (#24 in TX, #1,380 nationally) — a professional / high-income tenant draw. Strengths: amenities A+, commute A+, housing A+; Watch: schools C-, crime F.
- Dallas ISD (urban): math 31% / reading 36% proficiency, ranked #559 of 826 in TX (top 68%) — families likely to look elsewhere, expect single-tenant / working-renter base with shorter leases; 83% free/reduced lunch — lower-income household profile, screen leases tightly.
- Market conditions: Rents falling (-4.8%/yr); 306 active listings in the ZIP; 40 comparable units currently listed for rent nearby; rentals at typical pace (median 25d on market — plan ~3-4 weeks tenant-placement turnaround); 12,577 units permitted in Dallas County in 2024 (6,829 in 5+ unit buildings).
- This rent runs 34% of the median local income ($63k/yr) — at the standard rent-burdened threshold; future hikes will face affordability resistance.
Forward outlook
- Local home prices are declining (-3.0%/yr); year-one equity from $1k of loan paydown is wiped out by about $6k of value loss. Plan a longer hold.
- Dallas County population projected at +35% by 2050 — long-run rental-demand tailwind backs the buy-and-hold thesis.
Negotiation context
- It's been on market 50 days — a 3% lower offer ($194k) is reasonable based on typical stale-listing flexibility.
- 3 sale attempts since 19y ago with the ask held roughly flat each time — persistent listings suggest the price (not the market) is what's stuck; bring a comps-based counter.
Risks & watch-outs
- Watch-outs: built in 1952 — expect roof / HVAC / electrical / plumbing capex.
- Climate carrying-cost: major wind risk, 27% chance of damaging wind over 30y; extreme-heat days projected 6→20/yr by 2055 (HVAC capex compounding) — expect insurance premiums to compound above CPI over the hold.
Questions for the listing agent
- What do current leases actually rent for vs. the listed asking? Can we see a recent rent roll and the last 12 months of T-12 income?
- It's been on market 50 days. Have you received any prior offers? Is the seller open to a 12% concession, seller financing, or rate buy-down credit?
- Built in 1952 — when were the roof, HVAC, electrical panel, plumbing, and water heater last replaced?
- Is there a deadline driving the sale (1031 exchange, divorce, estate, relocation)? That informs how much negotiation room exists.
- Crime grade is F in this area — have there been break-ins, vandalism, or insurance claims at this property in the last 3 years? What carrier currently insures it and at what premium?
- The area grade is low — what's the realistic commute time and amenity access for the typical tenant pool here? Any planned neighborhood developments (good or bad) we should know about?
- What's the average days-on-market for RENTAL listings here right now (not sales)? A rising rental-DOM trend means longer vacancies and softer asking-rent achievability than the comps imply.
- What's the recent tenant-quality profile in this submarket — average credit score on applications, eviction rate, late-payment / NSF rate, and stable-employment percentage? A property-management company in the area should have these aggregated.
- How much new for-sale + rental construction is in the pipeline within 1–3 miles? Heavy new supply typically softens prices + rents 12–24 months out; constrained supply supports both.
Investment metrics
- 1% rule
- 0.88% ✗
- Cap rate
- 5.46%
- Cash-on-cash
- -2.97%
- DSCR
- 0.87
- GRM
- 9.4
CMA / ARV
- ARV (median comp)
- $243,652
- List price
- $200,000
- Delta
- -17.92%
- Verdict
- UNDERPRICED
- Comps
- 20 within 1.0 mi
Show comp detail 12 sales within ~0.75 mi
| Address | Dist | Beds/Ba | Sqft | Sold | Price | $/sf | Match |
|---|---|---|---|---|---|---|---|
| 2622 Centerville Rd | 0.00mi | 3/2.0 | 1,338 (0%) | 1mo | $200,000 | $149 | 99 |
| 10550 Ferguson Rd | 0.19mi | 3/2.0 | 1,362 (+2%) | 3mo | $235,000 | $173 | 86 |
| 2212 Tealford Dr | 0.45mi | 3/2.0 | 1,312 (-2%) | 0mo | $289,800 | $221 | 76 |
| 10833 Ruth Ann Dr | 0.63mi | 3/2.0 | 1,332 (-0%) | 2mo | $249,900 | $188 | 68 |
| 10969 Park Oak Cir | 0.56mi | 4/2.0 (+1) | 1,336 (-0%) | 2mo | $285,000 | $213 | 67 |
| 11022 Dunaway Dr | 0.64mi | 3/1.5 | 1,358 (+2%) | 1mo | $235,000 | $173 | 65 |
| 2411 Glengariff Dr | 0.37mi | 4/2.0 (+1) | 1,224 (-8%) | 2mo | $299,900 | $245 | 62 |
| 10710 Joaquin Dr | 0.27mi | 3/2.0 | 1,140 (-15%) | 2mo | $239,000 | $210 | 61 |
| 3002 San Medina Ave | 0.71mi | 2/2.0 (-1) | 1,319 (-1%) | 0mo | $300,000 | $227 | 59 |
| 2365 Norwood Dr | 0.36mi | 3/2.0 | 1,524 (+14%) | 1mo | $299,000 | $196 | 59 |
| 2267 Tealford Dr | 0.32mi | 3/1.0 | 1,152 (-14%) | 2mo | $269,822 | $234 | 56 |
| 10853 Sharondale Ln | 0.70mi | 3/1.0 | 1,152 (-14%) | 1mo | $195,000 | $169 | 39 |
Match score weights: distance 35% · size 25% · config 20% · recency 20%. Top-matched comps best support the ARV.
Projected returns pro-forma
-3.0% appreciation · 0.0% rent growth · sell at horizon
- IRR
- -25.0%
- Equity multiple
- 0.17×
- Total profit
- $-46,274
- Equity at exit
- $29,821
- IRR
- -35.8%
- Equity multiple
- -0.27×
- Total profit
- $-71,142
- Equity at exit
- $17,292
Cash invested: $56,000 (down + closing). Projections, not guarantees.
Landlord ↔ Tenant lean methodology
- Overall (STATE)
- 87 Strongly Landlord-Friendly
- State Texas
- 87 Strongly Landlord-Friendly · R+5
- County
- — inherits STATE
- City
- — inherits STATE
ZIP-level market 75228
- Rents YoY
- -4.8%
- Active inventory
- 306
- Price-to-rent
- 9.4×
Monthly cashflow live
- Estimated rent
- $1,764 high interval (Pro) →
- Mortgage (P&I)
- −$1,049
- Tax from tax record
- −$400 /mo · $4,799/yr
- Insurance
- −$83
- HOA
- −$0
- Vacancy / Maint / Mgmt
- −$370
- Net cashflow
- $-138
Break-even live
UW: 25.0% down · 7.5% · 30yr · 1.5% tax · 5.0% vac · 8.0% maint · 8.0% mgmt
Financing live
Cash to close
- Down payment
- $50,000
- Closing costs
- $6,000
- Reserves months
- —
- Total cash needed
- —
Loan-product check · same deal, 3 products live
Conventional
25% down · 7.5% · 30yr
- Down + closing
- —
- Monthly P&I
- —
- Monthly cashflow
- —
- DSCR
- —
- Eligible?
- —
Personal DTI + credit; lowest rate.
DSCR
20% down · 8.5% · 30yr
- Down + closing
- —
- Monthly P&I
- —
- Monthly cashflow
- —
- DSCR
- —
- Eligible?
- —
No personal income docs; deal must DSCR.
Hard money
10% down · 12.0% · 12mo
- Down + closing
- —
- Monthly P&I
- —
- Monthly cashflow
- —
- DSCR
- —
- Eligible?
- —
Short-term bridge; refi at stabilization.
Rent comps 40 comps
| Address | Beds | Baths | Sqft | Rent | $/sqft | DOM | Units | Dist |
|---|---|---|---|---|---|---|---|---|
| 2518 Winthrop Dr Dallas, TX | 4.0 | 2.0 | 1436 | $2,050 | $1.43 | 21d | 1 | 0.19mi |
| 2518 Winthrop Dr Dallas, TX | 4.0 | 2.0 | 1436 | $2,050 | $1.43 | 24d | 1 | 0.19mi |
| 10850 Shiloh Rd Unit 303 Dallas, TX | 2.0 | 2.0 | 1000 | $1,300 | $1.30 | 24d | 1 | 0.19mi |
| 10850 Shiloh Rd Dallas, TX | 2.0 | 1.5 | 1200 | $1,300 | $1.08 | 24d | 1 | 0.19mi |
| 10852 Shiloh Rd Unit 404 Dallas, TX | 2.0 | 2.0 | 1000 | $1,500 | $1.50 | 44d | 1 | 0.21mi |
| 10852 Shiloh Rd Unit 403 Dallas, TX | 2.0 | 2.0 | 1000 | $1,300 | $1.30 | 24d | 1 | 0.21mi |
| 10911 Visalia Dr Dallas, TX | 3.0 | 1.0 | 1385 | $1,925 | $1.39 | 44d | 1 | 0.22mi |
| 10465 Ferguson Rd Dallas, TX | 3.0 | 1.0 | 1010 | $1,750 | $1.73 | 44d | 1 | 0.34mi |
| 10858 Cassandra Way Dallas, TX | 3.0 | 1.5 | 1439 | $1,850 | $1.29 | 17d | 1 | 0.34mi |
| 11211 Ulloa Ln Dallas, TX | 3.0 | 1.0 | 1151 | $1,683 | $1.46 | 13d | 1 | 0.38mi |
| 11220 Visalia Dr Dallas, TX | 3.0 | 2.0 | 1224 | $1,970 | $1.61 | 44d | 1 | 0.41mi |
| 10425 Ferguson Rd Dallas, TX | 3.0 | 2.0 | 916 | $1,753 | $1.91 | 44d | 1 | 0.42mi |
| 2811 Tisinger Ave Dallas, TX | 3.0 | 1.0 | 1248 | $1,925 | $1.54 | 7d | 1 | 0.44mi |
| 11211 Stallcup Dr Dallas, TX | 3.0 | 1.0 | 1111 | $1,950 | $1.76 | 44d | 1 | 0.45mi |
| 10732 Cotillion Dr Dallas, TX | 3.0 | 2.0 | 1513 | $1,895 | $1.25 | 44d | 1 | 0.50mi |
| 10830 Cotillion Dr Dallas, TX | 3.0 | 1.5 | 1200 | $1,795 | $1.50 | 24d | 1 | 0.55mi |
| 10403 Sandra Lynn Dr Dallas, TX | 3.0 | 2.0 | 1610 | $2,195 | $1.36 | 4d | 1 | 0.55mi |
| 2118 Norwood Dr Dallas, TX | 3.0 | 2.0 | 1120 | $1,895 | $1.69 | 3d | 1 | 0.61mi |
| 2402 Housley Dr Dallas, TX | 3.0 | 2.0 | 1679 | $2,420 | $1.44 | 24d | 1 | 0.67mi |
| 10943 Desdemona Dr Dallas, TX | 2.0 | 1.0 | 1060 | $1,600 | $1.51 | 20d | 1 | 0.68mi |
| 2315 Housley Dr Dallas, TX | 4.0 | 2.0 | 1167 | $2,600 | $2.23 | 11d | 1 | 0.71mi |
| 10518 Desdemona Dr Dallas, TX | 3.0 | 2.0 | 1077 | $2,275 | $2.11 | 44d | 1 | 0.72mi |
| 10922 Castolon Dr Dallas, TX | 3.0 | 1.0 | 1275 | $1,795 | $1.41 | 7d | 1 | 0.73mi |
| 3216 San Vicente Ave Dallas, TX | 3.0 | 1.0 | 1209 | $2,250 | $1.86 | 5d | 1 | 0.74mi |
| 2114 Dunloe Ave Dallas, TX | 3.0 | 1.5 | 1133 | $1,800 | $1.59 | 44d | 1 | 0.78mi |
| 2414 San Medina Ave Dallas, TX | 3.0 | 1.5 | 1231 | $2,100 | $1.71 | 6d | 1 | 0.78mi |
| 2703 San Diego Dr Dallas, TX | 4.0 | 2.0 | 894 | $1,825 | $2.04 | 24d | 1 | 0.78mi |
| 5303 Kiamesha Way Mesquite, TX | 3.0 | 2.0 | 1534 | $1,725 | $1.12 | 44d | 1 | 0.81mi |
| 10270 Kilkenny Pl Dallas, TX | 3.0 | 2.0 | 1655 | $2,900 | $1.75 | 7d | 1 | 0.82mi |
| 2322 San Paula Ave Dallas, TX | 4.0 | 2.0 | 1591 | $2,200 | $1.38 | 24d | 1 | 0.88mi |
| 2035 San Francisco Dr Dallas, TX | 3.0 | 1.0 | 926 | $1,770 | $1.91 | 3d | 1 | 0.89mi |
| 1802 Gus Thomasson Rd Dallas, TX | 2.0 | 2.0 | 1026 | $1,899 | $1.85 | 44d | 1 | 0.89mi |
| 1802 Gus Thomasson Rd Dallas, TX | 2.0 | 2.0 | 884 | $1,895 | $2.14 | 24d | 1 | 0.89mi |
| 10308 Lavano Ln Dallas, TX | 3.0 | 1.0 | 1437 | $1,950 | $1.36 | 44d | 1 | 0.90mi |
| 10632 Aledo Dr Dallas, TX | 3.0 | 2.0 | 1385 | $1,899 | $1.37 | 15d | 1 | 0.91mi |
| 3230 San Lucas Ave Dallas, TX | 3.0 | 1.0 | 1164 | $2,000 | $1.72 | 19d | 1 | 0.92mi |
| 2709 Highwood Dr Dallas, TX | 3.0 | 1.0 | 1116 | $1,695 | $1.52 | 24d | 1 | 0.92mi |
| 3053 Villa Sur Trl Dallas, TX | 3.0 | 2.0 | 1674 | $2,100 | $1.25 | 24d | 1 | 0.92mi |
| 10608 Cayuga Dr Dallas, TX | 3.0 | 1.0 | 1038 | $1,775 | $1.71 | 7d | 1 | 0.99mi |
| 10205 San Juan Ave Dallas, TX | 3.0 | 2.0 | 1458 | $2,225 | $1.53 | 24d | 1 | 1.00mi |
Listing history 10 events
-
2026-05-12status Pending 1033-char remark
Show marketing remark (1033 chars)
Opportunity is knocking! This 3-bedroom, 2-bath, one-story home offers 1,338 square feet and is ready for a new owner to bring it back to life. Whether you’re an investor or a buyer looking to create their dream space, this property has great bones and major system updates already in place. Key improvements include a roof replaced in 2024 and cast iron plumbing updated to PVC. In 2020, extensive energy-efficiency upgrades were completed, including air filtration, caulking and weatherstripping, duct sealing, upgraded insulation (R-38 in attic, R-13 in walls), and a full HVAC system replacement (both interior and exterior units). Foundation work was completed in 2009 and 2015; as typical with pier-and-beam homes, some movement is present. Refrigerator and microwave convey with property. AS IS - NO REPAIRS With the big-ticket items addressed, this home is a perfect canvas for cosmetic updates and personal touches. Bring your vision and unlock the potential! (See Transaction Desk for full list of improvements.)
-
2026-05-07historical Active Option Contract 1033-char remark
Show marketing remark (1033 chars)
Opportunity is knocking! This 3-bedroom, 2-bath, one-story home offers 1,338 square feet and is ready for a new owner to bring it back to life. Whether you’re an investor or a buyer looking to create their dream space, this property has great bones and major system updates already in place. Key improvements include a roof replaced in 2024 and cast iron plumbing updated to PVC. In 2020, extensive energy-efficiency upgrades were completed, including air filtration, caulking and weatherstripping, duct sealing, upgraded insulation (R-38 in attic, R-13 in walls), and a full HVAC system replacement (both interior and exterior units). Foundation work was completed in 2009 and 2015; as typical with pier-and-beam homes, some movement is present. Refrigerator and microwave convey with property. AS IS - NO REPAIRS With the big-ticket items addressed, this home is a perfect canvas for cosmetic updates and personal touches. Bring your vision and unlock the potential! (See Transaction Desk for full list of improvements.)
-
2026-03-23$200,000 Active 1033-char remark
Show marketing remark (1033 chars)
Opportunity is knocking! This 3-bedroom, 2-bath, one-story home offers 1,338 square feet and is ready for a new owner to bring it back to life. Whether you’re an investor or a buyer looking to create their dream space, this property has great bones and major system updates already in place. Key improvements include a roof replaced in 2024 and cast iron plumbing updated to PVC. In 2020, extensive energy-efficiency upgrades were completed, including air filtration, caulking and weatherstripping, duct sealing, upgraded insulation (R-38 in attic, R-13 in walls), and a full HVAC system replacement (both interior and exterior units). Foundation work was completed in 2009 and 2015; as typical with pier-and-beam homes, some movement is present. Refrigerator and microwave convey with property. AS IS - NO REPAIRS With the big-ticket items addressed, this home is a perfect canvas for cosmetic updates and personal touches. Bring your vision and unlock the potential! (See Transaction Desk for full list of improvements.)
-
2025-08-20historical
-
2025-08-13$205,000 Active
-
2008-06-06soldstatus
-
2008-06-04soldstatus
-
2008-04-11historical
-
2007-10-08$84,500
-
1981-01-20soldstatus
ⓘ Source: listings_history table (triggers on properties + properties_extension) + one-shot
backfill from property_details.listing_events for pre-trigger history.
Tax reassessment forecast TX · Resets to sale price
- Current annual tax
- $4,799 · $400/mo
- Projected year-2 tax
- $4,799 · $400/mo
- Expected delta
- $0/yr ($0/mo · 0.0%)
ⓘ Screening estimate from a state-policy table — verify with the county assessor before closing.
Climate risk First Street
- Flood 1/10 Low FEMA zone X (unshaded) · 0% chance over 30 yrs
- Wildfire 1/10 Low
- Heat 7/10 Severe 6 d/yr ≥109°F today · 20 d/yr by 30 yrs out
- Wind 6/10 Major 27% chance of damaging wind over 30 yrs
- Air quality 2/10 Low 2 unhealthy d/yr today · 2 by 30 yrs out
Nearby sold comps map
Loading sold comps map…
Walkable amenities ~0.75 mi
Loading nearby amenities…
Taxation est. · year 1
- Rental income
- $21,170
- − Mortgage interest
- −$11,203
- − Property taxes
- −$4,799
- − Insurance
- −$1,000
- − Repairs & maintenance
- −$1,694
- − Management
- −$1,694
- − Depreciation
- −$5,818
- Taxable loss
- −$5,038
- Est. tax savings @ 24.0%
- +$1,209
- After-tax cash flow
- $-452/yr
For passive investors: Depreciation is non-cash, so a rental often shows a tax loss while cash-flowing — sheltering income. Rental losses are passive: they offset passive income freely, and up to $25,000/yr can offset ordinary (W-2) income if you actively participate and your MAGI is under $100k (phasing out to $0 by $150k); unused losses carry forward. On sale, claimed depreciation is recaptured at up to 25%, and gains may owe capital-gains tax (a 1031 exchange can defer both). Figures are a year-1 estimate at your 24.0% rate — not tax advice; consult a CPA.
Schools (NCES district)
- District
- Dallas ISD
- NCES district ID
- 4816230
- Math proficiency
- 31% ▼ -16.00%
- Reading proficiency
- 36% ▼ -4.00%
- Median HH income
- $42,881
- Composite
- 28.41/100
- National rank
- #6763
- State rank
- #559 of 826 in TX
Livability — Dallas
- Score
- 81/100
- State rank
- #24
- US rank
- #1380
Category grades
Schools grade is shown separately in the Schools card above.
Census & demographics
- Census place
- Dallas, TX
- County
- Dallas County · 2,612,404 people
- City population
- 1,168,437
- Metro
- Dallas-Fort Worth-Arlington, TX
- Population (ZIP)
- 67,714
- Household income
- $62,667
- Rent vs Own
- Severe rent burden
- 3281.0
Population outlook (Dallas County) Hauer SSP2
- Today (2025)
- 2,979,839 people
- By 2030
- 3,191,823 · +7.1%
- By 2040
- 3,619,611 · +21.5%
- By 2050
- 4,026,915 · +35.1%
- By 2075
- 4,957,073 · +66.4%
- By 2100
- 5,508,725 · +84.9%
Race, ethnicity, and origin ACS 2023
- Neighborhood character
- Diverse neighborhood (Simpson 0.61)
- Race & ethnicity
- Hispanic / Latino 56% Two or more races 32% White 20% Black 19% Asian 2%
- Hispanic origin (detail)
- Mexican 48%
- Common ancestry
- Slovak 1% Lithuanian 1% Italian 1%
- Foreign-born
- 28% · Canada, China, Vietnam
- Languages at home
- 48% English-only · Spanish 48% Vietnamese 1%
Political lean MEDSL · Dallas
- 2024 margin
- Strong D (+22.2) · D 60.2% · R 38.0% · Other 1.8%
- 2008→2024 swing
- +6.9pp toward D · 2008: 15.3pp · 2024: 22.2pp
- All cycles
- 2024: D+22.2 2020: D+31.6 2016: D+26.2 2012: D+15.4 2008: D+15.3
Not yet ingested
- Civics
- —
Market trends
- HPI YoY
- ▼ -319.11%
- Current HPI
- 354.1624
- Rent YoY
- ▼ -4.85%
- Metro
- Dallas-Fort Worth-Arlington, TX
- State GDP YoY
- ▲ 3.95%
- F500 in state
- 110
Industry mix (Fortune 500 HQ in TX)
| Industry | F500 HQs | Revenue |
|---|---|---|
| Energy | 16 | $1,198B |
|
||
| Technology | 5 | $198B |
|
||
| Engineering / Construction | 4 | $72B |
|
||
| Energy Services | 3 | $60B |
|
||
| Utilities | 3 | $41B |
|
||
| Healthcare | 2 | $330B |
|
||
Price history
+136.7% since first listed10 events — show timeline
- 2026-05-12 Pending — NTREIS
- 2026-05-07 Contingent — NTREIS
- 2026-03-23 Listed $200,000 NTREIS
- 2025-08-20 Listing Removed — NTREIS
- 2025-08-13 Listed $205,000 NTREIS
- 2008-06-06 Sold (Public Records) — Public Records
- 2008-06-04 Sold (MLS) — NTREIS
- 2008-04-11 Listing Removed — NTREIS
- 2007-10-08 Listed $84,500 NTREIS
- 1981-01-20 Sold (Public Records) — Public Records
Property tax history
+8.9%/yrLatest (2025): $4,799 · +10.8% YoY. Source: county tax records.
Cash-flow waterfall
monthlySold comps — $/sqft
last 12 mo · ≤1 miLoading sold comps…