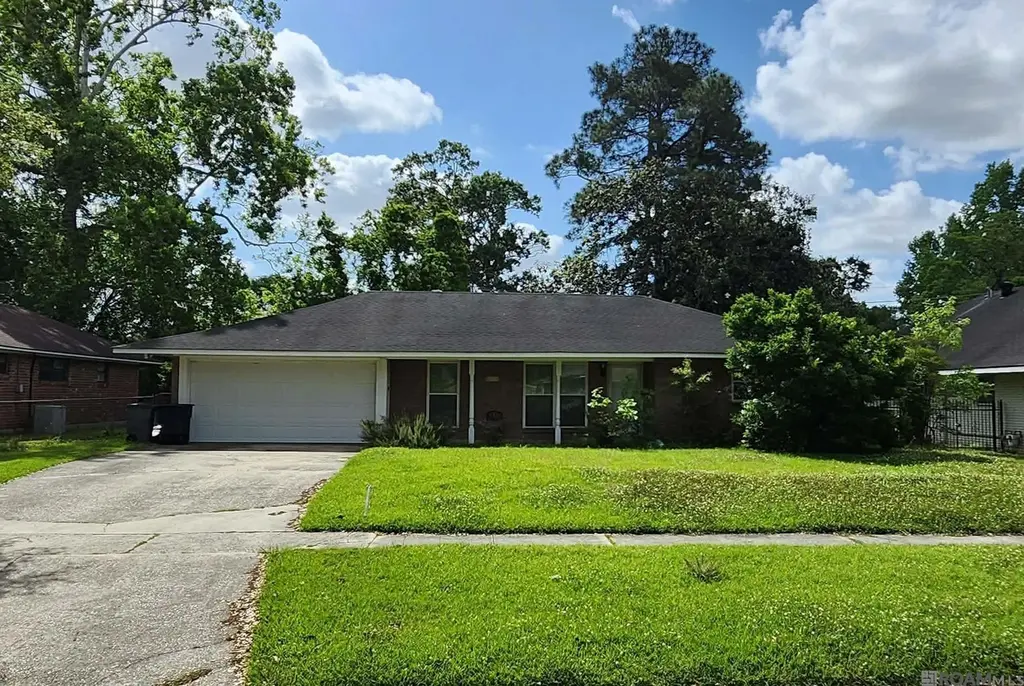
8244 Harry Dr · Baton Rouge, LA
Flood risk 1/10 · Minimal
- FEMA flood zone
- X (shaded)
- Chance of flooding over 30 yrs
- 0.0%
- Est. flood insurance / yr
- $507 – $1,088
Fire risk 1/10 · Minimal
- Est. fire insurance / yr
- $1,269 – $2,357
Heat risk 8/10 · Major
- Hot days now (above 108°F)
- 7 days/yr
- Hot days in 30 yrs
- 20 days/yr
Wind risk 9/10 · Severe
- Chance of severe wind over 30 yrs
- 99.0%
Air-quality risk 3/10 · Minor
- Unhealthy air days now
- 3 days/yr
- Unhealthy air days in 30 yrs
- 4 days/yr
Risk factors via First Street. Map © Google.
Why this score? — see what drove the D+ grade
The composite is a weighted blend of 9 inputs, each scored 0–100. Each bar is that input's sub-score; the figure is the points it added to the 100-point composite (weight × sub-score).
- Cash flow +14.7/30.0
- ARV discount +13.0/15.0
- DSCR +4.5/10.0
- Livability +3.7/5.0
- 1% rule +3.6/10.0
- Rent growth +3.4/5.0
- Condition / age +2.5/5.0
- Schools +2.4/10.0
- Appreciation +0.0/10.0
$175,000
🖨 Deal sheet 📄 Offer letter ✓ Due diligence
Listing remarks MLS
Inspections for buyers purpose only. Investor special with endless potential! This 3-bedroom, 2-bath home offers approximately 1,750 sq ft with an open floor plan and a 2-car garage. The backyard includes two storage sheds, adding extra functionality and value. Ideally located near multiple BREC parks, shopping, dining, and everyday conveniences including Walmart and Aldi just across the main roadway, plus nearby home improvement stores and a local water park. A prime opportunity for renovation, rental income, or renovation then resale!
Key facts
- 0.26 acre lot
- Garage
- Built 1965
Neighborhood map
What this means for you Summary
Snapshot
- This is a 3-bed/2.0-bath single-family listed at $175k.
Deal economics
- At list price, monthly cash flow is $45 ($540/yr) — positive.
- The deal already cash-flows at list — no discount required.
- To meet the 1% rule (rent ≥ 1% of price), the offer needs to be $151k (13.7% below list).
- Recommended offer: $151k (13.7% below list) — sets the bar for 1% rule.
- Cap rate 6.6% vs local median 4.3% in Baton Rouge — top-decile yield for the area; either an underpriced asset or a hidden risk that comps aren't pricing in. Stress-test before assuming the spread holds.
Location & tenants
- Location reads 74/100 on livability (#24 in LA, #4,535 nationally) — a middle-class / working-renter tenant base. Strengths: commute A+, cost of living A+, health & safety A+; Watch: amenities D, crime F, employment D-.
- East Baton Rouge Parish (urban): math 22% / reading 34% proficiency, ranked #47 of 98 in LA (top 48%) — low school quality limits family demand, transient renter base, plan for 1-2y turnover; 77% free/reduced lunch — lower-income household profile, screen leases tightly.
- Market conditions: Rents rising (+3.4%/yr); 238 active listings in the ZIP; 16 comparable units currently listed for rent nearby; rentals lingering (median 44d on market — plan ~5-8 weeks vacancy on turnover, expect pricing pressure); 50% of comp listings sitting > 30 days — soft ceiling on asking rent; 2,252 units permitted in East Baton Rouge Parish in 2024 (440 in 5+ unit buildings).
- This rent runs 33% of the median local income ($56k/yr) — at the standard rent-burdened threshold; future hikes will face affordability resistance.
Forward outlook
- Local home prices are declining (-3.0%/yr); year-one equity from $1k of loan paydown is wiped out by about $5k of value loss. Plan a longer hold.
- East Baton Rouge County population projected at +4% by 2050 — modest demand growth; plan on rents tracking national, not racing it.
Negotiation context
- It's been on market 65 days — a 6% lower offer ($164k) is reasonable based on typical stale-listing flexibility.
- 4 sale attempts since 9y ago with the ask held roughly flat each time — persistent listings suggest the price (not the market) is what's stuck; bring a comps-based counter.
- Current owner paid $150k; 17% above their basis — modest negotiation headroom, anchor on the comps not their cost.
Risks & watch-outs
- Climate carrying-cost: severe wind risk, 99% chance of damaging wind over 30y; extreme-heat days projected 7→20/yr by 2055 (HVAC capex compounding) — expect insurance premiums to compound above CPI over the hold.
Questions for the listing agent
- It's been on market 65 days. Have you received any prior offers? Is the seller open to a 14% concession, seller financing, or rate buy-down credit?
- Built in 1965 — when were the roof, HVAC, electrical panel, plumbing, and water heater last replaced?
- Why hasn't it sold? Are there any deal-killer items the seller is aware of (foundation, flood, title, zoning, code violations)?
- Is there a deadline driving the sale (1031 exchange, divorce, estate, relocation)? That informs how much negotiation room exists.
- Crime grade is F in this area — have there been break-ins, vandalism, or insurance claims at this property in the last 3 years? What carrier currently insures it and at what premium?
- The area grade is low — what's the realistic commute time and amenity access for the typical tenant pool here? Any planned neighborhood developments (good or bad) we should know about?
- What's the average days-on-market for RENTAL listings here right now (not sales)? A rising rental-DOM trend means longer vacancies and softer asking-rent achievability than the comps imply.
- What's the recent tenant-quality profile in this submarket — average credit score on applications, eviction rate, late-payment / NSF rate, and stable-employment percentage? A property-management company in the area should have these aggregated.
- How much new for-sale + rental construction is in the pipeline within 1–3 miles? Heavy new supply typically softens prices + rents 12–24 months out; constrained supply supports both.
Investment metrics
- 1% rule
- 0.86% ✗
- Cap rate
- 6.60%
- Cash-on-cash
- 1.10%
- DSCR
- 1.05
- GRM
- 9.7
CMA / ARV
- ARV (median comp)
- $199,537
- List price
- $175,000
- Delta
- -12.30%
- Verdict
- UNDERPRICED
- Comps
- 20 within 1.0 mi
Show comp detail 8 sales within ~0.75 mi
| Address | Dist | Beds/Ba | Sqft | Sold | Price | $/sf | Match |
|---|---|---|---|---|---|---|---|
| 8184 Harry Dr | 0.06mi | 3/2.0 | 1,600 (-7%) | 2mo | $204,000 | $128 | 83 |
| 365 Fernwood Dr | 0.37mi | 3/2.0 | 1,712 (-1%) | 12mo | $195,000 | $114 | 71 |
| 8067 Queenswood Ct | 0.13mi | 3/2.0 | 1,545 (-11%) | 8mo | $150,000 | $97 | 70 |
| 421 Fernwood Dr | 0.34mi | 3/2.0 | 1,675 (-3%) | 14mo | $230,000 | $137 | 68 |
| 8137 Franwood Dr | 0.25mi | 3/2.0 | 1,897 (+10%) | 19mo | $225,000 | $119 | 56 |
| 344 Fernwood Dr | 0.38mi | 2/2.0 (-1) | 1,836 (+6%) | 23mo | $239,000 | $130 | 48 |
| 259 W Parkland Dr | 0.75mi | 3/1.0 | 1,640 (-5%) | 10mo | $195,000 | $119 | 44 |
| 8371 N Parkland Dr | 0.66mi | 4/2.0 (+1) | 1,680 (-3%) | 24mo | $209,000 | $124 | 40 |
Match score weights: distance 35% · size 25% · config 20% · recency 20%. Top-matched comps best support the ARV.
Projected returns pro-forma
-3.0% appreciation · 3.42% rent growth · sell at horizon
- IRR
- -14.1%
- Equity multiple
- 0.49×
- Total profit
- $-24,865
- Equity at exit
- $26,093
- IRR
- -4.7%
- Equity multiple
- 0.69×
- Total profit
- $-15,367
- Equity at exit
- $15,131
Cash invested: $49,000 (down + closing). Projections, not guarantees.
Landlord ↔ Tenant lean methodology
- Overall (STATE)
- 90 Strongly Landlord-Friendly
- State Louisiana
- 90 Strongly Landlord-Friendly · R+12
- County
- — inherits STATE
- City
- — inherits STATE
ZIP-level market 70806
- Rents YoY
- 3.4%
- Active inventory
- 238
- Price-to-rent
- 9.7×
Monthly cashflow live
- Estimated rent
- $1,511 high interval (Pro) →
- Mortgage (P&I)
- −$918
- Tax from tax record
- −$158 /mo · $1,897/yr
- Insurance
- −$73
- HOA
- −$0
- Vacancy / Maint / Mgmt
- −$317
- Net cashflow
- $45
Break-even live
UW: 25.0% down · 7.5% · 30yr · 1.5% tax · 5.0% vac · 8.0% maint · 8.0% mgmt
Financing live
Cash to close
- Down payment
- $43,750
- Closing costs
- $5,250
- Reserves months
- —
- Total cash needed
- —
Loan-product check · same deal, 3 products live
Conventional
25% down · 7.5% · 30yr
- Down + closing
- —
- Monthly P&I
- —
- Monthly cashflow
- —
- DSCR
- —
- Eligible?
- —
Personal DTI + credit; lowest rate.
DSCR
20% down · 8.5% · 30yr
- Down + closing
- —
- Monthly P&I
- —
- Monthly cashflow
- —
- DSCR
- —
- Eligible?
- —
No personal income docs; deal must DSCR.
Hard money
10% down · 12.0% · 12mo
- Down + closing
- —
- Monthly P&I
- —
- Monthly cashflow
- —
- DSCR
- —
- Eligible?
- —
Short-term bridge; refi at stabilization.
Rent comps 16 comps
| Address | Beds | Baths | Sqft | Rent | $/sqft | DOM | Units | Dist |
|---|---|---|---|---|---|---|---|---|
| 600 Wooddale Blvd Baton Rouge, LA | 1.0–3.0 | 1.0–3.5 | 1225 | $1,537 | $1.25 | 14d | 16 | 0.23mi |
| 150 Ocean Dr Unit 2B Baton Rouge, LA | 2.0 | 2.0 | 1276 | $1,250 | $0.98 | 23d | 1 | 0.89mi |
| 6918 Goya Ave Unit A Baton Rouge, LA | 3.0 | 2.0 | 1398 | $1,785 | $1.28 | 14d | 1 | 0.94mi |
| 224 Ocean Dr Baton Rouge, LA | 2.0 | 1.5–2.0 | 1071 | $1,148 | $1.07 | 44d | 2 | 0.95mi |
| 6908 Goya Ave Unit A Baton Rouge, LA | 3.0 | 2.0 | 1302 | $1,650 | $1.27 | 21d | 1 | 0.95mi |
| 6908 Goya Ave Unit B Baton Rouge, LA | 3.0 | 2.0 | 1398 | $1,750 | $1.25 | 44d | 1 | 0.95mi |
| 224 Ocean Dr #107 Baton Rouge, LA | 2.0 | 1.5 | 1071 | $1,300 | $1.21 | 23d | 1 | 0.97mi |
| 6867 Titian Ave Baton Rouge, LA | 1.0–3.0 | 1.0–2.0 | 886 | $900 | $1.02 | 14d | 3 | 1.01mi |
| 6645 Harry Dr Baton Rouge, LA | 2.0–4.0 | 1.0–2.0 | 1013 | $1,202 | $1.19 | 14d | 14 | 1.10mi |
| 376 Croydon Ave Unit A Baton Rouge, LA | 2.0 | 1.0 | 1117 | $1,800 | $1.61 | 44d | 1 | 1.13mi |
| 376 Croydon Ave Baton Rouge, LA | 2.0 | 1.0 | 1117 | $2,600 | $2.33 | 44d | 1 | 1.13mi |
| 9262 Florida Blvd Baton Rouge, LA | 1.0–2.0 | 1.0–2.0 | 950 | $775 | $0.82 | 44d | 1 | 1.15mi |
| 542 Finchley Ave Baton Rouge, LA | 3.0 | 2.0 | 1920 | $1,950 | $1.02 | 44d | 1 | 1.22mi |
| 650 N Ardenwood Dr Baton Rouge, LA | 1.0–4.0 | 1.0–2.0 | 951 | $1,229 | $1.29 | 44d | 1 | 1.33mi |
| 8508 Greenwell Springs Rd Baton Rouge, LA | 1.0–3.0 | 1.0–2.5 | 970 | $975 | $1.01 | 19d | 1 | 1.45mi |
| 459 Court Dr Apt Court Baton Rouge, LA | 1.0–2.0 | 1.0–2.0 | 995 | $1,099 | $1.10 | 44d | 1 | 1.45mi |
Listing history 23 events
-
2026-06-18days on market $175,000 Active 65 DOM
-
2026-06-17days on market $175,000 Active 64 DOM
-
2026-06-16days on market $175,000 Active 63 DOM
-
2026-06-15days on market $175,000 Active 62 DOM
-
2026-06-14days on market $175,000 Active 60 DOM
-
2026-06-10days on market $175,000 Active 57 DOM
-
2026-06-09days on market $175,000 Active 56 DOM
-
2026-06-08days on market $175,000 Active 55 DOM
-
2026-06-07days on market $175,000 Active 54 DOM
-
2026-06-05days on market $175,000 Active 51 DOM
-
2026-06-03days on market $175,000 Active 50 DOM
-
2026-06-02days on market $175,000 Active 49 DOM
-
2026-06-01days on market $175,000 Active 48 DOM
-
2026-05-31days on market $175,000 Active 47 DOM
-
2026-05-31days on market $175,000 Active 46 DOM
-
2026-04-14$175,000 Active 542-char remark
Show marketing remark (542 chars)
Inspections for buyers purpose only. Investor special with endless potential! This 3-bedroom, 2-bath home offers approximately 1,750 sq ft with an open floor plan and a 2-car garage. The backyard includes two storage sheds, adding extra functionality and value. Ideally located near multiple BREC parks, shopping, dining, and everyday conveniences including Walmart and Aldi just across the main roadway, plus nearby home improvement stores and a local water park. A prime opportunity for renovation, rental income, or renovation then resale!
-
2018-01-10soldstatus $150,000
-
2018-01-08soldstatus Sold
-
2017-11-21status Pending
-
2017-11-16$155,000 Active
-
2017-11-16$155,000
-
1985-07-23soldstatus
ⓘ Source: listings_history table (triggers on properties + properties_extension) + one-shot
backfill from property_details.listing_events for pre-trigger history.
Tax reassessment forecast LA · Resets to sale price
- Current annual tax
- $1,897 · $158/mo
- Projected year-2 tax
- $1,897 · $158/mo
- Expected delta
- $0/yr ($0/mo · 0.0%)
ⓘ Screening estimate from a state-policy table — verify with the county assessor before closing.
Climate risk First Street
- Flood 1/10 Low FEMA zone X (shaded) · 0% chance over 30 yrs
- Wildfire 1/10 Low
- Heat 8/10 Severe 7 d/yr ≥108°F today · 20 d/yr by 30 yrs out
- Wind 9/10 Extreme 99% chance of damaging wind over 30 yrs
- Air quality 3/10 Moderate 3 unhealthy d/yr today · 4 by 30 yrs out
Nearby sold comps map
Loading sold comps map…
Walkable amenities ~0.75 mi
Loading nearby amenities…
Taxation est. · year 1
- Rental income
- $18,132
- − Mortgage interest
- −$9,803
- − Property taxes
- −$1,897
- − Insurance
- −$875
- − Repairs & maintenance
- −$1,451
- − Management
- −$1,451
- − Depreciation
- −$5,091
- Taxable loss
- −$2,434
- Est. tax savings @ 24.0%
- +$584
- After-tax cash flow
- $1,124/yr
For passive investors: Depreciation is non-cash, so a rental often shows a tax loss while cash-flowing — sheltering income. Rental losses are passive: they offset passive income freely, and up to $25,000/yr can offset ordinary (W-2) income if you actively participate and your MAGI is under $100k (phasing out to $0 by $150k); unused losses carry forward. On sale, claimed depreciation is recaptured at up to 25%, and gains may owe capital-gains tax (a 1031 exchange can defer both). Figures are a year-1 estimate at your 24.0% rate — not tax advice; consult a CPA.
Schools (NCES district)
- District
- East Baton Rouge Parish
- NCES district ID
- 2200540
- Math proficiency
- 22% ▼ -36.00%
- Reading proficiency
- 34% ▼ -31.00%
- Median HH income
- $46,263
- Composite
- 24.14/100
- National rank
- #7745
- State rank
- #47 of 98 in LA
Livability — Baton Rouge
- Score
- 74/100
- State rank
- #24
- US rank
- #4535
Category grades
Schools grade is shown separately in the Schools card above.
Census & demographics
- Census place
- Baton Rouge, LA
- County
- East Baton Rouge Parish · 399,686 people
- City population
- 351,868
- Metro
- Baton Rouge, LA
- Population (ZIP)
- 28,302
- Household income
- $55,642
- Rent vs Own
- Severe rent burden
- 1968.0
Population outlook (East Baton Rouge County) Hauer SSP2
- Today (2025)
- 464,810 people
- By 2030
- 472,137 · +1.6%
- By 2040
- 480,243 · +3.3%
- By 2050
- 484,422 · +4.2%
- By 2075
- 492,069 · +5.9%
- By 2100
- 476,347 · +2.5%
Race, ethnicity, and origin ACS 2023
- Neighborhood character
- Diverse neighborhood (Simpson 0.62)
- Race & ethnicity
- White 48% Black 38% Two or more races 8% Hispanic / Latino 5% Asian 2%
- Hispanic origin (detail)
- Puerto Rican 1%
- Common ancestry
- Lithuanian 9% Slovak 2% Serbian 1%
- Foreign-born
- 4% · Canada
- Languages at home
- 93% English-only · Spanish 3% Chinese 1% French/Haitian/Cajun 1%
Political lean MEDSL · East Baton Rouge
- 2024 margin
- D (+11.1) · D 54.5% · R 43.4% · Other 2.1%
- 2008→2024 swing
- +8.9pp toward D · 2008: 2.2pp · 2024: 11.1pp
- All cycles
- 2024: D+11.1 2020: D+13.1 2016: D+9.2 2012: D+5.2 2008: D+2.2
Not yet ingested
- Civics
- —
Market trends
- HPI YoY
- ▼ -167.56%
- Current HPI
- 185.0655
- Rent YoY
- ▲ 3.42%
- Metro
- Baton Rouge, LA
- State GDP YoY
- ▲ 3.29%
- F500 in state
- 10
Industry mix (Fortune 500 HQ in LA)
| Industry | F500 HQs | Revenue |
|---|---|---|
| Telecommunications | 2 | $23B |
|
||
| Utilities | 1 | $12B |
|
||
| Wholesale / Distribution | 1 | $5B |
|
||
| Advertising | 1 | $2B |
|
||
Price history
+12.9% since first listed8 events — show timeline
- 2026-04-14 Listed $175,000 AcadianaMLS
- 2026-04-14 Listed $175,000 GBRMLS
- 2018-01-10 Sold (Public Records) $150,000 Public Records
- 2018-01-08 Sold (MLS) — GBRMLS
- 2017-11-21 Pending — GBRMLS
- 2017-11-16 Listed $155,000 AcadianaMLS
- 2017-11-16 Listed $155,000 GBRMLS
- 1985-07-23 Sold (Public Records) — Public Records
Property tax history
+15.8%/yrLatest (2025): $1,897 · +4.3% YoY. Source: county tax records.
Cash-flow waterfall
monthlySold comps — $/sqft
last 12 mo · ≤1 miLoading sold comps…