201 W Rosamond St #61 · Houston, TX
Flood risk 3/10 · Minor
- FEMA flood zone
- X (unshaded)
- Chance of flooding over 30 yrs
- 0.2%
- Est. flood insurance / yr
- $507 – $1,088
Fire risk 1/10 · Minimal
- Est. fire insurance / yr
- $1,222 – $2,270
Heat risk 9/10 · Severe
- Hot days now (above 109°F)
- 7 days/yr
- Hot days in 30 yrs
- 22 days/yr
Wind risk 9/10 · Severe
- Chance of severe wind over 30 yrs
- 99.0%
Air-quality risk 3/10 · Minor
- Unhealthy air days now
- 3 days/yr
- Unhealthy air days in 30 yrs
- 4 days/yr
Risk factors via First Street. Map © Google.
Why this score? — see what drove the D grade
The composite is a weighted blend of 9 inputs, each scored 0–100. Each bar is that input's sub-score; the figure is the points it added to the 100-point composite (weight × sub-score).
- Cash flow +11.3/30.0
- 1% rule +9.2/10.0
- ARV discount +7.5/15.0
- Livability +3.7/5.0
- DSCR +3.3/10.0
- Schools +2.7/10.0
- Rent growth +2.5/5.0
- Condition / age +2.5/5.0
- Appreciation +0.0/10.0
$75,000
🖨 Deal sheet (PDF) 📄 Offer letter ✓ Due diligence
Listing remarks MLS
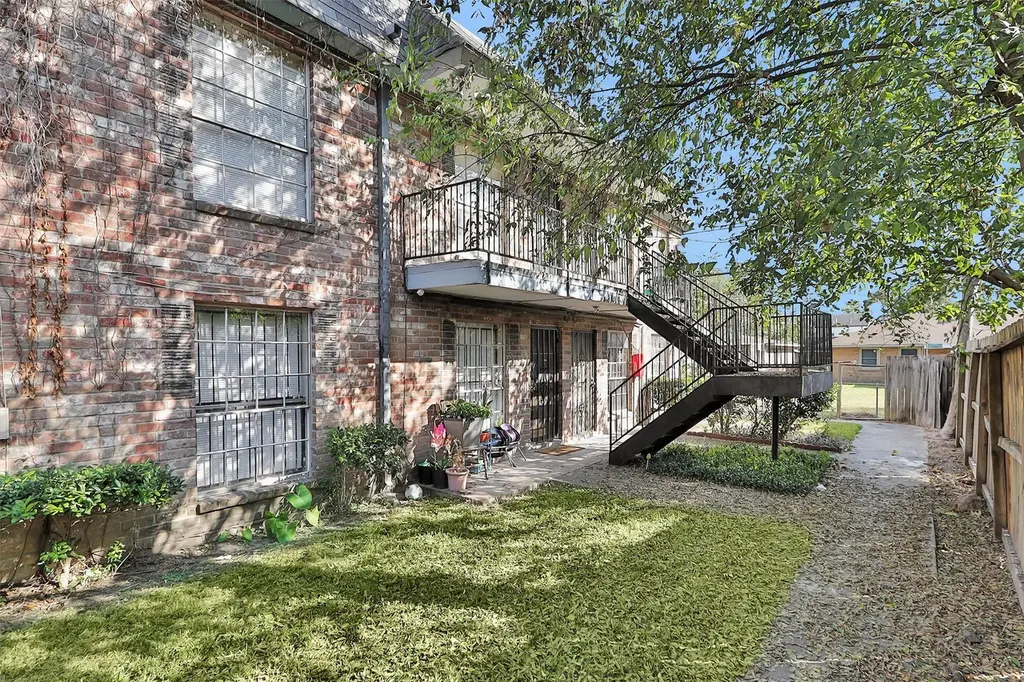
Welcome to this cozy 1-bedroom, 1-bath condominium located on the top floor of a quiet, well-kept complex. As you enter, you’re greeted by an open living and dining area that creates a warm and inviting atmosphere. The kitchen, though compact, offers functionality with ample cabinet space and a convenient pantry. The bedroom provides comfort and privacy, while the bathroom includes a shower/tub combo. Conveniently located off 45 North and W Tidwell just minutes from Downtown Houston. Perfect for first-time buyers, downsizers, or investors looking for a move-in-ready property in a great location!
Key facts
- Great location
- Ample cabinet space
- Convenient pantry
Tags
Neighborhood map
What this means for you Summary
Snapshot
- This is a 1-bed/1.0-bath condo listed at $75k.
Deal economics
- At list price, monthly cash flow is $-28 ($-334/yr) — negative.
- To cash-flow at today's rent, offer at most $70k (6.6% below list).
- Meets the 1% rule at list price ($1k rent vs $75k).
- Recommended offer: $66k (12.0% below list) — sets the bar for market timing.
- Cap rate 5.8% vs local median 3.2% in Houston — top-decile yield for the area; either an underpriced asset or a hidden risk that comps aren't pricing in. Stress-test before assuming the spread holds.
Location & tenants
- Location reads 74/100 on livability (#184 in TX, #4,771 nationally) — a middle-class / working-renter tenant base. Strengths: amenities A+, cost of living A+, housing A+; Watch: crime F.
- Houston ISD (urban): math 27% / reading 35% proficiency, ranked #593 of 826 in TX (top 72%) — families likely to look elsewhere, expect single-tenant / working-renter base with shorter leases; 71% free/reduced lunch — lower-income household profile, screen leases tightly.
- Zoned schools: Wesley El (math 22% / reading 22%, grade F, #3,333 of 4,322 statewide, top 80%, 270 students, 98% FRL); Williams Middle (math 9% / reading 15%, grade F, #1,623 of 1,662 statewide, top 98%, 411 students, 98% FRL); Washington B T H S (math 27% / reading 25%, grade F, #1,234 of 1,632 statewide, top 76%, 878 students, 96% FRL) — zoned schools average 97% FRL vs 71% district-wide (26 pts higher); higher-poverty schools than district average — tighter screening recommended.
- Market conditions: 84 active listings in the ZIP; 24 comparable units currently listed for rent nearby; rentals at typical pace (median 23d on market — plan ~3-4 weeks tenant-placement turnaround); 42% of comp listings sitting > 30 days — soft ceiling on asking rent; lower-income renter base — watch delinquency; 29,883 units permitted in Harris County in 2024 (8,621 in 5+ unit buildings).
- This rent runs 30% of the median local income ($43k/yr) — at the standard rent-burdened threshold; future hikes will face affordability resistance.
Forward outlook
- Local home prices are declining (-3.0%/yr); year-one equity from $519 of loan paydown is wiped out by about $2k of value loss. Plan a longer hold.
- Harris County population projected at +47% by 2050 — long-run rental-demand tailwind backs the buy-and-hold thesis.
Negotiation context
- It's been on market 250 days — a 12% lower offer ($66k) is reasonable based on typical stale-listing flexibility.
- 2 sale attempts since 2y ago with the ask held roughly flat each time — persistent listings suggest the price (not the market) is what's stuck; bring a comps-based counter.
Risks & watch-outs
- Watch-outs: HOA is 34% of rent.
- Climate carrying-cost: severe wind risk, 99% chance of damaging wind over 30y; extreme-heat days projected 7→22/yr by 2055 (HVAC capex compounding) — expect insurance premiums to compound above CPI over the hold.
Questions for the listing agent
- What do current leases actually rent for vs. the listed asking? Can we see a recent rent roll and the last 12 months of T-12 income?
- It's been on market 250 days. Have you received any prior offers? Is the seller open to a 12% concession, seller financing, or rate buy-down credit?
- Built in 1962 — when were the roof, HVAC, electrical panel, plumbing, and water heater last replaced?
- What does the HOA fee cover, when was the last increase, and are there any pending special assessments or reserve-fund shortfalls?
- Any open or pending special assessments — roof, HVAC, plumbing, elevator, façade? What's the per-unit balance and payoff schedule, and is the seller paying it off at close or rolling it to the buyer?
- Why hasn't it sold? Are there any deal-killer items the seller is aware of (foundation, flood, title, zoning, code violations)?
- Is there a deadline driving the sale (1031 exchange, divorce, estate, relocation)? That informs how much negotiation room exists.
- Schools are D-rated, which usually means shorter tenancies and higher turnover. Who's the typical renter profile here, and what's been the actual vacancy rate?
- Crime grade is F in this area — have there been break-ins, vandalism, or insurance claims at this property in the last 3 years? What carrier currently insures it and at what premium?
- The area grade is low — what's the realistic commute time and amenity access for the typical tenant pool here? Any planned neighborhood developments (good or bad) we should know about?
- What's the average days-on-market for RENTAL listings here right now (not sales)? A rising rental-DOM trend means longer vacancies and softer asking-rent achievability than the comps imply.
- What's the recent tenant-quality profile in this submarket — average credit score on applications, eviction rate, late-payment / NSF rate, and stable-employment percentage? A property-management company in the area should have these aggregated.
- How much new apartment / multifamily construction is in the pipeline within 1–3 miles? Heavy new supply (>2% of stock underway) typically softens rents 12–24 months out; light construction supports rent growth.
Investment metrics
- 1% rule
- 1.42% ✓
- Cap rate
- 5.85%
- Cash-on-cash
- -1.59%
- DSCR
- 0.93
- GRM
- 5.9
CMA / ARV
- ARV (median comp)
- $46,199
- List price
- $75,000
- Delta
- 62.34%
- Verdict
- OVERPRICED
- Comps
- 5 within 1.0 mi
Projected returns pro-forma
-3.0% appreciation · 3.0% rent growth · sell at horizon
- IRR
- -18.5%
- Equity multiple
- 0.35×
- Total profit
- $-13,693
- Equity at exit
- $11,183
- IRR
- -10.2%
- Equity multiple
- 0.37×
- Total profit
- $-13,263
- Equity at exit
- $6,485
Cash invested: $21,000 (down + closing). Projections, not guarantees.
Landlord ↔ Tenant lean methodology
- Overall (STATE)
- 87 Strongly Landlord-Friendly
- State Texas
- 87 Strongly Landlord-Friendly · R+5
- County
- — inherits STATE
- City
- — inherits STATE
ZIP-level market 77076
- Home prices YoY
- -21.5%
- Active inventory
- 84
- Price-to-rent
- 5.9×
Monthly cashflow live
- Estimated rent
- $1,066 high interval (Pro) →
- Mortgage (P&I)
- −$393
- Tax from tax record
- −$80 /mo · $955/yr
- Insurance
- −$31
- HOA
- −$366
- Vacancy / Maint / Mgmt
- −$224
- Net cashflow
- $-28
Break-even live
Sensitivity live
| Price | -10% $15 | -5% $-7 | +0% $-28 | +5% $-49 | +10% $-70 |
|---|---|---|---|---|---|
| Rent | -10% $-112 | -5% $-70 | +0% $-28 | +5% $14 | +10% $56 |
| Rate | -1.0pp $10 | -0.5pp $-9 | base $-28 | +0.5pp $-47 | +1.0pp $-67 |
UW: 25.0% down · 7.5% · 30yr · 1.5% tax · 5.0% vac · 8.0% maint · 8.0% mgmt
Financing live
Cash to close
- Down payment
- $18,750
- Closing costs
- $2,250
- Reserves months
- —
- Total cash needed
- —
Loan-product check · same deal, 3 products live
Conventional
25% down · 7.5% · 30yr
- Down + closing
- —
- Monthly P&I
- —
- Monthly cashflow
- —
- DSCR
- —
- Eligible?
- —
Personal DTI + credit; lowest rate.
DSCR
20% down · 8.5% · 30yr
- Down + closing
- —
- Monthly P&I
- —
- Monthly cashflow
- —
- DSCR
- —
- Eligible?
- —
No personal income docs; deal must DSCR.
Hard money
10% down · 12.0% · 12mo
- Down + closing
- —
- Monthly P&I
- —
- Monthly cashflow
- —
- DSCR
- —
- Eligible?
- —
Short-term bridge; refi at stabilization.
Rent comps 24 comps
| Address | Beds | Baths | Sqft | Rent | $/sqft | DOM | Units | Dist |
|---|---|---|---|---|---|---|---|---|
| 201 W Rosamond St Houston, TX | 1.0 | 1.0 | 430 | $948 | $2.20 | 20d | 2 | 0.04mi |
| 5606 Harvard St Unit 2 BEDROOM 11 Houston, TX | 2.0 | 1.0 | 720 | $895 | $1.24 | 45d | 1 | 0.37mi |
| 313 Sunnyside St Houston, TX | 1.0–3.0 | 1.0–2.0 | 922 | $756 | $0.82 | 45d | 16 | 0.48mi |
| 313 Sunnyside St Houston, TX | 1.0–2.0 | 1.0–1.5 | 880 | $766 | $0.87 | 1d | 40 | 0.48mi |
| 6301 Alfano St Houston, TX | 1.0 | 1.0 | 635 | $895 | $1.41 | 45d | 1 | 0.48mi |
| 101 E Tidwell Rd Houston, TX | 1.0–3.0 | 1.0 | 812 | $1,100 | $1.35 | 21d | 3 | 0.52mi |
| 101 E Tidwell Rd Houston, TX | 1.0–3.0 | 1.0 | 812 | $970 | $1.19 | 22d | 4 | 0.52mi |
| 101 E Tidwell Rd Houston, TX | 1.0–3.0 | 1.0 | 812 | $1,135 | $1.40 | 5d | 3 | 0.52mi |
| 446 W Parker Rd Houston, TX | 1.0 | 1.0 | 627 | $892 | $1.42 | 45d | 1 | 0.56mi |
| 423 W Tidwell Rd Houston, TX | 1.0 | 1.0 | 615 | $819 | $1.33 | 45d | 1 | 0.57mi |
| 450 E Rogers St Houston, TX | 1.0–3.0 | 1.0–2.0 | 911 | $1,070 | $1.17 | 1d | 13 | 0.83mi |
| 5050 Yale St Houston, TX | 1.0 | 1.0 | 627 | $773 | $1.23 | 14d | 1 | 0.85mi |
| 7026 Stuebner Airline Rd Houston, TX | 1.0 | 1.0 | 592 | $1,060 | $1.79 | 45d | 1 | 0.87mi |
| 5050 Yale St Unit 5071 Houston, TX | 1.0 | 1.0 | 627 | $773 | $1.23 | 0d | 1 | 0.87mi |
| 5050 Yale St Unit 5101 Houston, TX | 1.0 | 1.0 | 627 | $814 | $1.30 | 45d | 1 | 0.87mi |
| 5050 Yale St Unit 5071 Houston, TX | 1.0 | 1.0 | 627 | $819 | $1.31 | 16d | 1 | 0.87mi |
| 718 Pinemont Dr Houston, TX | 1.0 | 1.0 | 712 | $1,049 | $1.47 | 45d | 1 | 1.08mi |
| 306 Victoria Dr Houston, TX | 1.0 | 1.0 | 630 | $1,040 | $1.65 | 45d | 1 | 1.22mi |
| 510 E Little York Rd Houston, TX | 1.0 | 1.0 | 681 | $1,149 | $1.69 | 26d | 1 | 1.24mi |
| 510 E Little York Rd Houston, TX | 1.0 | 1.0 | 681 | $1,149 | $1.69 | 45d | 1 | 1.24mi |
| 4840 N Shepherd Dr Houston, TX | 3.0 | 1.0–2.0 | 870 | $1,683 | $1.93 | 5d | 21 | 1.24mi |
| 717 Lehman St Houston, TX | 1.0–3.0 | 1.0–3.0 | 1084 | $1,605 | $1.48 | 6d | 263 | 1.25mi |
| 600 E Little York Rd Houston, TX | 1.0–3.0 | 1.0–2.0 | 847 | $840 | $0.99 | 16d | 17 | 1.26mi |
| 5105 Airline Dr Houston, TX | 1.0–2.0 | 1.0–2.0 | 862 | $1,038 | $1.20 | 22d | 19 | 1.27mi |
HOA detail condo
- Monthly dues
- $366 · $4,392/yr
- Assessments
- None detected in remarks — confirm with the listing agent.
Listing history 18 events
-
2026-06-21days on market $75,000 Active 250 DOM
-
2026-06-18days on market $75,000 Active 247 DOM
-
2026-06-17days on market $75,000 Active 246 DOM
-
2026-06-16days on market $75,000 Active 245 DOM
-
2026-06-15days on market $75,000 Active 244 DOM
-
2026-06-13days on market $75,000 Active 242 DOM
-
2026-06-10days on market $75,000 Active 238 DOM
-
2026-06-08days on market $75,000 Active 237 DOM
-
2026-06-07days on market $75,000 Active 236 DOM
-
2026-06-04days on market $75,000 Active 233 DOM
-
2026-06-01days on market $75,000 Active 230 DOM
-
2026-05-31days on market $75,000 Active 229 DOM
-
2025-10-14$75,000 Active 608-char remark
Show marketing remark (608 chars)
Welcome to this cozy 1-bedroom, 1-bath condominium located on the top floor of a quiet, well-kept complex. As you enter, you’re greeted by an open living and dining area that creates a warm and inviting atmosphere. The kitchen, though compact, offers functionality with ample cabinet space and a convenient pantry. The bedroom provides comfort and privacy, while the bathroom includes a shower/tub combo. Conveniently located off 45 North and W Tidwell just minutes from Downtown Houston. Perfect for first-time buyers, downsizers, or investors looking for a move-in-ready property in a great location!
-
2024-12-11soldstatus Sold 271-char remark
Show marketing remark (271 chars)
Welcome to Rosetree Condominiums! Located right of the 45 feeder for quick access! This unit has been updated with new waterproof vinyl flooring thorough the condo. New electrical lights and outlets for efficiency. A modern neutral color ready for a family or investment.
-
2024-12-09soldstatus
-
2024-12-06status Pending 271-char remark
Show marketing remark (271 chars)
Welcome to Rosetree Condominiums! Located right of the 45 feeder for quick access! This unit has been updated with new waterproof vinyl flooring thorough the condo. New electrical lights and outlets for efficiency. A modern neutral color ready for a family or investment.
-
2024-12-04$49,995 Active 271-char remark
Show marketing remark (271 chars)
Welcome to Rosetree Condominiums! Located right of the 45 feeder for quick access! This unit has been updated with new waterproof vinyl flooring thorough the condo. New electrical lights and outlets for efficiency. A modern neutral color ready for a family or investment.
-
1994-03-30soldstatus
ⓘ Source: listings_history table (triggers on properties + properties_extension) + one-shot
backfill from property_details.listing_events for pre-trigger history.
Tax reassessment forecast TX · Resets to sale price
- Current annual tax
- $955 · $80/mo
- Projected year-2 tax
- $1,372 · $114/mo
- Expected delta
- +$418/yr (+$35/mo · 43.8%)
ⓘ Screening estimate from a state-policy table — verify with the county assessor before closing.
Climate risk First Street
- Flood 3/10 Moderate FEMA zone X (unshaded) · 20% chance over 30 yrs
- Wildfire 1/10 Low
- Heat 9/10 Extreme 7 d/yr ≥109°F today · 22 d/yr by 30 yrs out
- Wind 9/10 Extreme 99% chance of damaging wind over 30 yrs
- Air quality 3/10 Moderate 3 unhealthy d/yr today · 4 by 30 yrs out
Nearby sold comps map
Loading sold comps map…
Walkable amenities ~0.75 mi
Loading nearby amenities…
Taxation est. · year 1
- Rental income
- $12,794
- − Mortgage interest
- −$4,201
- − Property taxes
- −$955
- − Insurance
- −$375
- − Repairs & maintenance
- −$1,024
- − Management
- −$1,024
- − HOA
- −$4,392
- − Depreciation
- −$2,182
- Taxable loss
- −$1,358
- Est. tax savings @ 24.0%
- +$326
- After-tax cash flow
- $-8/yr
For passive investors: Depreciation is non-cash, so a rental often shows a tax loss while cash-flowing — sheltering income. Rental losses are passive: they offset passive income freely, and up to $25,000/yr can offset ordinary (W-2) income if you actively participate and your MAGI is under $100k (phasing out to $0 by $150k); unused losses carry forward. On sale, claimed depreciation is recaptured at up to 25%, and gains may owe capital-gains tax (a 1031 exchange can defer both). Figures are a year-1 estimate at your 24.0% rate — not tax advice; consult a CPA.
Schools (NCES district)
- District
- Houston ISD
- NCES district ID
- 4823640
- Math proficiency
- 27% ▼ -18.00%
- Reading proficiency
- 35% ▼ -6.00%
- Median HH income
- $46,054
- Composite
- 26.63/100
- National rank
- #7173
- State rank
- #593 of 826 in TX
Livability — Houston
- Score
- 74/100
- State rank
- #184
- US rank
- #4771
Category grades
Schools grade is shown separately in the Schools card above.
Census & demographics
- Census place
- Houston, TX
- County
- Harris County · 4,702,590 people
- City population
- 3,226,434
- Metro
- Houston-The Woodlands-Sugar Land, TX
- Population (ZIP)
- 31,222
- Household income
- $42,522
- Rent vs Own
- Severe rent burden
- 1781.0
Population outlook (Harris County) Hauer SSP2
- Today (2025)
- 5,571,493 people
- By 2030
- 6,089,821 · +9.3%
- By 2040
- 7,142,806 · +28.2%
- By 2050
- 8,185,864 · +46.9%
- By 2075
- 10,574,329 · +89.8%
- By 2100
- 12,109,958 · +117.4%
Race, ethnicity, and origin ACS 2023
- Neighborhood character
- Predominantly Hispanic (86%)
- Race & ethnicity
- Hispanic / Latino 86% Two or more races 29% Black 7% White 6%
- Hispanic origin (detail)
- Mexican 61%
- Common ancestry
- Romanian 1%
- Foreign-born
- 35% · Canada
- Languages at home
- 25% English-only · Spanish 74%
Political lean MEDSL · Harris
- 2024 margin
- Lean D (+5.5) · D 52.0% · R 46.4% · Other 1.6%
- 2008→2024 swing
- +3.9pp toward D · 2008: 1.6pp · 2024: 5.5pp
- All cycles
- 2024: D+5.5 2020: D+13.3 2016: D+12.4 2012: D+0.1 2008: D+1.6
Not yet ingested
- Civics
- —
Market trends
- HPI YoY
- ▼ -79.76%
- Current HPI
- 291.7578
- Rent YoY
- —
- Metro
- Houston-The Woodlands-Sugar Land, TX
- State GDP YoY
- ▲ 3.95%
- F500 in state
- 110
Industry mix (Fortune 500 HQ in TX)
| Industry | F500 HQs | Revenue |
|---|---|---|
| Energy | 16 | $1,198B |
|
||
| Technology | 5 | $198B |
|
||
| Engineering / Construction | 4 | $72B |
|
||
| Energy Services | 3 | $60B |
|
||
| Utilities | 3 | $41B |
|
||
| Healthcare | 2 | $330B |
|
||
Price history
+50.0% since first listed6 events — show timeline
- 2025-10-14 Listed $75,000 HARMLS
- 2024-12-11 Sold (MLS) — HARMLS
- 2024-12-09 Sold (Public Records) — Public Records
- 2024-12-06 Pending — HARMLS
- 2024-12-04 Listed $49,995 HARMLS
- 1994-03-30 Sold (Public Records) — Public Records
Property tax history
+4.9%/yrLatest (2025): $955 · -14.6% YoY. Source: county tax records.
Cash-flow waterfall
monthlySold comps — $/sqft
last 12 mo · ≤1 miLoading sold comps…