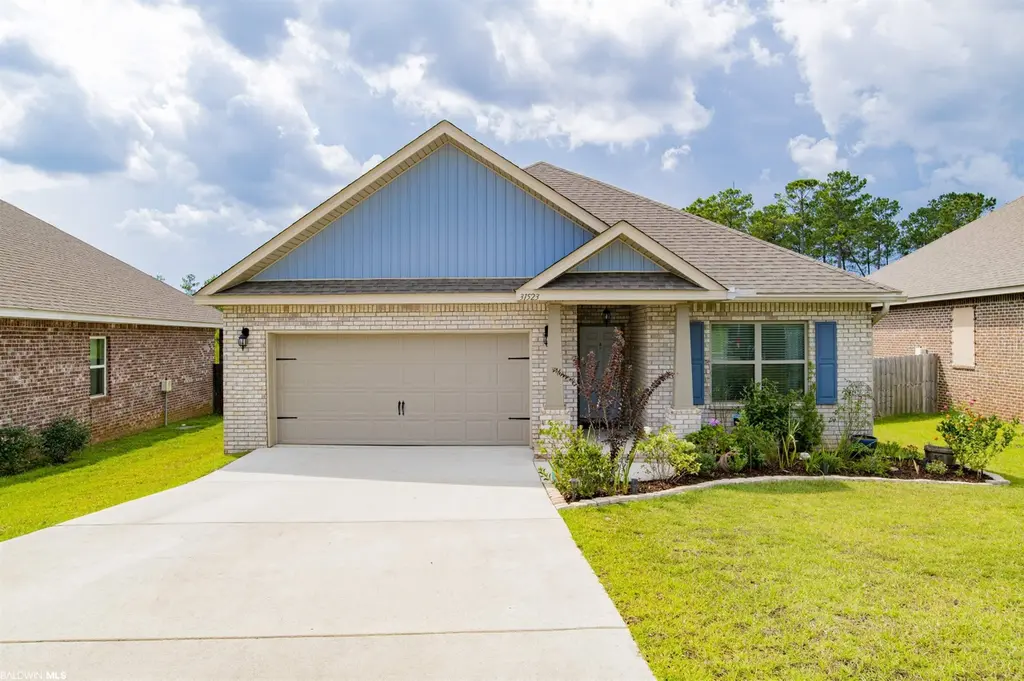
31523 Shearwater Dr · Loxley, AL
Flood risk 1/10 · Minimal
- FEMA flood zone
- X (unshaded)
- Chance of flooding over 30 yrs
- 0.0%
- Est. flood insurance / yr
- $507 – $1,088
Fire risk 5/10 · Moderate
- Est. fire insurance / yr
- $916 – $1,700
Heat risk 9/10 · Severe
- Hot days now (above 105°F)
- 7 days/yr
- Hot days in 30 yrs
- 23 days/yr
Wind risk 9/10 · Severe
- Chance of severe wind over 30 yrs
- 99.0%
Air-quality risk 3/10 · Minor
- Unhealthy air days now
- 2 days/yr
- Unhealthy air days in 30 yrs
- 4 days/yr
Risk factors via First Street. Map © Google.
Why this score? — see what drove the D- grade
The composite is a weighted blend of 9 inputs, each scored 0–100. Each bar is that input's sub-score; the figure is the points it added to the 100-point composite (weight × sub-score).
- ARV discount +12.2/15.0
- Cash flow +9.4/30.0
- Rent growth +4.1/5.0
- Schools +3.9/10.0
- Livability +3.3/5.0
- DSCR +2.7/10.0
- Condition / age +2.5/5.0
- 1% rule +1.8/10.0
- Appreciation +0.0/10.0
$299,900
🖨 Deal sheet (PDF) 📄 Offer letter ✓ Due diligence
Listing remarks
JUST $299,900 in Stonebridge!! Welcome to this Brick GOLD FORTIFIED home featuring 3 bedrooms, 2 bathrooms and an open split floor plan backing up to woods. Step inside to find a spacious living room featuring elegant tray ceilings and a custom floating shelf accent wall. The kitchen is a true standout with granite countertops, stainless steel appliances, gas stove, stylish backsplash, oversized pantry, and a refrigerator that conveys with the home. The private primary suite is tucked away at the back of the home and offers tray ceilings, a large walk-in closet, double vanity, soaking tub, and separate shower. Additional upgrades include upgraded light fixtures, blinds throughout, new carp
Key facts
- Gas stove
- Granite countertops
- Oversized pantry
Tags
Property features AI
Finance
- Other: Community pool managed by association
- HOA & community: Annual association fee; Association fee covers management, common area insurance, grounds maintenance, recreational facilities, reserve funds, common area taxes, and pool; Transfer fees apply
Exterior
- Parking: Attached double garage with automatic door; 2 covered parking spaces
- Utilities: Public water; Public sewer with grinder pump; Natural gas connected; Underground utilities; Tankless gas water heater; Riviera Utilities service
- Home design: Single-family residence; One story; Resale condition
- Construction: Built with brick and concrete board; Fortified-Gold construction; Slab foundation; Composition roof with ridge vent
- Exterior features: Covered rear porch and open porch; Termite contract; Fenced yard; Community pool (association); Community amenities: BBQ area, fitness center, outdoor pool, playground; Has view; Subdivision setting, elevation high
Interior
- Kitchen: Dishwasher; Disposal; Microwave; Gas range; Refrigerator with ice maker; Breakfast area (main level)
- Bedrooms: Main-level primary bedroom with walk-in closet (approx. 14 x 13); Two additional bedrooms (each approx. 11 x 10)
- Flooring: Carpet; Vinyl
- Bathrooms: Two full bathrooms; Primary bathroom with double vanity, soaking tub, separate shower and private water closet
- Heating & cooling: Electric heating; Heat pump cooling (SEER 14); Ceiling fans
- Interior features: Breakfast bar; Entrance foyer; Ceiling fans; High ceilings; Split bedroom plan; Storage
- Laundry & utility: Laundry room inside
Neighborhood map
What this means for you Summary
Snapshot
- This is a 3-bed/2.0-bath single-family listed at $300k.
Deal economics
- At list price, monthly cash flow is $-212 ($-3k/yr) — negative.
- To cash-flow at today's rent, offer at most $262k (12.5% below list).
- To meet the 1% rule (rent ≥ 1% of price), the offer needs to be $205k (31.6% below list).
- Recommended offer: $205k (31.6% below list) — sets the bar for 1% rule.
- Cap rate 5.4% vs local median 4.1% in Loxley — top-decile yield for the area; either an underpriced asset or a hidden risk that comps aren't pricing in. Stress-test before assuming the spread holds.
Location & tenants
- Location reads 66/100 on livability (#95 in AL) — a middle-class / working-renter tenant base. Strengths: housing A+, cost of living A, employment B; Watch: crime D, amenities F, commute F.
- Baldwin County (rural): math 33% / reading 57% proficiency, ranked #18 of 129 in AL (top 14%) — families likely to look elsewhere, expect single-tenant / working-renter base with shorter leases.
- Zoned schools: Stonebridge Elementary (509 students, 18% FRL); Spanish Fort Middle School (math 38% / reading 70%, grade B-, #20 of 257 statewide, top 8%, 622 students, 28% FRL); Spanish Fort High School (math 44% / reading 44%, grade F, #25 of 305 statewide, top 8%, 1,188 students, 24% FRL) — zoned schools average 23% FRL vs 38% district-wide (15 pts lower); this property's tenant base skews higher-income than the district average.
- Market conditions: Rents rising fast (+6.5%/yr); 332 active listings in the ZIP; 9 comparable units currently listed for rent nearby; rentals lingering (median 46d on market — plan ~5-8 weeks vacancy on turnover, expect pricing pressure); 56% of comp listings sitting > 30 days — soft ceiling on asking rent; high-income renter base; 3,883 units permitted in Baldwin County in 2024 (481 in 5+ unit buildings).
Forward outlook
- Local home prices are declining (-3.0%/yr); year-one equity from $2k of loan paydown is wiped out by about $9k of value loss. Plan a longer hold.
- Baldwin County population projected at +42% by 2050 — long-run rental-demand tailwind backs the buy-and-hold thesis.
Negotiation context
- It's been on market 25 days — a 2% lower offer ($295k) is reasonable based on typical stale-listing flexibility.
- 4 sale attempts since 9y ago with the ask held roughly flat each time — persistent listings suggest the price (not the market) is what's stuck; bring a comps-based counter.
Risks & watch-outs
- Climate carrying-cost: severe wind risk, 99% chance of damaging wind over 30y; moderate wildfire risk; extreme-heat days projected 7→23/yr by 2055 (HVAC capex compounding) — expect insurance premiums to compound above CPI over the hold.
Questions for the listing agent
- What do current leases actually rent for vs. the listed asking? Can we see a recent rent roll and the last 12 months of T-12 income?
- What does the HOA fee cover, when was the last increase, and are there any pending special assessments or reserve-fund shortfalls?
- Is there a deadline driving the sale (1031 exchange, divorce, estate, relocation)? That informs how much negotiation room exists.
- Schools are D-rated, which usually means shorter tenancies and higher turnover. Who's the typical renter profile here, and what's been the actual vacancy rate?
- Crime grade is D in this area — have there been break-ins, vandalism, or insurance claims at this property in the last 3 years? What carrier currently insures it and at what premium?
- The area grade is low — what's the realistic commute time and amenity access for the typical tenant pool here? Any planned neighborhood developments (good or bad) we should know about?
- What's the average days-on-market for RENTAL listings here right now (not sales)? A rising rental-DOM trend means longer vacancies and softer asking-rent achievability than the comps imply.
- What's the recent tenant-quality profile in this submarket — average credit score on applications, eviction rate, late-payment / NSF rate, and stable-employment percentage? A property-management company in the area should have these aggregated.
- How much new for-sale + rental construction is in the pipeline within 1–3 miles? Heavy new supply typically softens prices + rents 12–24 months out; constrained supply supports both.
Investment metrics
- 1% rule
- 0.68% ✗
- Cap rate
- 5.44%
- Cash-on-cash
- -3.03%
- DSCR
- 0.87
- GRM
- 12.2
CMA / ARV
- ARV (median comp)
- $335,140
- List price
- $299,900
- Delta
- -9.00%
- Verdict
- FAIR
- Comps
- 20 within 1.0 mi
Show comp detail 12 sales within ~0.75 mi
| Address | Dist | Beds/Ba | Sqft | Sold | Price | $/sf | Match |
|---|---|---|---|---|---|---|---|
| 31525 Plover Ct | 0.18mi | 4/2.0 (+1) | 1,825 (+9%) | 3mo | $256,000 | $140 | 69 |
| 31789 Canopy Loop | 0.47mi | 3/2.0 | 1,771 (+6%) | 1mo | $355,000 | $200 | 68 |
| 31544 Plover Ct | 0.22mi | 4/2.0 (+1) | 1,835 (+10%) | 6mo | $315,000 | $172 | 64 |
| 31654 Canopy Loop | 0.42mi | 3/2.0 | 1,881 (+12%) | 3mo | $400,000 | $213 | 58 |
| 31257 Palladian Way | 0.60mi | 4/2.0 (+1) | 1,768 (+6%) | 6mo | $314,000 | $178 | 52 |
| 31540 Memphis Loop | 0.61mi | 4/2.0 (+1) | 1,835 (+10%) | 4mo | $334,900 | $183 | 48 |
| 12652 Wagner Ave | 0.56mi | 3/2.0 | 1,925 (+15%) | 2mo | $370,440 | $192 | 47 |
| 12647 Wagner Ave | 0.56mi | 3/2.0 | 1,925 (+15%) | 4mo | $369,618 | $192 | 46 |
| 12436 Wagner Ave | 0.70mi | 3/2.0 | 1,925 (+15%) | 2mo | $379,018 | $197 | 41 |
| 31075 Bauer Ave | 0.63mi | 3/2.0 | 1,925 (+15%) | 6mo | $362,985 | $189 | 41 |
| 31246 Shambo Rd | 0.65mi | 3/2.0 | 1,448 (-14%) | 8mo | $250,000 | $173 | 40 |
| 12343 Wagner Ave | 0.72mi | 3/2.0 | 1,925 (+15%) | 3mo | $370,498 | $192 | 39 |
Match score weights: distance 35% · size 25% · config 20% · recency 20%. Top-matched comps best support the ARV.
Projected returns pro-forma
-3.0% appreciation · 6.52% rent growth · sell at horizon
- IRR
- -18.0%
- Equity multiple
- 0.35×
- Total profit
- $-54,707
- Equity at exit
- $44,716
- IRR
- -5.2%
- Equity multiple
- 0.62×
- Total profit
- $-32,321
- Equity at exit
- $25,930
Cash invested: $83,972 (down + closing). Projections, not guarantees.
Landlord ↔ Tenant lean methodology
- Overall (STATE)
- 90 Strongly Landlord-Friendly
- State Alabama
- 90 Strongly Landlord-Friendly · R+15
- County
- — inherits STATE
- City
- — inherits STATE
ZIP-level market 36527
- Home prices YoY
- -14.4%
- Rents YoY
- 6.5%
- Active inventory
- 332
- Price-to-rent
- 12.2×
Monthly cashflow live
- Estimated rent
- $2,052 high interval (Pro) →
- Mortgage (P&I)
- −$1,573
- Tax from tax record
- −$86 /mo · $1,028/yr
- Insurance
- −$125
- HOA
- −$50
- Vacancy / Maint / Mgmt
- −$431
- Net cashflow
- $-212
Break-even live
Sensitivity live
| Price | -10% $-42 | -5% $-127 | +0% $-212 | +5% $-297 | +10% $-382 |
|---|---|---|---|---|---|
| Rent | -10% $-374 | -5% $-293 | +0% $-212 | +5% $-131 | +10% $-50 |
| Rate | -1.0pp $-61 | -0.5pp $-136 | base $-212 | +0.5pp $-290 | +1.0pp $-369 |
UW: 25.0% down · 7.5% · 30yr · 1.5% tax · 5.0% vac · 8.0% maint · 8.0% mgmt
Financing live
Cash to close
- Down payment
- $74,975
- Closing costs
- $8,997
- Reserves months
- —
- Total cash needed
- —
Loan-product check · same deal, 3 products live
Conventional
25% down · 7.5% · 30yr
- Down + closing
- —
- Monthly P&I
- —
- Monthly cashflow
- —
- DSCR
- —
- Eligible?
- —
Personal DTI + credit; lowest rate.
DSCR
20% down · 8.5% · 30yr
- Down + closing
- —
- Monthly P&I
- —
- Monthly cashflow
- —
- DSCR
- —
- Eligible?
- —
No personal income docs; deal must DSCR.
Hard money
10% down · 12.0% · 12mo
- Down + closing
- —
- Monthly P&I
- —
- Monthly cashflow
- —
- DSCR
- —
- Eligible?
- —
Short-term bridge; refi at stabilization.
Rent comps 9 comps
| Address | Beds | Baths | Sqft | Rent | $/sqft | DOM | Units | Dist |
|---|---|---|---|---|---|---|---|---|
| 31573 Shearwater Dr Daphne, AL | 4.0 | 2.0 | 1830 | $1,995 | $1.09 | 23d | 1 | 0.05mi |
| 31448 Memphis Loop Daphne, AL | 4.0 | 2.0 | 2033 | $2,400 | $1.18 | 15d | 1 | 0.61mi |
| 32231 Emancipation Cir Spanish Fort, AL | 3.0 | 2.5 | 1492 | $1,850 | $1.24 | 45d | 1 | 0.67mi |
| 31100 Falling Waters Loop Daphne, AL | 2.0–4.0 | 1.0–2.0 | 1158 | $1,974 | $1.70 | 45d | 1 | 0.69mi |
| 31697 Lyon Rd Spanish Fort, AL | 4.0 | 2.0 | 1787 | $2,500 | $1.40 | 23d | 1 | 0.85mi |
| 11801 Balsam Ct Daphne, AL | 4.0 | 2.0 | 1783 | $2,195 | $1.23 | 23d | 1 | 1.00mi |
| 11730 Madrone Ln Daphne, AL | 3.0 | 2.0 | 1608 | $1,895 | $1.18 | 45d | 1 | 1.07mi |
| 13445 Antler Hill Rd Spanish Fort, AL | 4.0 | 2.0 | 1921 | $2,100 | $1.09 | 45d | 1 | 1.08mi |
| 13708 Antler Hill Rd Daphne, AL | 4.0 | 2.0 | 1948 | $2,300 | $1.18 | 45d | 1 | 1.20mi |
HOA detail
- Monthly dues
- $50 · $600/yr
- Likely covers
- gas
Listing history 32 events
-
2026-06-21days on market $299,900 Active 25 DOM
-
2026-06-19days on market $299,900 Active 23 DOM
-
2026-06-18days on market $299,900 Active 22 DOM
-
2026-06-17days on market $299,900 Active 21 DOM
-
2026-06-16days on market $299,900 Active 20 DOM
-
2026-06-15days on market $299,900 Active 19 DOM
-
2026-06-14days on market $299,900 Active 17 DOM
-
2026-06-13days on market $299,900 Active 16 DOM
-
2026-06-10days on market $299,900 Active 14 DOM
-
2026-06-09days on market $299,900 Active 13 DOM
-
2026-06-08days on market $299,900 Active 12 DOM
-
2026-06-07days on market $299,900 Active 11 DOM
-
2026-06-05days on market $299,900 Active 8 DOM
-
2026-06-03days on market $299,900 Active 7 DOM
-
2026-06-02days on market $299,900 Active 6 DOM
-
2026-06-01days on market $299,900 Active 5 DOM
-
2026-05-31days on market $299,900 Active 4 DOM
-
2026-05-30days on market $299,900 Active 3 DOM
-
2026-04-09price $304,975
-
2026-04-09price $304,975
-
2026-02-25price $309,975
-
2026-02-25price $309,975
-
2026-01-27price $314,975
-
2026-01-27price $314,975
-
2025-12-02price $319,975
-
2025-12-02price $319,975
-
2025-10-10$324,975 Active
-
2021-10-19soldstatus $270,000
-
2021-10-14soldstatus $270,000
-
2021-09-08$275,000
-
2018-03-02soldstatus $211,900
-
2017-10-24$211,900
ⓘ Source: listings_history table (triggers on properties + properties_extension) + one-shot
backfill from property_details.listing_events for pre-trigger history.
Tax reassessment forecast AL · Resets to sale price
- Current annual tax
- $1,028 · $86/mo
- Projected year-2 tax
- $1,230 · $102/mo
- Expected delta
- +$202/yr (+$17/mo · 19.6%)
ⓘ Screening estimate from a state-policy table — verify with the county assessor before closing.
Climate risk First Street
- Flood 1/10 Low FEMA zone X (unshaded) · 0% chance over 30 yrs
- Wildfire 5/10 Major
- Heat 9/10 Extreme 7 d/yr ≥105°F today · 23 d/yr by 30 yrs out
- Wind 9/10 Extreme 99% chance of damaging wind over 30 yrs
- Air quality 3/10 Moderate 2 unhealthy d/yr today · 4 by 30 yrs out
Nearby sold comps map
Loading sold comps map…
Walkable amenities ~0.75 mi
Loading nearby amenities…
Taxation est. · year 1
- Rental income
- $24,624
- − Mortgage interest
- −$16,799
- − Property taxes
- −$1,028
- − Insurance
- −$1,500
- − Repairs & maintenance
- −$1,970
- − Management
- −$1,970
- − HOA
- −$600
- − Depreciation
- −$8,724
- Taxable loss
- −$7,967
- Est. tax savings @ 24.0%
- +$1,912
- After-tax cash flow
- $-635/yr
For passive investors: Depreciation is non-cash, so a rental often shows a tax loss while cash-flowing — sheltering income. Rental losses are passive: they offset passive income freely, and up to $25,000/yr can offset ordinary (W-2) income if you actively participate and your MAGI is under $100k (phasing out to $0 by $150k); unused losses carry forward. On sale, claimed depreciation is recaptured at up to 25%, and gains may owe capital-gains tax (a 1031 exchange can defer both). Figures are a year-1 estimate at your 24.0% rate — not tax advice; consult a CPA.
Schools (NCES district)
- District
- Baldwin County
- NCES district ID
- 0100270
- Math proficiency
- 33% ▼ -26.00%
- Reading proficiency
- 57% ▲ 1.00%
- Median HH income
- $50,677
- Composite
- 38.61/100
- National rank
- #4157
- State rank
- #18 of 129 in AL
Livability — Loxley
- Score
- 66/100
- State rank
- #95
- US rank
- #11346
Category grades
Schools grade is shown separately in the Schools card above.
Census & demographics
- Census place
- Loxley, AL
- County
- Baldwin County · 181,514 people
- Metro
- Daphne-Fairhope-Foley, AL
- Population (ZIP)
- 21,765
- Household income
- $120,189
- Rent vs Own
- Severe rent burden
- 378.0
Population outlook (Baldwin County) Hauer SSP2
- Today (2025)
- 248,264 people
- By 2030
- 270,315 · +8.9%
- By 2040
- 312,967 · +26.1%
- By 2050
- 352,262 · +41.9%
- By 2075
- 438,841 · +76.8%
- By 2100
- 487,736 · +96.5%
Race, ethnicity, and origin ACS 2023
- Neighborhood character
- Predominantly White (80%)
- Race & ethnicity
- White 80% Two or more races 8% Black 6% Hispanic / Latino 5% Asian 2%
- Hispanic origin (detail)
- Mexican 2%
- Common ancestry
- Lithuanian 4% Slovak 2% Serbian 2%
- Foreign-born
- 6% · Canada, Jamaica, South Korea
- Languages at home
- 95% English-only · Spanish 3%
Political lean MEDSL · Baldwin
- 2024 margin
- Solid R (+58.2) · D 20.5% · R 78.7%
- 2008→2024 swing
- -6.7pp toward R · 2008: -51.5pp · 2024: -58.2pp
- All cycles
- 2024: R+58.2 2020: R+53.8 2016: R+57.8 2012: R+55.8 2008: R+51.5
Not yet ingested
- Civics
- —
Market trends
- HPI YoY
- ▼ -39.56%
- Current HPI
- 234.5113
- Rent YoY
- ▲ 6.52%
- Metro
- Daphne-Fairhope-Foley, AL
- State GDP YoY
- ▲ 2.94%
- F500 in state
- 4
Industry mix (Fortune 500 HQ in AL)
| Industry | F500 HQs | Revenue |
|---|---|---|
| Financial Services | 1 | $8B |
|
||
| Healthcare | 1 | $5B |
|
||
Price history
+41.5% since first listed15 events — show timeline
- 2026-05-26 Listed $299,900 BCAR
- 2026-04-09 Price Changed $304,975 GCMLS AL
- 2026-04-09 Price Changed $304,975 BCAR
- 2026-02-25 Price Changed $309,975 GCMLS AL
- 2026-02-25 Price Changed $309,975 BCAR
- 2026-01-27 Price Changed $314,975 GCMLS AL
- 2026-01-27 Price Changed $314,975 BCAR
- 2025-12-02 Price Changed $319,975 GCMLS AL
- 2025-12-02 Price Changed $319,975 BCAR
- 2025-10-10 Listed $324,975 BCAR
- 2021-10-19 Sold (Public Records) $270,000 Public Records
- 2021-10-14 Sold (MLS) $270,000 BCAR
- 2021-09-08 Listed $275,000 BCAR
- 2018-03-02 Sold (MLS) $211,900 BCAR
- 2017-10-24 Listed $211,900 BCAR
Property tax history
+30.5%/yrLatest (2025): $1,028 · -4.4% YoY. Source: county tax records.
Cash-flow waterfall
monthlySold comps — $/sqft
last 12 mo · ≤1 miLoading sold comps…