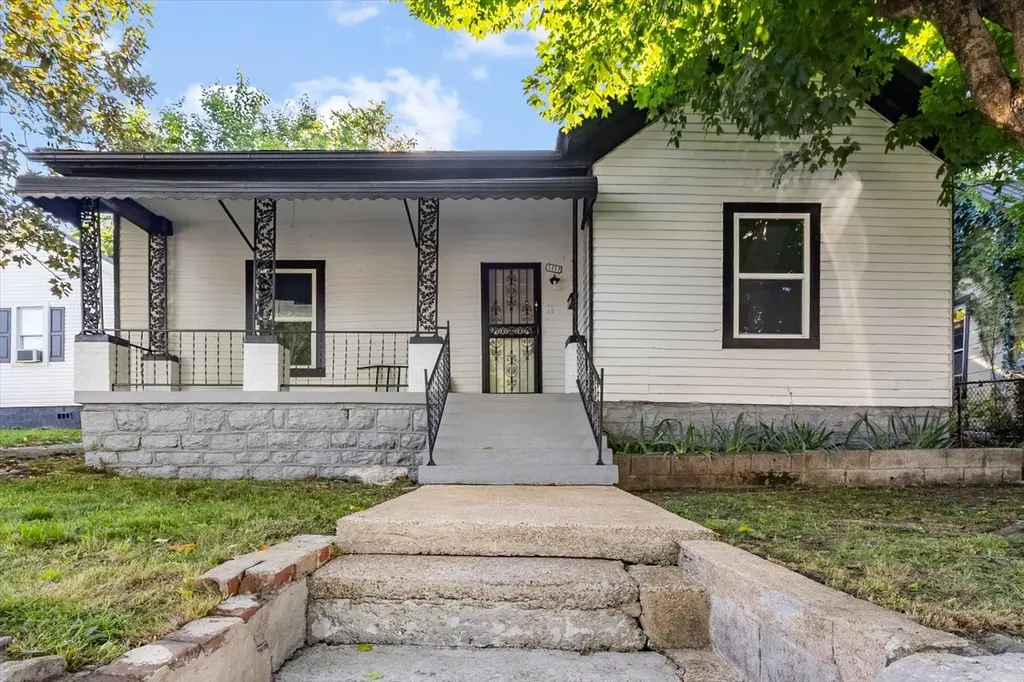
1117 S Glade St · Columbia, TN
Flood risk 1/10 · Minimal
- FEMA flood zone
- X (unshaded)
- Chance of flooding over 30 yrs
- 0.0%
- Est. flood insurance / yr
- $507 – $1,088
Fire risk 3/10 · Minor
- Est. fire insurance / yr
- $949 – $1,763
Heat risk 6/10 · Moderate
- Hot days now (above 106°F)
- 7 days/yr
- Hot days in 30 yrs
- 19 days/yr
Wind risk 4/10 · Minor
- Chance of severe wind over 30 yrs
- 13.0%
Air-quality risk 1/10 · Minimal
- Unhealthy air days now
- 0 days/yr
- Unhealthy air days in 30 yrs
- 0 days/yr
Risk factors via First Street. Map © Google.
Why this score? — see what drove the C grade
The composite is a weighted blend of 9 inputs, each scored 0–100. Each bar is that input's sub-score; the figure is the points it added to the 100-point composite (weight × sub-score).
- Cash flow +19.8/30.0
- ARV discount +15.0/15.0
- DSCR +6.3/10.0
- 1% rule +4.1/10.0
- Rent growth +3.7/5.0
- Livability +3.2/5.0
- Condition / age +2.5/5.0
- Schools +1.8/10.0
- Appreciation +0.0/10.0
$179,999
🖨 Deal sheet 📄 Offer letter ✓ Due diligence
Listing remarks MLS
Charming 3-bedroom, 2-bath home offering 1,128 square feet of comfortable living space in the heart of Columbia! This well-maintained property features a functional layout with spacious bedrooms, a private primary suite, and inviting living areas perfect for everyday living or entertaining. Conveniently located near shopping, dining, schools, and major roadways, this home combines accessibility with neighborhood charm. Whether you’re a first-time buyer, downsizing, or searching for an investment opportunity, this property is full of potential. Schedule your showing today!
Key facts
- Rental income
- Conveniently located
- Growing area
Tags
Property features AI
Exterior
- Parking: Detached garage (1 covered space, 1 total garage space)
- Utilities: Public water; No sewer; Water available
- Home design: Single-family residence; One story
- Construction: Frame construction with wood siding; Year built: approximate
- Exterior features: Lot roughly 0.12 acres (approx. 53 x 100)
Interior
- Kitchen: Electric oven; Electric range; Dishwasher; Refrigerator
- Bedrooms: Three bedrooms (all on the main level)
- Flooring: Laminate flooring
- Bathrooms: Two full bathrooms
- Heating & cooling: Central heating; Central air
- Interior features: Electric oven and electric range; Dishwasher; Refrigerator; Laminate flooring; Central heating; Central air
Neighborhood map
What this means for you Summary
Snapshot
- This is a 3-bed/1.0-bath single-family listed at $180k.
Deal economics
- At list price, monthly cash flow is $214 ($3k/yr) — positive.
- The deal already cash-flows at list — no discount required.
- To meet the 1% rule (rent ≥ 1% of price), the offer needs to be $165k (8.6% below list).
- Recommended offer: $165k (8.6% below list) — sets the bar for 1% rule.
- Cap rate 7.7% vs local median 2.8% in Columbia — top-decile yield for the area; either an underpriced asset or a hidden risk that comps aren't pricing in. Stress-test before assuming the spread holds.
Location & tenants
- Location reads 63/100 on livability (#207 in TN) — a middle-class / working-renter tenant base. Strengths: cost of living A+, housing A+; Watch: employment C-, health & safety C-, crime F.
- Maury County (town): math 19% / reading 21% proficiency, ranked #108 of 139 in TN (top 78%) — low school quality limits family demand, transient renter base, plan for 1-2y turnover.
- Zoned schools: R Howell Elementary (math 22% / reading 17%, grade F, #654 of 952 statewide, top 72%, 645 students, 0% FRL); Columbia Central High School (math 7% / reading 27%, grade F, #225 of 332 statewide, top 69%, 1,474 students, 0% FRL) — zoned schools average 0% FRL vs 48% district-wide (48 pts lower); this property's tenant base skews higher-income than the district average.
- Market conditions: Rents rising fast (+5.0%/yr); 1118 active listings in the ZIP; 18 comparable units currently listed for rent nearby; rentals at typical pace (median 24d on market — plan ~3-4 weeks tenant-placement turnaround); 1,650 units permitted in Maury County in 2024 (60 in 5+ unit buildings).
Forward outlook
- Local home prices are declining (-3.0%/yr); year-one equity from $1k of loan paydown is wiped out by about $5k of value loss. Plan a longer hold.
- Maury County population projected at +34% by 2050 — long-run rental-demand tailwind backs the buy-and-hold thesis.
Negotiation context
- It's been on market 34 days — a 3% lower offer ($175k) is reasonable based on typical stale-listing flexibility.
- 6 sale attempts; this cycle's ask has dropped $10k (5%) from the opening price — seller is motivated, your offer sets the floor, not the list.
- Current owner paid $141k; 27% above their basis — modest negotiation headroom, anchor on the comps not their cost.
Risks & watch-outs
- Watch-outs: built in 1925 — expect roof / HVAC / electrical / plumbing capex.
- Climate carrying-cost: extreme-heat days projected 7→19/yr by 2055 (HVAC capex compounding) — expect insurance premiums to compound above CPI over the hold.
Questions for the listing agent
- It's been on market 34 days. Have you received any prior offers? Is the seller open to a 9% concession, seller financing, or rate buy-down credit?
- Built in 1925 — when were the roof, HVAC, electrical panel, plumbing, and water heater last replaced?
- Is there a deadline driving the sale (1031 exchange, divorce, estate, relocation)? That informs how much negotiation room exists.
- Schools are F-rated, which usually means shorter tenancies and higher turnover. Who's the typical renter profile here, and what's been the actual vacancy rate?
- Crime grade is F in this area — have there been break-ins, vandalism, or insurance claims at this property in the last 3 years? What carrier currently insures it and at what premium?
- What's the average days-on-market for RENTAL listings here right now (not sales)? A rising rental-DOM trend means longer vacancies and softer asking-rent achievability than the comps imply.
- What's the recent tenant-quality profile in this submarket — average credit score on applications, eviction rate, late-payment / NSF rate, and stable-employment percentage? A property-management company in the area should have these aggregated.
- How much new for-sale + rental construction is in the pipeline within 1–3 miles? Heavy new supply typically softens prices + rents 12–24 months out; constrained supply supports both.
Investment metrics
- 1% rule
- 0.91% ✗
- Cap rate
- 7.72%
- Cash-on-cash
- 5.10%
- DSCR
- 1.23
- GRM
- 9.1
CMA / ARV
- ARV (median comp)
- $268,150
- List price
- $179,999
- Delta
- -32.87%
- Verdict
- UNDERPRICED
- Comps
- 20 within 1.0 mi
Show comp detail 12 sales within ~0.75 mi
| Address | Dist | Beds/Ba | Sqft | Sold | Price | $/sf | Match |
|---|---|---|---|---|---|---|---|
| 10261/2 Bridge St | 0.12mi | 3/2.0 | 1,107 (-2%) | 4mo | $85,000 | $77 | 84 |
| 314 W 10th St | 0.46mi | 3/2.0 | 1,133 (+0%) | 2mo | $100,000 | $88 | 72 |
| 318 E 11th St | 0.10mi | 3/2.0 | 1,275 (+13%) | 2mo | $215,000 | $169 | 68 |
| 511 E 8th St | 0.43mi | 3/2.0 | 1,075 (-5%) | 3mo | $52,000 | $48 | 66 |
| 317 E 17th St | 0.52mi | 3/2.0 | 1,056 (-6%) | 2mo | $210,000 | $199 | 60 |
| 322 E 15th St | 0.44mi | 2/2.0 (-1) | 1,190 (+6%) | 4mo | $244,000 | $205 | 58 |
| 1899 Cherry St | 0.65mi | 3/1.0 | 1,047 (-7%) | 0mo | $245,900 | $235 | 57 |
| 503 E 8th St | 0.41mi | 3/2.0 | 1,250 (+11%) | 3mo | $284,900 | $228 | 56 |
| 1904 Cherry St | 0.67mi | 3/1.0 | 1,040 (-8%) | 2mo | $207,000 | $199 | 54 |
| 111 E 15th St | 0.44mi | 2/2.0 (-1) | 1,008 (-11%) | 2mo | $245,000 | $243 | 51 |
| 1612 S Main St | 0.58mi | 2/2.0 (-1) | 1,254 (+11%) | 5mo | $235,000 | $187 | 41 |
| 412 Mooresville Pike | 0.55mi | 2/1.5 (-1) | 1,280 (+14%) | 5mo | $190,000 | $148 | 41 |
Match score weights: distance 35% · size 25% · config 20% · recency 20%. Top-matched comps best support the ARV.
Projected returns pro-forma
-3.0% appreciation · 4.97% rent growth · sell at horizon
- IRR
- -6.5%
- Equity multiple
- 0.76×
- Total profit
- $-12,263
- Equity at exit
- $26,838
- IRR
- 5.2%
- Equity multiple
- 1.41×
- Total profit
- $20,817
- Equity at exit
- $15,563
Cash invested: $50,400 (down + closing). Projections, not guarantees.
Landlord ↔ Tenant lean methodology
- Overall (STATE)
- 87 Strongly Landlord-Friendly
- State Tennessee
- 87 Strongly Landlord-Friendly · R+13
- County
- — inherits STATE
- City
- — inherits STATE
ZIP-level market 38401
- Home prices YoY
- -22.7%
- Rents YoY
- 5.0%
- Active inventory
- 1118
- Price-to-rent
- 9.1×
Monthly cashflow live
- Estimated rent
- $1,646 high interval (Pro) →
- Mortgage (P&I)
- −$944
- Tax from tax record
- −$67 /mo · $806/yr
- Insurance
- −$75
- HOA
- −$0
- Vacancy / Maint / Mgmt
- −$346
- Net cashflow
- $214
Break-even live
UW: 25.0% down · 7.5% · 30yr · 1.5% tax · 5.0% vac · 8.0% maint · 8.0% mgmt
Financing live
Cash to close
- Down payment
- $45,000
- Closing costs
- $5,400
- Reserves months
- —
- Total cash needed
- —
Loan-product check · same deal, 3 products live
Conventional
25% down · 7.5% · 30yr
- Down + closing
- —
- Monthly P&I
- —
- Monthly cashflow
- —
- DSCR
- —
- Eligible?
- —
Personal DTI + credit; lowest rate.
DSCR
20% down · 8.5% · 30yr
- Down + closing
- —
- Monthly P&I
- —
- Monthly cashflow
- —
- DSCR
- —
- Eligible?
- —
No personal income docs; deal must DSCR.
Hard money
10% down · 12.0% · 12mo
- Down + closing
- —
- Monthly P&I
- —
- Monthly cashflow
- —
- DSCR
- —
- Eligible?
- —
Short-term bridge; refi at stabilization.
Rent comps 18 comps
| Address | Beds | Baths | Sqft | Rent | $/sqft | DOM | Units | Dist |
|---|---|---|---|---|---|---|---|---|
| 505 Washington St Columbia, TN | 3.0 | 2.0 | 1241 | $1,950 | $1.57 | 43d | 1 | 0.18mi |
| 1510 Whatley St Columbia, TN | 2.0 | 1.0 | 832 | $1,050 | $1.26 | 12d | 1 | 0.37mi |
| 915 Mapleash Ave Columbia, TN | 4.0 | 2.0 | 1308 | $1,995 | $1.53 | 43d | 1 | 0.37mi |
| 908 Mapleash Ave Columbia, TN | 3.0 | 2.0 | 1112 | $1,750 | $1.57 | 17d | 1 | 0.39mi |
| 109 E 15th St Columbia, TN | 2.0 | 1.0 | 812 | $1,500 | $1.85 | 43d | 1 | 0.46mi |
| 319 W 14th St Columbia, TN | 2.0 | 1.0 | 1350 | $1,375 | $1.02 | 23d | 1 | 0.56mi |
| 1214 School St Columbia, TN | 2.0 | 1.0 | 1036 | $1,300 | $1.25 | 23d | 1 | 0.58mi |
| 314 E 18th St Columbia, TN | 3.0 | 1.0 | 988 | $999 | $1.01 | 14d | 1 | 0.64mi |
| 615 N High St Unit B Columbia, TN | 3.0 | 2.5 | 1200 | $1,300 | $1.08 | 23d | 1 | 0.73mi |
| 100 Stonebridge Way Columbia, TN | 2.0–3.0 | 2.0 | 1067 | $1,485 | $1.39 | 1d | 4 | 0.83mi |
| 203 Stewart St Unit a Columbia, TN | 2.0 | 1.0 | 850 | $1,200 | $1.41 | 20d | 1 | 0.92mi |
| 405 Fleming St Columbia, TN | 3.0 | 2.0 | 1470 | $1,700 | $1.16 | 44d | 1 | 1.15mi |
| 208 Hill St Columbia, TN | 2.0 | 1.0 | 901 | $1,450 | $1.61 | 23d | 1 | 1.15mi |
| 1923 Woodmont Dr Columbia, TN | 3.0 | 1.0 | 1222 | $1,700 | $1.39 | 23d | 1 | 1.27mi |
| 600 Hallmark Dr Columbia, TN | 3.0 | 2.0 | 1138 | $1,479 | $1.30 | 43d | 3 | 1.28mi |
| 700 Fleming St Columbia, TN | 3.0 | 1.5 | 1008 | $1,650 | $1.64 | 7d | 1 | 1.33mi |
| 103 Naydonlin Dr Unit B Columbia, TN | 2.0 | 1.0 | 712 | $1,100 | $1.54 | 43d | 1 | 1.41mi |
| 927 Sutton Cv Columbia, TN | 2.0 | 2.5 | 1230 | $1,400 | $1.14 | 23d | 1 | 1.44mi |
Listing history 34 events
-
2026-06-18days on market $179,999 Active 34 DOM
-
2026-06-17days on market $179,999 Active 33 DOM
-
2026-06-16days on market $179,999 Active 32 DOM
-
2026-06-15days on market $179,999 Active 31 DOM
-
2026-06-13days on market $179,999 Active 29 DOM
-
2026-06-13days on market $179,999 Active 28 DOM
-
2026-06-09remarks 409-char remark
-
2026-06-09days on market $179,999 Active 25 DOM
-
2026-06-08days on market $179,999 Active 24 DOM
-
2026-06-07days on market $179,999 Active 23 DOM
-
2026-06-03days on market $179,999 Active 19 DOM
-
2026-06-02days on market $179,999 Active 18 DOM
-
2026-06-02price $179,999 Active 17 DOM
-
2026-06-01days on market $189,999 Active 17 DOM
-
2026-05-31days on market $189,999 Active 16 DOM
-
2026-05-15$189,999 Active 360-char remark
-
2026-05-04soldstatus $141,263 Closed 584-char remark
Show marketing remark (584 chars)
Charming 3-bedroom, 2-bath home offering 1,128 square feet of comfortable living space in the heart of Columbia! This well-maintained property features a functional layout with spacious bedrooms, a private primary suite, and inviting living areas perfect for everyday living or entertaining. Conveniently located near shopping, dining, schools, and major roadways, this home combines accessibility with neighborhood charm. Whether you’re a first-time buyer, downsizing, or searching for an investment opportunity, this property is full of potential. Schedule your showing today!
-
2026-03-24historical Active Under Contract 584-char remark
Show marketing remark (584 chars)
Charming 3-bedroom, 2-bath home offering 1,128 square feet of comfortable living space in the heart of Columbia! This well-maintained property features a functional layout with spacious bedrooms, a private primary suite, and inviting living areas perfect for everyday living or entertaining. Conveniently located near shopping, dining, schools, and major roadways, this home combines accessibility with neighborhood charm. Whether you’re a first-time buyer, downsizing, or searching for an investment opportunity, this property is full of potential. Schedule your showing today!
-
2026-03-20price $189,000 584-char remark
Show marketing remark (584 chars)
Charming 3-bedroom, 2-bath home offering 1,128 square feet of comfortable living space in the heart of Columbia! This well-maintained property features a functional layout with spacious bedrooms, a private primary suite, and inviting living areas perfect for everyday living or entertaining. Conveniently located near shopping, dining, schools, and major roadways, this home combines accessibility with neighborhood charm. Whether you’re a first-time buyer, downsizing, or searching for an investment opportunity, this property is full of potential. Schedule your showing today!
-
2026-02-15$236,000 Active 584-char remark
Show marketing remark (584 chars)
Charming 3-bedroom, 2-bath home offering 1,128 square feet of comfortable living space in the heart of Columbia! This well-maintained property features a functional layout with spacious bedrooms, a private primary suite, and inviting living areas perfect for everyday living or entertaining. Conveniently located near shopping, dining, schools, and major roadways, this home combines accessibility with neighborhood charm. Whether you’re a first-time buyer, downsizing, or searching for an investment opportunity, this property is full of potential. Schedule your showing today!
-
2025-12-17historical
-
2025-12-17historical
-
2025-10-09status Active
-
2025-10-07$230,000 Active
-
2025-10-01historical
-
2025-09-03status Active
-
2025-08-19historical Active Under Contract
-
2025-07-21price $230,000
-
2025-06-30$249,000 Active
-
2022-04-01soldstatus $85,000
-
2005-08-17soldstatus $39,000
-
2004-02-24soldstatus $10,000
-
2004-02-24soldstatus $14,000
-
2004-02-24soldstatus $34,000
ⓘ Source: listings_history table (triggers on properties + properties_extension) + one-shot
backfill from property_details.listing_events for pre-trigger history.
Tax reassessment forecast TN · Resets to sale price
- Current annual tax
- $806 · $67/mo
- Projected year-2 tax
- $1,278 · $106/mo
- Expected delta
- +$472/yr (+$39/mo · 58.6%)
ⓘ Screening estimate from a state-policy table — verify with the county assessor before closing.
Climate risk First Street
- Flood 1/10 Low FEMA zone X (unshaded) · 0% chance over 30 yrs
- Wildfire 3/10 Moderate
- Heat 6/10 Major 7 d/yr ≥106°F today · 19 d/yr by 30 yrs out
- Wind 4/10 Moderate 13% chance of damaging wind over 30 yrs
- Air quality 1/10 Low 0 unhealthy d/yr today · 0 by 30 yrs out
Nearby sold comps map
Loading sold comps map…
Walkable amenities ~0.75 mi
Loading nearby amenities…
Taxation est. · year 1
- Rental income
- $19,753
- − Mortgage interest
- −$10,083
- − Property taxes
- −$806
- − Insurance
- −$900
- − Repairs & maintenance
- −$1,580
- − Management
- −$1,580
- − Depreciation
- −$5,236
- Taxable loss
- −$432
- Est. tax savings @ 24.0%
- +$104
- After-tax cash flow
- $2,676/yr
For passive investors: Depreciation is non-cash, so a rental often shows a tax loss while cash-flowing — sheltering income. Rental losses are passive: they offset passive income freely, and up to $25,000/yr can offset ordinary (W-2) income if you actively participate and your MAGI is under $100k (phasing out to $0 by $150k); unused losses carry forward. On sale, claimed depreciation is recaptured at up to 25%, and gains may owe capital-gains tax (a 1031 exchange can defer both). Figures are a year-1 estimate at your 24.0% rate — not tax advice; consult a CPA.
Schools (NCES district)
- District
- Maury County
- NCES district ID
- 4702760
- Math proficiency
- 19% ▼ -5.00%
- Reading proficiency
- 21% ▼ -4.00%
- Median HH income
- $47,668
- Composite
- 17.69/100
- National rank
- #9024
- State rank
- #108 of 139 in TN
Livability — Columbia
- Score
- 63/100
- State rank
- #207
- US rank
- #16090
Category grades
Schools grade is shown separately in the Schools card above.
Census & demographics
- Census place
- Columbia, TN
- County
- Maury County · 121,382 people
- City population
- 67,482
- Metro
- Nashville-Davidson--Murfreesboro--Franklin, TN
- Population (ZIP)
- 67,482
- Household income
- $68,475
- Rent vs Own
- Severe rent burden
- 2026.0
Population outlook (Maury County) Hauer SSP2
- Today (2025)
- 102,894 people
- By 2030
- 110,269 · +7.2%
- By 2040
- 124,426 · +20.9%
- By 2050
- 137,543 · +33.7%
- By 2075
- 167,438 · +62.7%
- By 2100
- 184,489 · +79.3%
Race, ethnicity, and origin ACS 2023
- Neighborhood character
- Predominantly White (74%)
- Race & ethnicity
- White 74% Black 12% Hispanic / Latino 9% Two or more races 7%
- Hispanic origin (detail)
- Mexican 7%
- Common ancestry
- Slovak 1% Serbian 1% Romanian 1%
- Foreign-born
- 4% · Canada
- Languages at home
- 94% English-only · Spanish 5%
Political lean MEDSL · Maury
- 2024 margin
- Solid R (+44.6) · D 27.1% · R 71.8% · Other 1.1%
- 2008→2024 swing
- -6.2pp toward R · 2008: -38.4pp · 2024: -44.6pp
- All cycles
- 2024: R+44.6 2020: R+36.5 2016: R+39.2 2012: R+26.9 2008: R+38.4
Not yet ingested
- Civics
- —
Market trends
- HPI YoY
- ▼ -100.75%
- Current HPI
- 343.0362
- Rent YoY
- ▲ 4.97%
- Metro
- Nashville-Davidson--Murfreesboro--Franklin, TN
- State GDP YoY
- ▲ 2.78%
- F500 in state
- 22
Industry mix (Fortune 500 HQ in TN)
| Industry | F500 HQs | Revenue |
|---|---|---|
| Healthcare | 3 | $91B |
|
||
| Retail | 3 | $72B |
|
||
| Transportation / Logistics | 1 | $88B |
|
||
| Paper / Packaging | 1 | $19B |
|
||
| Insurance | 1 | $13B |
|
||
| Energy | 1 | $12B |
|
||
Price history
+1700.0% since first listed21 events — show timeline
- 2026-06-01 Price Changed $179,999 REALTRACS as Distributed by MLS Grid
- 2026-05-15 Listed $189,999 REALTRACS as Distributed by MLS Grid
- 2026-05-13 Sold (Public Records) $141,263 Public Records
- 2026-05-04 Sold (MLS) $141,263 REALTRACS as Distributed by MLS Grid
- 2026-03-24 Contingent — REALTRACS as Distributed by MLS Grid
- 2026-03-20 Price Changed $189,000 REALTRACS as Distributed by MLS Grid
- 2026-02-15 Listed $236,000 REALTRACS as Distributed by MLS Grid
- 2025-12-17 Listing Removed — REALTRACS as Distributed by MLS Grid
- 2025-12-17 Listing Removed — REALTRACS as Distributed by MLS Grid
- 2025-10-09 Relisted — REALTRACS as Distributed by MLS Grid
- 2025-10-07 Listed $230,000 REALTRACS as Distributed by MLS Grid
- 2025-10-01 Listing Removed — REALTRACS as Distributed by MLS Grid
- 2025-09-03 Relisted — REALTRACS as Distributed by MLS Grid
- 2025-08-19 Contingent — REALTRACS as Distributed by MLS Grid
- 2025-07-21 Price Changed $230,000 REALTRACS as Distributed by MLS Grid
- 2025-06-30 Listed $249,000 REALTRACS as Distributed by MLS Grid
- 2022-04-01 Sold (Public Records) $85,000 Public Records
- 2005-08-17 Sold (Public Records) $39,000 Public Records
- 2004-02-24 Sold (Public Records) $34,000 Public Records
- 2004-02-24 Sold (Public Records) $14,000 Public Records
- 2004-02-24 Sold (Public Records) $10,000 Public Records
Property tax history
+7.0%/yrLatest (2025): $806 · +0.0% YoY. Source: county tax records.
Cash-flow waterfall
monthlySold comps — $/sqft
last 12 mo · ≤1 miLoading sold comps…