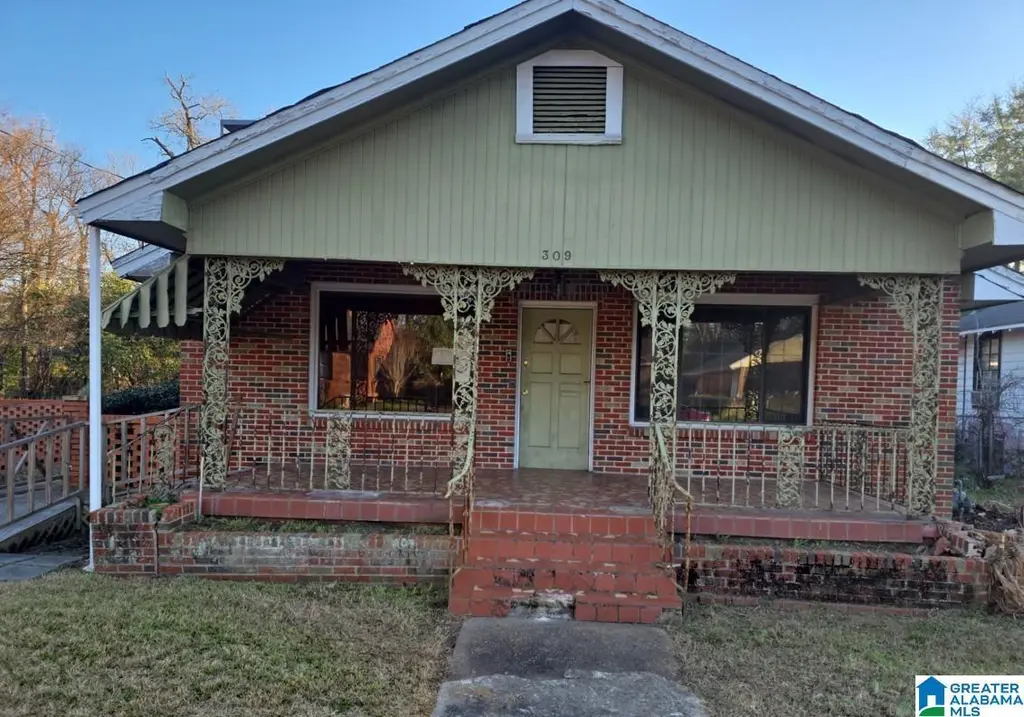
309 Wade St · Montgomery, AL
Flood risk 5/10 · Moderate
- FEMA flood zone
- AE
- Chance of flooding over 30 yrs
- 0.5%
- Est. flood insurance / yr
- $1,737 – $8,500
Fire risk 1/10 · Minimal
- Est. fire insurance / yr
- $916 – $1,700
Heat risk 7/10 · Major
- Hot days now (above 107°F)
- 7 days/yr
- Hot days in 30 yrs
- 20 days/yr
Wind risk 8/10 · Major
- Chance of severe wind over 30 yrs
- 80.0%
Air-quality risk 3/10 · Minor
- Unhealthy air days now
- 4 days/yr
- Unhealthy air days in 30 yrs
- 4 days/yr
Risk factors via First Street. Map © Google.
Why this score? — see what drove the B- grade
The composite is a weighted blend of 9 inputs, each scored 0–100. Each bar is that input's sub-score; the figure is the points it added to the 100-point composite (weight × sub-score).
- Cash flow +30.0/30.0
- 1% rule +10.0/10.0
- DSCR +10.0/10.0
- ARV discount +7.5/15.0
- Livability +3.2/5.0
- Rent growth +2.5/5.0
- Condition / age +2.5/5.0
- Schools +1.7/10.0
- Appreciation +0.0/10.0
$84,900
🖨 Deal sheet 📄 Offer letter ✓ Due diligence
Listing remarks MLS
Don't miss the beautiful Brick House on the block. With a little work, this one will be a great home for first time buyer or investor. Huge yard, bedrooms are large, hardwood floors in living and dining room. Please read Agent Notes for details on making offer!
Key facts
- Huge yard
- Brick house
- Hardwood floors
Tags
Neighborhood map
What this means for you Summary
Snapshot
- This is a 2-bed/1.0-bath single-family listed at $85k.
Deal economics
- At list price, monthly cash flow is $202 ($2k/yr) — positive.
- The deal already cash-flows at list — no discount required.
- Meets the 1% rule at list price ($2k rent vs $85k).
- Recommended offer: $77k (9.0% below list) — sets the bar for market timing.
- Cap rate 15.2% vs local median 6.0% in Montgomery — top-decile yield for the area; either an underpriced asset or a hidden risk that comps aren't pricing in. Stress-test before assuming the spread holds.
Location & tenants
- Location reads 65/100 on livability (#138 in AL) — a middle-class / working-renter tenant base. Strengths: cost of living A+, housing A+; Watch: schools C-, employment D, crime F.
- Montgomery County (urban): math 9% / reading 31% proficiency, ranked #106 of 129 in AL (top 82%) — low school quality limits family demand, transient renter base, plan for 1-2y turnover; 70% free/reduced lunch — lower-income household profile, screen leases tightly.
- Market conditions: 53 active listings in the ZIP; 13 comparable units currently listed for rent nearby; rentals at typical pace (median 21d on market — plan ~3-4 weeks tenant-placement turnaround); 46% of comp listings sitting > 30 days — soft ceiling on asking rent; lower-income renter base — watch delinquency; 460 units permitted in Montgomery County in 2024 (37 in 5+ unit buildings).
- At $1,505/mo this rent would consume 53% of the median local household income ($34k/yr) (locally 641% of renters already pay >50% of income on rent) — very limited rent-growth headroom before tenants either downsize or default.
Forward outlook
- Local home prices are declining (-3.0%/yr); year-one equity from $587 of loan paydown is wiped out by about $3k of value loss. Plan a longer hold.
- Montgomery County population projected to shrink 8% by 2050 — rents likely to lag national; underwrite the cash flow, not the appreciation.
Negotiation context
- It's been on market 108 days — a 9% lower offer ($77k) is reasonable based on typical stale-listing flexibility.
Risks & watch-outs
- Watch-outs: flood insurance adds $427/mo; built in 1940 — expect roof / HVAC / electrical / plumbing capex.
- Climate carrying-cost: in FEMA flood zone AE (mandatory federal flood insurance); severe wind risk, 80% chance of damaging wind over 30y; extreme-heat days projected 7→20/yr by 2055 (HVAC capex compounding) — expect insurance premiums to compound above CPI over the hold.
Questions for the listing agent
- It's been on market 108 days. Have you received any prior offers? Is the seller open to a 9% concession, seller financing, or rate buy-down credit?
- Built in 1940 — when were the roof, HVAC, electrical panel, plumbing, and water heater last replaced?
- What's the actual annual flood-insurance premium (NFIP or private), and is the property in a SFHA with mandatory coverage?
- Why hasn't it sold? Are there any deal-killer items the seller is aware of (foundation, flood, title, zoning, code violations)?
- Is there a deadline driving the sale (1031 exchange, divorce, estate, relocation)? That informs how much negotiation room exists.
- Crime grade is F in this area — have there been break-ins, vandalism, or insurance claims at this property in the last 3 years? What carrier currently insures it and at what premium?
- What's the average days-on-market for RENTAL listings here right now (not sales)? A rising rental-DOM trend means longer vacancies and softer asking-rent achievability than the comps imply.
- What's the recent tenant-quality profile in this submarket — average credit score on applications, eviction rate, late-payment / NSF rate, and stable-employment percentage? A property-management company in the area should have these aggregated.
- How much new for-sale + rental construction is in the pipeline within 1–3 miles? Heavy new supply typically softens prices + rents 12–24 months out; constrained supply supports both.
Investment metrics
- 1% rule
- 1.77% ✓
- Cap rate
- 15.18%
- Cash-on-cash
- 31.72%
- DSCR
- 2.41
- GRM
- 4.7
CMA / ARV
- ARV (median comp)
- $55,082
- List price
- $84,900
- Delta
- 54.14%
- Verdict
- OVERPRICED
- Comps
- 20 within 1.0 mi
Show comp detail 12 sales within ~0.75 mi
| Address | Dist | Beds/Ba | Sqft | Sold | Price | $/sf | Match |
|---|---|---|---|---|---|---|---|
| 1286 S Lawrence St | 0.46mi | 3/2.0 (+1) | 1,909 (-1%) | 3mo | $70,000 | $37 | 66 |
| 1555 S Court St | 0.35mi | 3/2.0 (+1) | 1,980 (+3%) | 11mo | $45,000 | $23 | 60 |
| 1208 S Lawrence St | 0.46mi | 3/2.0 (+1) | 1,901 (-1%) | 12mo | $120,000 | $63 | 58 |
| 1523 S Court St | 0.34mi | 3/2.0 (+1) | 2,002 (+4%) | 14mo | $145,000 | $72 | 57 |
| 840 Sayre St | 0.37mi | 3/2.0 (+1) | 1,976 (+3%) | 18mo | $70,000 | $35 | 54 |
| 21 W Jeff Davis Ave | 0.45mi | 3/1.0 (+1) | 1,706 (-11%) | 4mo | $10,000 | $6 | 52 |
| 338 Cloverdale Rd | 0.73mi | 2/2.0 | 1,920 (-0%) | 16mo | $135,000 | $70 | 49 |
| 154 W Hannon St | 0.23mi | 3/2.0 (+1) | 1,637 (-15%) | 9mo | $2,500 | $2 | 48 |
| 414 Maury St | 0.66mi | 3/2.5 (+1) | 2,026 (+5%) | 10mo | $124,900 | $62 | 41 |
| 936 S Lawrence St | 0.53mi | 3/1.0 (+1) | 1,710 (-11%) | 16mo | $20,000 | $12 | 38 |
| 346 Cloverdale Rd | 0.75mi | 3/2.0 (+1) | 1,944 (+1%) | 21mo | $229,000 | $118 | 37 |
| 814 S Hull St | 0.70mi | 3/1.0 (+1) | 1,704 (-11%) | 11mo | $25,000 | $15 | 34 |
Match score weights: distance 35% · size 25% · config 20% · recency 20%. Top-matched comps best support the ARV.
Projected returns pro-forma
-3.0% appreciation · 3.0% rent growth · sell at horizon
- IRR
- -0.7%
- Equity multiple
- 0.97×
- Total profit
- $-631
- Equity at exit
- $12,659
- IRR
- 9.2%
- Equity multiple
- 1.72×
- Total profit
- $17,098
- Equity at exit
- $7,341
Cash invested: $23,772 (down + closing). Projections, not guarantees.
Landlord ↔ Tenant lean methodology
- Overall (STATE)
- 90 Strongly Landlord-Friendly
- State Alabama
- 90 Strongly Landlord-Friendly · R+15
- County
- — inherits STATE
- City
- — inherits STATE
ZIP-level market 36104
- Active inventory
- 53
- Price-to-rent
- 4.7×
Monthly cashflow live
- Estimated rent
- $1,505 high interval (Pro) →
- Mortgage (P&I)
- −$445
- Tax from tax record
- −$80 /mo · $961/yr
- Insurance
- −$35
- Flood insurance flood zone
- −$427 /mo · $5,118/yr
- HOA
- −$0
- Vacancy / Maint / Mgmt
- −$316
- Net cashflow
- $202
Break-even live
UW: 25.0% down · 7.5% · 30yr · 1.5% tax · 5.0% vac · 8.0% maint · 8.0% mgmt
Financing live
Cash to close
- Down payment
- $21,225
- Closing costs
- $2,547
- Reserves months
- —
- Total cash needed
- —
Loan-product check · same deal, 3 products live
Conventional
25% down · 7.5% · 30yr
- Down + closing
- —
- Monthly P&I
- —
- Monthly cashflow
- —
- DSCR
- —
- Eligible?
- —
Personal DTI + credit; lowest rate.
DSCR
20% down · 8.5% · 30yr
- Down + closing
- —
- Monthly P&I
- —
- Monthly cashflow
- —
- DSCR
- —
- Eligible?
- —
No personal income docs; deal must DSCR.
Hard money
10% down · 12.0% · 12mo
- Down + closing
- —
- Monthly P&I
- —
- Monthly cashflow
- —
- DSCR
- —
- Eligible?
- —
Short-term bridge; refi at stabilization.
Rent comps 13 comps
| Address | Beds | Baths | Sqft | Rent | $/sqft | DOM | Units | Dist |
|---|---|---|---|---|---|---|---|---|
| 1314 S Court St Montgomery, AL | 2.0 | 2.0 | 1650 | $1,495 | $0.91 | 13d | 1 | 0.30mi |
| 1020 S Lawrence St Montgomery, AL | 2.0 | 1.0 | 1711 | $2,000 | $1.17 | 13d | 1 | 0.49mi |
| 1259 S Lawrence St Montgomery, AL | 3.0 | 1.0 | 1728 | $1,300 | $0.75 | 44d | 1 | 0.51mi |
| 334 Felder Ave Montgomery, AL | 3.0 | 2.0 | 2223 | $2,395 | $1.08 | 44d | 1 | 0.77mi |
| 428 Thorn Pl Montgomery, AL | 2.0 | 1.0 | 1549 | $1,450 | $0.94 | 44d | 1 | 1.02mi |
| 519 Thorn Pl Montgomery, AL | 2.0 | 1.0 | 1632 | $650 | $0.40 | 21d | 1 | 1.05mi |
| 3338 S Hull St Montgomery, AL | 2.0 | 2.0 | 1311 | $1,150 | $0.88 | 21d | 1 | 1.22mi |
| 3235 Norman Bridge Rd Montgomery, AL | 3.0 | 1.0 | 1873 | $900 | $0.48 | 44d | 1 | 1.25mi |
| 3225 McElvy St Montgomery, AL | 3.0 | 2.0 | 1258 | $1,350 | $1.07 | 13d | 1 | 1.35mi |
| 3256 Montezuma Rd Montgomery, AL | 3.0 | 2.0 | 1515 | $1,450 | $0.96 | 44d | 1 | 1.41mi |
| 3386 Lexington Rd Unit B Montgomery, AL | 2.0 | 1.0 | 1950 | $900 | $0.46 | 21d | 1 | 1.42mi |
| 3577 Whiting Ave Montgomery, AL | 3.0 | 1.0 | 1269 | $1,150 | $0.91 | 44d | 1 | 1.43mi |
| 2727 Boultier St Montgomery, AL | 1.0–3.0 | 1.0–2.0 | 1070 | $1,508 | $1.41 | 13d | 3 | 1.50mi |
Listing history 16 events
-
2026-06-18days on market $84,900 Active 108 DOM
-
2026-06-17days on market $84,900 Active 107 DOM
-
2026-06-16days on market $84,900 Active 106 DOM
-
2026-06-15days on market $84,900 Active 105 DOM
-
2026-06-14days on market $84,900 Active 103 DOM
-
2026-06-13days on market $84,900 Active 102 DOM
-
2026-06-10days on market $84,900 Active 100 DOM
-
2026-06-09days on market $84,900 Active 99 DOM
-
2026-06-08days on market $84,900 Active 98 DOM
-
2026-06-07days on market $84,900 Active 97 DOM
-
2026-06-03days on market $84,900 Active 93 DOM
-
2026-06-02days on market $84,900 Active 92 DOM
-
2026-06-01days on market $84,900 Active 91 DOM
-
2026-05-31days on market $84,900 Active 90 DOM
-
2026-05-30days on market $84,900 Active 89 DOM
-
2026-03-02$94,900 Active 261-char remark
Show marketing remark (261 chars)
Don't miss the beautiful Brick House on the block. With a little work, this one will be a great home for first time buyer or investor. Huge yard, bedrooms are large, hardwood floors in living and dining room. Please read Agent Notes for details on making offer!
ⓘ Source: listings_history table (triggers on properties + properties_extension) + one-shot
backfill from property_details.listing_events for pre-trigger history.
Tax reassessment forecast AL · Resets to sale price
- Current annual tax
- $961 · $80/mo
- Projected year-2 tax
- $961 · $80/mo
- Expected delta
- $0/yr ($0/mo · 0.0%)
ⓘ Screening estimate from a state-policy table — verify with the county assessor before closing.
Climate risk First Street
- Flood 5/10 Major FEMA zone AE · 50% chance over 30 yrs
- Wildfire 1/10 Low
- Heat 7/10 Severe 7 d/yr ≥107°F today · 20 d/yr by 30 yrs out
- Wind 8/10 Severe 80% chance of damaging wind over 30 yrs
- Air quality 3/10 Moderate 4 unhealthy d/yr today · 4 by 30 yrs out
Nearby sold comps map
Loading sold comps map…
Walkable amenities ~0.75 mi
Loading nearby amenities…
Taxation est. · year 1
- Rental income
- $18,063
- − Mortgage interest
- −$4,756
- − Property taxes
- −$961
- − Insurance
- −$5,543
- − Repairs & maintenance
- −$1,445
- − Management
- −$1,445
- − Depreciation
- −$2,470
- Taxable income
- $1,443
- Est. tax owed @ 24.0%
- −$346
- After-tax cash flow
- $2,076/yr
For passive investors: Depreciation is non-cash, so a rental often shows a tax loss while cash-flowing — sheltering income. Rental losses are passive: they offset passive income freely, and up to $25,000/yr can offset ordinary (W-2) income if you actively participate and your MAGI is under $100k (phasing out to $0 by $150k); unused losses carry forward. On sale, claimed depreciation is recaptured at up to 25%, and gains may owe capital-gains tax (a 1031 exchange can defer both). Figures are a year-1 estimate at your 24.0% rate — not tax advice; consult a CPA.
Schools (NCES district)
- District
- Montgomery County
- NCES district ID
- 0102430
- Math proficiency
- 9% ▼ -21.00%
- Reading proficiency
- 31% ▼ -1.00%
- Median HH income
- $43,902
- Composite
- 17.24/100
- National rank
- #9093
- State rank
- #106 of 129 in AL
Livability — Montgomery
- Score
- 65/100
- State rank
- #138
- US rank
- #13416
Category grades
Schools grade is shown separately in the Schools card above.
Census & demographics
- Census place
- Montgomery, AL
- County
- Montgomery County · 190,016 people
- City population
- 175,913
- Metro
- Montgomery, AL
- Population (ZIP)
- 10,535
- Household income
- $33,823
- Rent vs Own
- Severe rent burden
- 641.0
Population outlook (Montgomery County) Hauer SSP2
- Today (2025)
- 224,008 people
- By 2030
- 221,460 · -1.1%
- By 2040
- 214,179 · -4.4%
- By 2050
- 204,912 · -8.5%
- By 2075
- 177,821 · -20.6%
- By 2100
- 145,134 · -35.2%
Race, ethnicity, and origin ACS 2023
- Neighborhood character
- Predominantly Black (72%)
- Race & ethnicity
- Black 72% White 20% Two or more races 6% Hispanic / Latino 2%
- Common ancestry
- Swedish 2% Russian 1% Lithuanian 1%
- Foreign-born
- 2% · Canada
- Languages at home
- 97% English-only · Spanish 1% Other Indo-European 1%
Political lean MEDSL · Montgomery
- 2024 margin
- Solid D (+30.7) · D 64.8% · R 34.1% · Other 1.1%
- 2008→2024 swing
- +11.5pp toward D · 2008: 19.2pp · 2024: 30.7pp
- All cycles
- 2024: D+30.7 2020: D+31.5 2016: D+26.2 2012: D+24.3 2008: D+19.2
Not yet ingested
- Civics
- —
Market trends
- HPI YoY
- ▼ -101.13%
- Current HPI
- 27.2384
- Rent YoY
- —
- Metro
- Montgomery, AL
- State GDP YoY
- ▲ 2.94%
- F500 in state
- 4
Industry mix (Fortune 500 HQ in AL)
| Industry | F500 HQs | Revenue |
|---|---|---|
| Financial Services | 1 | $8B |
|
||
| Healthcare | 1 | $5B |
|
||
Price history
1 event — show timeline
- 2026-03-02 Listed $94,900 Greater Alabama MLS
Property tax history
+14.9%/yrLatest (2025): $961 · +359.9% YoY. Source: county tax records.
Cash-flow waterfall
monthlySold comps — $/sqft
last 12 mo · ≤1 miLoading sold comps…