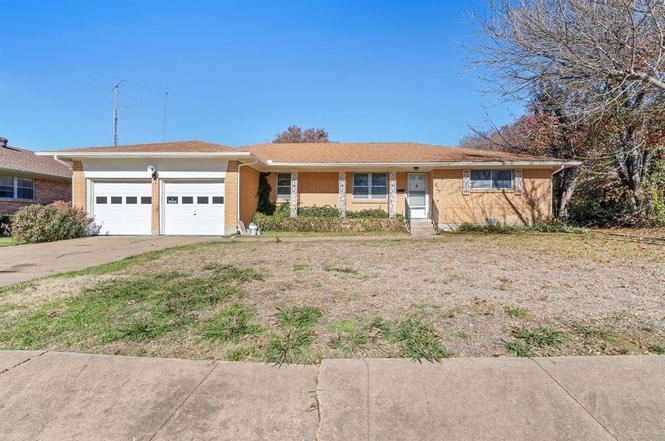
927 Poinsettia Dr · Lancaster, TX
Flood risk 1/10 · Minimal
- FEMA flood zone
- X (unshaded)
- Chance of flooding over 30 yrs
- 0.0%
- Est. flood insurance / yr
- $507 – $1,088
Fire risk 3/10 · Minor
- Est. fire insurance / yr
- $1,222 – $2,270
Heat risk 7/10 · Major
- Hot days now (above 110°F)
- 7 days/yr
- Hot days in 30 yrs
- 24 days/yr
Wind risk 6/10 · Moderate
- Chance of severe wind over 30 yrs
- 27.0%
Air-quality risk 2/10 · Minimal
- Unhealthy air days now
- 2 days/yr
- Unhealthy air days in 30 yrs
- 2 days/yr
Risk factors via First Street. Map © Google.
Why this score? — see what drove the D grade
The composite is a weighted blend of 9 inputs, each scored 0–100. Each bar is that input's sub-score; the figure is the points it added to the 100-point composite (weight × sub-score).
- ARV discount +10.9/15.0
- Cash flow +9.1/30.0
- Appreciation +6.8/10.0
- 1% rule +3.6/10.0
- Rent growth +3.2/5.0
- Livability +3.1/5.0
- DSCR +2.5/10.0
- Condition / age +2.5/5.0
- Schools +2.1/10.0
$266,000
🖨 Deal sheet (PDF) 📄 Offer letter ✓ Due diligence
Listing remarks MLS
Great 3 bedroom with two living areas. The street side has formal living and dining. Backyard side has family room. Extra large lot. The 2 car garage is attached plus a second garage and shed in the backyard.
Key facts
- 0.27 acre lot
- 2 garage spots
- Built 1962
Property features AI
Finance
- Other: County: Dallas; Country: United States
- HOA & community: No homeowners association
Exterior
- Parking: Attached garage; Covered parking for 2 vehicles; 2-car garage (about 18' x 18')
- Utilities: City water; City sewer; Not in a municipal utility district
- Home design: Single Family Residence; Residential property; One story; Built in 1962
- Construction: Preowned construction (built 1962)
- Exterior features: Lot under 0.5 acre (about 0.266 acre); Subdivision: Indian Canyon; GPS-friendly directions
Interior
- Kitchen: Dishwasher; Disposal; Electric cooktop; Electric oven
- Bedrooms: Primary bedroom on main level (12 x 12); Total of 3 bedrooms
- Bathrooms: 2 full bathrooms
- Interior features: One-level layout; Wood-burning fireplace; Living area approximately 1766; Separate living and dining areas; Other interior features
Neighborhood map
What this means for you Summary
Snapshot
- This is a 3-bed/2.0-bath single-family listed at $266k.
Deal economics
- At list price, monthly cash flow is $-204 ($-2k/yr) — negative.
- To cash-flow at today's rent, offer at most $230k (13.6% below list).
- To meet the 1% rule (rent ≥ 1% of price), the offer needs to be $228k (14.2% below list).
- Recommended offer: $228k (14.2% below list) — sets the bar for 1% rule.
Location & tenants
- Location reads 62/100 on livability (#926 in TX) — a middle-class / working-renter tenant base. Strengths: cost of living A+, housing A+; Watch: employment C-, crime F, amenities F.
- Lancaster ISD (suburban): math 19% / reading 29% proficiency, ranked #714 of 826 in TX (top 86%) — low school quality limits family demand, transient renter base, plan for 1-2y turnover; 78% free/reduced lunch — lower-income household profile, screen leases tightly.
- Zoned schools: West Main El (math 19% / reading 28%, grade F, #3,247 of 4,322 statewide, top 76%, 603 students, 85% FRL).
- Market conditions: Rents rising (+3.0%/yr); 103 active listings in the ZIP; 36 comparable units currently listed for rent nearby; rentals at typical pace (median 22d on market — plan ~3-4 weeks tenant-placement turnaround); 12,577 units permitted in Dallas County in 2024 (6,829 in 5+ unit buildings).
- This rent runs 40% of the median local income ($68k/yr) — at the standard rent-burdened threshold; future hikes will face affordability resistance.
Forward outlook
- In year one you build about $11k of equity ($2k loan paydown + $10k appreciation (3.6% local appreciation)).
- Dallas County population projected at +35% by 2050 — long-run rental-demand tailwind backs the buy-and-hold thesis.
- By year 4, paydown + projected appreciation supports a ~$38k cash-out refi (75% LTV) — recoverable capital for the next deal without selling this one.
Negotiation context
- Only 3 days on market — expect competitive offers; lowballing is unlikely to land.
- 5 sale attempts since 9y ago with the ask held roughly flat each time — persistent listings suggest the price (not the market) is what's stuck; bring a comps-based counter.
Risks & watch-outs
- Climate carrying-cost: major wind risk, 27% chance of damaging wind over 30y; extreme-heat days projected 7→24/yr by 2055 (HVAC capex compounding) — expect insurance premiums to compound above CPI over the hold.
Questions for the listing agent
- What do current leases actually rent for vs. the listed asking? Can we see a recent rent roll and the last 12 months of T-12 income?
- Built in 1962 — when were the roof, HVAC, electrical panel, plumbing, and water heater last replaced?
- Is there a deadline driving the sale (1031 exchange, divorce, estate, relocation)? That informs how much negotiation room exists.
- Schools are D-rated, which usually means shorter tenancies and higher turnover. Who's the typical renter profile here, and what's been the actual vacancy rate?
- Crime grade is F in this area — have there been break-ins, vandalism, or insurance claims at this property in the last 3 years? What carrier currently insures it and at what premium?
- The area grade is low — what's the realistic commute time and amenity access for the typical tenant pool here? Any planned neighborhood developments (good or bad) we should know about?
- What's the average days-on-market for RENTAL listings here right now (not sales)? A rising rental-DOM trend means longer vacancies and softer asking-rent achievability than the comps imply.
- What's the recent tenant-quality profile in this submarket — average credit score on applications, eviction rate, late-payment / NSF rate, and stable-employment percentage? A property-management company in the area should have these aggregated.
- How much new for-sale + rental construction is in the pipeline within 1–3 miles? Heavy new supply typically softens prices + rents 12–24 months out; constrained supply supports both.
Investment metrics
- 1% rule
- 0.86% ✗
- Cap rate
- 5.37%
- Cash-on-cash
- -3.29%
- DSCR
- 0.85
- GRM
- 9.7
CMA / ARV
- ARV (on-the-fly)
- $287,858
- Comps found
- 12
Show comp detail 12 sales within ~0.75 mi
| Address | Dist | Beds/Ba | Sqft | Sold | Price | $/sf | Match |
|---|---|---|---|---|---|---|---|
| 814 Oakbluff Dr | 0.17mi | 3/2.0 | 1,839 (+4%) | 4mo | $208,250 | $113 | 82 |
| 830 Bordner Dr | 0.15mi | 3/2.0 | 1,821 (+3%) | 8mo | $350,000 | $192 | 81 |
| 933 Waynelee Dr | 0.08mi | 3/2.5 | 1,992 (+13%) | 3mo | $340,000 | $171 | 70 |
| 500 Glenwood Dr | 0.49mi | 3/2.0 | 1,718 (-3%) | 6mo | $279,700 | $163 | 68 |
| 204 Trinity Dr | 0.42mi | 3/2.0 | 1,873 (+6%) | 4mo | $289,000 | $154 | 67 |
| 882 Magnolia Ln | 0.41mi | 3/2.5 | 1,676 (-5%) | 5mo | $247,000 | $147 | 66 |
| 876 Dogwood Trl | 0.35mi | 3/2.0 | 1,578 (-11%) | 2mo | $264,900 | $168 | 65 |
| 1129 Harvest Hill Ln | 0.55mi | 3/2.0 | 1,598 (-10%) | 1mo | $275,000 | $172 | 58 |
| 1106 Rosewood Ln | 0.42mi | 3/2.0 | 1,537 (-13%) | 5mo | $239,900 | $156 | 54 |
| 702 Rea Ave | 0.46mi | 3/2.0 | 1,533 (-13%) | 5mo | $175,000 | $114 | 52 |
| 208 Mimosa Ln | 0.57mi | 3/2.0 | 2,015 (+14%) | 5mo | $325,000 | $161 | 45 |
| 1313 Oakbluff Dr | 0.64mi | 3/2.0 | 1,530 (-13%) | 4mo | $249,900 | $163 | 44 |
Match score weights: distance 35% · size 25% · config 20% · recency 20%. Top-matched comps best support the ARV.
Projected returns pro-forma
3.57% appreciation · 2.96% rent growth · sell at horizon
- IRR
- 6.2%
- Equity multiple
- 1.37×
- Total profit
- $27,252
- Equity at exit
- $128,306
- IRR
- 8.8%
- Equity multiple
- 2.42×
- Total profit
- $105,474
- Equity at exit
- $204,784
Cash invested: $74,480 (down + closing). Projections, not guarantees.
Landlord ↔ Tenant lean methodology
- Overall (STATE)
- 87 Strongly Landlord-Friendly
- State Texas
- 87 Strongly Landlord-Friendly · R+5
- County
- — inherits STATE
- City
- — inherits STATE
ZIP-level market 75146
- Home prices YoY
- 1.1%
- Rents YoY
- 3.0%
- Active inventory
- 103
- Price-to-rent
- 9.7×
Monthly cashflow live
- Estimated rent
- $2,282 high interval (Pro) →
- Mortgage (P&I)
- −$1,395
- Tax from tax record
- −$501 /mo · $6,013/yr
- Insurance
- −$111
- HOA
- −$0
- Vacancy / Maint / Mgmt
- −$479
- Net cashflow
- $-204
Break-even live
Sensitivity live
| Price | -10% $-54 | -5% $-129 | +0% $-204 | +5% $-280 | +10% $-355 |
|---|---|---|---|---|---|
| Rent | -10% $-385 | -5% $-294 | +0% $-204 | +5% $-114 | +10% $-24 |
| Rate | -1.0pp $-70 | -0.5pp $-137 | base $-204 | +0.5pp $-273 | +1.0pp $-343 |
UW: 25.0% down · 7.5% · 30yr · 1.5% tax · 5.0% vac · 8.0% maint · 8.0% mgmt
Financing live
Cash to close
- Down payment
- $66,500
- Closing costs
- $7,980
- Reserves months
- —
- Total cash needed
- —
Loan-product check · same deal, 3 products live
Conventional
25% down · 7.5% · 30yr
- Down + closing
- —
- Monthly P&I
- —
- Monthly cashflow
- —
- DSCR
- —
- Eligible?
- —
Personal DTI + credit; lowest rate.
DSCR
20% down · 8.5% · 30yr
- Down + closing
- —
- Monthly P&I
- —
- Monthly cashflow
- —
- DSCR
- —
- Eligible?
- —
No personal income docs; deal must DSCR.
Hard money
10% down · 12.0% · 12mo
- Down + closing
- —
- Monthly P&I
- —
- Monthly cashflow
- —
- DSCR
- —
- Eligible?
- —
Short-term bridge; refi at stabilization.
Rent comps 36 comps
| Address | Beds | Baths | Sqft | Rent | $/sqft | DOM | Units | Dist |
|---|---|---|---|---|---|---|---|---|
| 422 Ash Ln Lancaster, TX | 3.0 | 2.0 | 1651 | $1,995 | $1.21 | 25d | 1 | 0.13mi |
| 830 Bordner Dr Lancaster, TX | 3.0 | 2.0 | 1821 | $2,300 | $1.26 | 13d | 1 | 0.14mi |
| 1215 Jessie Ln Lancaster, TX | 4.0 | 2.5 | 2279 | $2,296 | $1.01 | 13d | 1 | 0.26mi |
| 1218 Jewell Ln Lancaster, TX | 4.0 | 2.0 | 1854 | $2,071 | $1.12 | 8d | 1 | 0.26mi |
| 610 Canvas Ct Lancaster, TX | 4.0 | 2.0 | 1859 | $2,276 | $1.22 | 8d | 1 | 0.33mi |
| 610 Canvas Ct Lancaster, TX | 4.0 | 2.0 | 1859 | $2,210 | $1.19 | 2d | 1 | 0.33mi |
| 900 Diann Cir Lancaster, TX | 3.0 | 2.0 | 2247 | $2,455 | $1.09 | 2d | 1 | 0.45mi |
| 1125 Greenbriar Ln Lancaster, TX | 3.0 | 2.0 | 1744 | $1,825 | $1.05 | 8d | 1 | 0.48mi |
| 1109 Harvest Hill Ln Lancaster, TX | 3.0 | 2.5 | 2006 | $2,350 | $1.17 | 8d | 1 | 0.51mi |
| 1225 Oakbluff Dr Lancaster, TX | 3.0 | 2.0 | 1335 | $1,895 | $1.42 | 4d | 1 | 0.55mi |
| 1308 Devine Dr Lancaster, TX | 4.0 | 2.0 | 1568 | $2,350 | $1.50 | 44d | 1 | 0.57mi |
| 1217 Meadow Creek Dr Lancaster, TX | 3.0 | 2.0 | 2088 | $1,971 | $0.94 | 13d | 1 | 0.67mi |
| 1217 Meadow Creek Dr Lancaster, TX | 3.0 | 2.0 | 2088 | $1,905 | $0.91 | 8d | 1 | 0.67mi |
| 1326 Johns Ave Lancaster, TX | 4.0 | 2.0 | 1236 | $2,100 | $1.70 | 44d | 1 | 0.70mi |
| 1450 Waldrop Dr Lancaster, TX | 4.0 | 2.0 | 1946 | $2,291 | $1.18 | 44d | 1 | 0.82mi |
| 1450 Waldrop Dr Lancaster, TX | 4.0 | 2.0 | 1946 | $2,105 | $1.08 | 21d | 1 | 0.82mi |
| 1373 Oakbluff Dr Lancaster, TX | 3.0 | 2.0 | 1289 | $1,850 | $1.44 | 3d | 1 | 0.83mi |
| 509 Arbor Ln Lancaster, TX | 3.0 | 2.0 | 1494 | $1,875 | $1.26 | 44d | 1 | 0.87mi |
| 721 Lindenwood Dr Lancaster, TX | 3.0 | 2.0 | 1606 | $1,895 | $1.18 | 16d | 1 | 0.92mi |
| 721 Lindenwood Dr Lancaster, TX | 3.0 | 2.0 | 1606 | $1,895 | $1.18 | 8d | 1 | 0.92mi |
| 120 E Park Place Dr Lancaster, TX | 4.0 | 1.0 | 1536 | $1,900 | $1.24 | 25d | 1 | 1.06mi |
| 300 E Main St Lancaster, TX | 2.0 | 1.0 | 1240 | $1,595 | $1.29 | 25d | 1 | 1.11mi |
| 1533 Prescott Dr Lancaster, TX | 3.0 | 2.0 | 1500 | $1,975 | $1.32 | 5d | 1 | 1.11mi |
| 1532 Linda Ln Lancaster, TX | 3.0 | 2.0 | 1380 | $2,000 | $1.45 | 25d | 1 | 1.15mi |
| 633 Rutgers Dr Lancaster, TX | 4.0 | 2.0 | 2065 | $1,995 | $0.97 | 5d | 1 | 1.25mi |
| 633 Rutgers Dr Lancaster, TX | 4.0 | 2.0 | 2065 | $1,995 | $0.97 | 11d | 1 | 1.25mi |
| 1910 Jasmine Dr Lancaster, TX | 3.0 | 2.5 | 2183 | $2,480 | $1.14 | 25d | 1 | 1.25mi |
| 1934 Mosley Dr Lancaster, TX | 4.0 | 2.0 | 1754 | $2,099 | $1.20 | 25d | 1 | 1.27mi |
| 711 Lentisco Dr Lancaster, TX | 4.0 | 2.0 | 2425 | $2,249 | $0.93 | 44d | 1 | 1.32mi |
| 1623 Venus Dr E Lancaster, TX | 3.0 | 2.5 | 2339 | $2,345 | $1.00 | 13d | 1 | 1.33mi |
| 2617 Arcady Cir Lancaster, TX | 3.0 | 2.0 | 1361 | $1,950 | $1.43 | 21d | 1 | 1.36mi |
| 2617 Arcady Cir Lancaster, TX | 3.0 | 2.0 | 1361 | $1,950 | $1.43 | 44d | 1 | 1.36mi |
| 1811 Kings Cross Dr Lancaster, TX | 4.0 | 2.0 | 1812 | $2,200 | $1.21 | 25d | 1 | 1.41mi |
| 1424 Chapman Dr Lancaster, TX | 3.0 | 2.0 | 1820 | $2,099 | $1.15 | 25d | 1 | 1.42mi |
| 1555 Willowbrook St Lancaster, TX | 3.0 | 2.0 | 1544 | $1,759 | $1.14 | 22d | 1 | 1.42mi |
| 2654 Hartford Ln Lancaster, TX | 4.0 | 2.0 | 1657 | $2,015 | $1.22 | 44d | 1 | 1.45mi |
Listing history 3 events
-
2026-06-18days on market $266,000 Active 3 DOM
-
2026-06-17days on market $266,000 Active 2 DOM
-
2026-06-15$266,000 Active 1 DOM
ⓘ Source: listings_history table (triggers on properties + properties_extension) + one-shot
backfill from property_details.listing_events for pre-trigger history.
Tax reassessment forecast TX · Resets to sale price
- Current annual tax
- $6,013 · $501/mo
- Projected year-2 tax
- $6,013 · $501/mo
- Expected delta
- $0/yr ($0/mo · 0.0%)
ⓘ Screening estimate from a state-policy table — verify with the county assessor before closing.
Climate risk First Street
- Flood 1/10 Low FEMA zone X (unshaded) · 0% chance over 30 yrs
- Wildfire 3/10 Moderate
- Heat 7/10 Severe 7 d/yr ≥110°F today · 24 d/yr by 30 yrs out
- Wind 6/10 Major 27% chance of damaging wind over 30 yrs
- Air quality 2/10 Low 2 unhealthy d/yr today · 2 by 30 yrs out
Nearby sold comps map
Loading sold comps map…
Walkable amenities ~0.75 mi
Loading nearby amenities…
Taxation est. · year 1
- Rental income
- $27,379
- − Mortgage interest
- −$14,900
- − Property taxes
- −$6,013
- − Insurance
- −$1,330
- − Repairs & maintenance
- −$2,190
- − Management
- −$2,190
- − Depreciation
- −$7,738
- Taxable loss
- −$6,983
- Est. tax savings @ 24.0%
- +$1,676
- After-tax cash flow
- $-777/yr
For passive investors: Depreciation is non-cash, so a rental often shows a tax loss while cash-flowing — sheltering income. Rental losses are passive: they offset passive income freely, and up to $25,000/yr can offset ordinary (W-2) income if you actively participate and your MAGI is under $100k (phasing out to $0 by $150k); unused losses carry forward. On sale, claimed depreciation is recaptured at up to 25%, and gains may owe capital-gains tax (a 1031 exchange can defer both). Figures are a year-1 estimate at your 24.0% rate — not tax advice; consult a CPA.
Schools (NCES district)
- District
- Lancaster ISD
- NCES district ID
- 4826670
- Math proficiency
- 19% ▼ -29.00%
- Reading proficiency
- 29% ▼ -11.00%
- Median HH income
- $52,275
- Composite
- 21.41/100
- National rank
- #8349
- State rank
- #714 of 826 in TX
Livability — Lancaster
- Score
- 62/100
- State rank
- #926
- US rank
- #16461
Category grades
Schools grade is shown separately in the Schools card above.
Census & demographics
- Census place
- Lancaster, TX
- County
- Dallas County · 2,612,404 people
- City population
- 44,142
- Metro
- Dallas-Fort Worth-Arlington, TX
- Population (ZIP)
- 25,097
- Household income
- $68,071
- Rent vs Own
- Severe rent burden
- 1462.0
Population outlook (Dallas County) Hauer SSP2
- Today (2025)
- 2,979,839 people
- By 2030
- 3,191,823 · +7.1%
- By 2040
- 3,619,611 · +21.5%
- By 2050
- 4,026,915 · +35.1%
- By 2075
- 4,957,073 · +66.4%
- By 2100
- 5,508,725 · +84.9%
Race, ethnicity, and origin ACS 2023
- Neighborhood character
- Diverse neighborhood (Simpson 0.57)
- Race & ethnicity
- Black 60% Hispanic / Latino 26% Two or more races 12% White 11%
- Hispanic origin (detail)
- Mexican 20% Puerto Rican 2%
- Common ancestry
- Italian 2%
- Foreign-born
- 7% · Canada
- Languages at home
- 80% English-only · Spanish 20%
Political lean MEDSL · Dallas
- 2024 margin
- Strong D (+22.2) · D 60.2% · R 38.0% · Other 1.8%
- 2008→2024 swing
- +6.9pp toward D · 2008: 15.3pp · 2024: 22.2pp
- All cycles
- 2024: D+22.2 2020: D+31.6 2016: D+26.2 2012: D+15.4 2008: D+15.3
Not yet ingested
- Civics
- —
Market trends
- HPI YoY
- ▲ 3.57%
- Current HPI
- 316.7295
- Rent YoY
- ▲ 2.96%
- Metro
- Dallas-Fort Worth-Arlington, TX
- State GDP YoY
- ▲ 3.95%
- F500 in state
- 110
Industry mix (Fortune 500 HQ in TX)
| Industry | F500 HQs | Revenue |
|---|---|---|
| Energy | 16 | $1,198B |
|
||
| Technology | 5 | $198B |
|
||
| Engineering / Construction | 4 | $72B |
|
||
| Energy Services | 3 | $60B |
|
||
| Utilities | 3 | $41B |
|
||
| Healthcare | 2 | $330B |
|
||
Price history
+114.5% since first listed16 events — show timeline
- 2026-06-15 Listed $266,000 NTREIS
- 2024-03-28 Sold (Public Records) — Public Records
- 2024-03-26 Sold (MLS) — NTREIS
- 2024-03-21 Pending — NTREIS
- 2024-02-16 Price Changed $259,000 NTREIS
- 2024-01-30 Price Changed $269,000 NTREIS
- 2024-01-18 Price Changed $275,000 NTREIS
- 2023-12-19 Listed $279,000 NTREIS
- 2023-09-20 Relisted — NTREIS
- 2023-09-06 Price Changed $219,000 NTREIS
- 2023-08-16 Listed $259,000 NTREIS
- 2017-08-03 Sold (Public Records) — Public Records
- 2017-08-01 Sold (MLS) — NTREIS
- 2017-07-13 Pending — NTREIS
- 2017-07-02 Contingent — NTREIS
- 2017-06-24 Listed $124,000 NTREIS
Property tax history
+5.3%/yrLatest (2025): $6,013 · -5.6% YoY. Source: county tax records.
Cash-flow waterfall
monthlySold comps — $/sqft
last 12 mo · ≤1 miLoading sold comps…