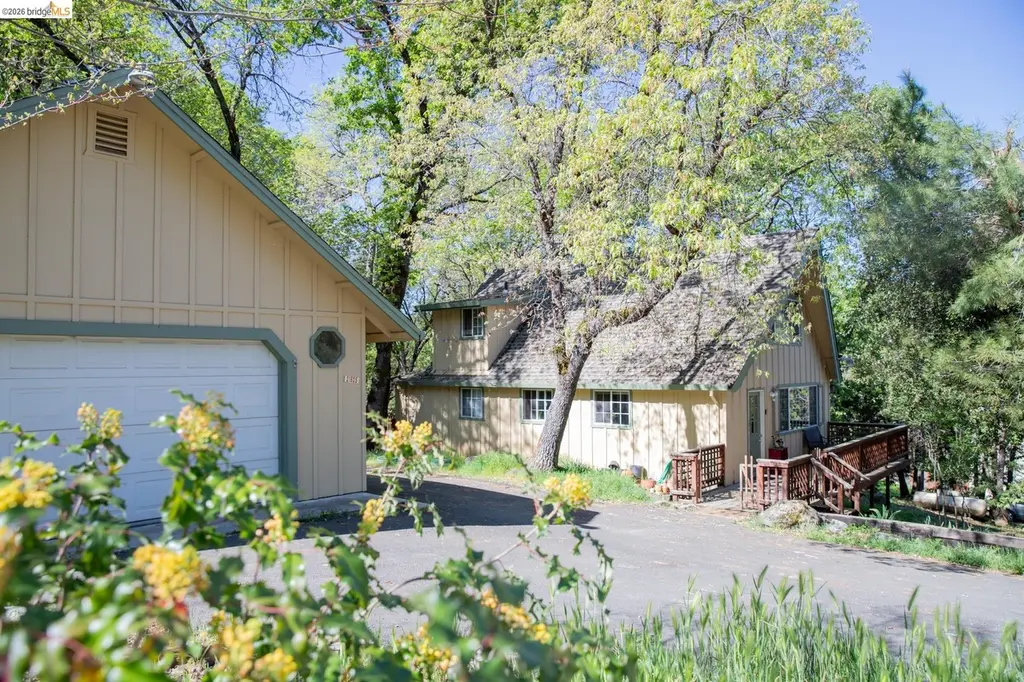
21625 Crystal Lake Dr · Mono Vista, CA
Flood risk 1/10 · Minimal
- FEMA flood zone
- X (unshaded)
- Chance of flooding over 30 yrs
- 0.0%
- Est. flood insurance / yr
- $507 – $1,088
Fire risk 8/10 · Major
- Est. fire insurance / yr
- $659 – $1,223
Heat risk 4/10 · Minor
- Hot days now (above 96°F)
- 7 days/yr
- Hot days in 30 yrs
- 17 days/yr
Wind risk 1/10 · Minimal
- Chance of severe wind over 30 yrs
- —
Air-quality risk 10/10 · Severe
- Unhealthy air days now
- 29 days/yr
- Unhealthy air days in 30 yrs
- 33 days/yr
Risk factors via First Street. Map © Google.
Why this score? — see what drove the C grade
The composite is a weighted blend of 9 inputs, each scored 0–100. Each bar is that input's sub-score; the figure is the points it added to the 100-point composite (weight × sub-score).
- Cash flow +22.3/30.0
- ARV discount +12.1/15.0
- DSCR +7.1/10.0
- 1% rule +5.1/10.0
- Schools +3.1/10.0
- Livability +2.8/5.0
- Rent growth +2.5/5.0
- Condition / age +2.5/5.0
- Appreciation +0.0/10.0
$285,000
🖨 Deal sheet 📄 Offer letter ✓ Due diligence
Listing remarks
Located in Lower Crystal Falls, this charming 2 bedroom, 2 bathroom home offers 1,266 sq ft of comfortable mountain living. Featuring warm wood ceilings, exposed beams, and a cozy wood burning fireplace, the open living space creates the perfect cabin feel. One mini split is installed upstairs. Enjoy a spacious deck surrounded by trees, ideal for relaxing or entertaining. The property also includes a detached garage with ample storage space above. Crystal Falls Ranch amenities include lake, clubhouse, gym, basketball and tennis-pickleball courts, stables, garden, and more. Conveniently located near Pinecrest Lake, Dodge Ridge Ski Resort, and Yosemite National Park, making it a great full ti
Key facts
- Wood ceilings
- Spacious deck
- Exposed beams
Tags
Property features AI
Finance
- HOA & community: Part of Crystal Falls Homeowners Association; Quarterly HOA fee; Community clubhouse, fitness center, and tennis courts; HOA fee covers reserves, management fee, and grounds maintenance
Exterior
- Parking: Detached covered garage (1 space)
- Utilities: Septic tank; Internet available
- Home design: Single family residence; Residential property; Built in 1972
- Construction: Wood construction; Shingle roof; Built in 1972
- Exterior features: Deck; Rear porch; Side yard
Interior
- Kitchen: Breakfast bar; Tile counters; Dishwasher; Electric range / cooktop
- Bedrooms: 1 bedroom on street level
- Flooring: Vinyl; Carpet
- Bathrooms: 2 full bathrooms
- Heating & cooling: Propane heating; Has heating
- Interior features: Breakfast bar; Wood-burning fireplace; Main entry; Loft; Living room
- Laundry & utility: Laundry room with hookups
Neighborhood map
What this means for you Summary
Snapshot
- This is a 2-bed/2.0-bath single-family listed at $285k.
Deal economics
- At list price, monthly cash flow is $470 ($6k/yr) — positive.
- The deal already cash-flows at list — no discount required.
- Meets the 1% rule at list price ($3k rent vs $285k).
- Recommended offer: $276k (3.0% below list) — sets the bar for market timing.
- Cap rate 8.3% vs local median 5.0% in Mono Vista — top-decile yield for the area; either an underpriced asset or a hidden risk that comps aren't pricing in. Stress-test before assuming the spread holds.
Location & tenants
- Location reads 56/100 on livability (#793 in CA) — a working-class tenant base; expect higher turnover. Strengths: housing A+, crime B, employment B; Watch: schools D, amenities F, commute F.
- Soulsbyville Elementary (town): math 30% / reading 38% proficiency, ranked #272 of 517 in CA (top 53%) — families likely to look elsewhere, expect single-tenant / working-renter base with shorter leases.
- Market conditions: 299 active listings in the ZIP; 2 comparable units currently listed for rent nearby; 60 units permitted in Tuolumne County in 2024 (0 in 5+ unit buildings).
Forward outlook
- Local home prices are declining (-3.0%/yr); year-one equity from $2k of loan paydown is wiped out by about $9k of value loss. Plan a longer hold.
- Tuolumne County population projected at -15% by 2050 — secular population decline; favor cash flow + early exit over multi-decade hold.
Negotiation context
- It's been on market 53 days — a 3% lower offer ($276k) is reasonable based on typical stale-listing flexibility.
- 2 sale attempts with the ask held roughly flat each time — persistent listings suggest the price (not the market) is what's stuck; bring a comps-based counter.
Risks & watch-outs
- Climate carrying-cost: severe wildfire risk — expect insurance premiums to compound above CPI over the hold.
Questions for the listing agent
- It's been on market 53 days. Have you received any prior offers? Is the seller open to a 3% concession, seller financing, or rate buy-down credit?
- Built in 1972 — when were the roof, HVAC, electrical panel, plumbing, and water heater last replaced?
- What does the HOA fee cover, when was the last increase, and are there any pending special assessments or reserve-fund shortfalls?
- Is there a deadline driving the sale (1031 exchange, divorce, estate, relocation)? That informs how much negotiation room exists.
- Schools are D-rated, which usually means shorter tenancies and higher turnover. Who's the typical renter profile here, and what's been the actual vacancy rate?
- What's the average days-on-market for RENTAL listings here right now (not sales)? A rising rental-DOM trend means longer vacancies and softer asking-rent achievability than the comps imply.
- What's the recent tenant-quality profile in this submarket — average credit score on applications, eviction rate, late-payment / NSF rate, and stable-employment percentage? A property-management company in the area should have these aggregated.
- How much new for-sale + rental construction is in the pipeline within 1–3 miles? Heavy new supply typically softens prices + rents 12–24 months out; constrained supply supports both.
Investment metrics
- 1% rule
- 1.01% ✓
- Cap rate
- 8.27%
- Cash-on-cash
- 7.07%
- DSCR
- 1.31
- GRM
- 8.3
CMA / ARV
- ARV (on-the-fly)
- $317,766
- Comps found
- 12
Show comp detail 12 sales within ~0.75 mi
| Address | Dist | Beds/Ba | Sqft | Sold | Price | $/sf | Match |
|---|---|---|---|---|---|---|---|
| 21786 Crystal Lake Dr | 0.18mi | 3/2.0 (+1) | 1,269 (+0%) | 10mo | $419,000 | $330 | 78 |
| 21313 American River Dr | 0.38mi | 3/2.0 (+1) | 1,296 (+2%) | 7mo | $322,500 | $249 | 68 |
| 21517 Crystal Falls Dr | 0.19mi | 3/2.0 (+1) | 1,366 (+8%) | 9mo | $314,000 | $230 | 65 |
| 21407 Crystal Falls Dr | 0.38mi | 3/2.0 (+1) | 1,140 (-10%) | 0mo | $320,000 | $281 | 60 |
| 16925 American River Dr. West | 0.27mi | 3/3.0 (+1) | 1,388 (+10%) | 3mo | $369,900 | $266 | 60 |
| 16537 Creekside Dr | 0.57mi | 2/2.0 | 1,328 (+5%) | 11mo | $325,000 | $245 | 56 |
| 16986 Oaktree Ln | 0.62mi | 2/1.0 | 1,296 (+2%) | 12mo | $325,000 | $251 | 53 |
| 16581 S Creekside Dr | 0.73mi | 3/2.0 (+1) | 1,296 (+2%) | 6mo | $305,000 | $235 | 52 |
| 21881 Phoenix Lake Rd | 0.57mi | 3/2.0 (+1) | 1,400 (+11%) | 2mo | $360,000 | $257 | 49 |
| 21931 Glenwood Rd | 0.57mi | 3/2.0 (+1) | 1,416 (+12%) | 1mo | $351,000 | $248 | 48 |
| 21338 Crystal Fls | 0.47mi | 3/2.0 (+1) | 1,409 (+11%) | 8mo | $220,000 | $156 | 48 |
| 21566 Hunts Rd | 0.70mi | 3/2.0 (+1) | 1,416 (+12%) | 10mo | $427,000 | $302 | 34 |
Match score weights: distance 35% · size 25% · config 20% · recency 20%. Top-matched comps best support the ARV.
Projected returns pro-forma
-3.0% appreciation · 3.0% rent growth · sell at horizon
- IRR
- -5.5%
- Equity multiple
- 0.80×
- Total profit
- $-16,310
- Equity at exit
- $42,494
- IRR
- 4.1%
- Equity multiple
- 1.30×
- Total profit
- $24,102
- Equity at exit
- $24,642
Cash invested: $79,800 (down + closing). Projections, not guarantees.
Landlord ↔ Tenant lean methodology
- Overall (STATE)
- 18 Strongly Tenant-Friendly
- State California
- 18 Strongly Tenant-Friendly · D+13
- County
- — inherits STATE
- City
- — inherits STATE
ZIP-level market 95370
- Active inventory
- 299
- Price-to-rent
- 8.3×
Monthly cashflow live
- Estimated rent
- $2,878 medium interval (Pro) →
- Mortgage (P&I)
- −$1,495
- Tax from tax record
- −$146 /mo · $1,757/yr
- Insurance
- −$119
- HOA
- −$44
- Vacancy / Maint / Mgmt
- −$604
- Net cashflow
- $470
Break-even live
UW: 25.0% down · 7.5% · 30yr · 1.5% tax · 5.0% vac · 8.0% maint · 8.0% mgmt
Financing live
Cash to close
- Down payment
- $71,250
- Closing costs
- $8,550
- Reserves months
- —
- Total cash needed
- —
Loan-product check · same deal, 3 products live
Conventional
25% down · 7.5% · 30yr
- Down + closing
- —
- Monthly P&I
- —
- Monthly cashflow
- —
- DSCR
- —
- Eligible?
- —
Personal DTI + credit; lowest rate.
DSCR
20% down · 8.5% · 30yr
- Down + closing
- —
- Monthly P&I
- —
- Monthly cashflow
- —
- DSCR
- —
- Eligible?
- —
No personal income docs; deal must DSCR.
Hard money
10% down · 12.0% · 12mo
- Down + closing
- —
- Monthly P&I
- —
- Monthly cashflow
- —
- DSCR
- —
- Eligible?
- —
Short-term bridge; refi at stabilization.
Rent comps 2 comps
| Address | Beds | Baths | Sqft | Rent | $/sqft | DOM | Units | Dist |
|---|---|---|---|---|---|---|---|---|
| 21593 Crystal Falls Dr Sonora, CA | 3.0 | 2.0 | 1250 | $2,950 | $2.36 | 23d | 1 | 0.18mi |
| 19011 Middle Camp Rd Twain Harte, CA | 3.0 | 2.0 | 1586 | $2,295 | $1.45 | 13d | 1 | 1.18mi |
HOA detail
- Monthly dues
- $44 · $528/yr
- Likely covers
- gym
Listing history 21 events
-
2026-06-19days on market $285,000 Active 53 DOM
-
2026-06-18days on market $285,000 Active 52 DOM
-
2026-06-17days on market $285,000 Active 51 DOM
-
2026-06-16days on market $285,000 Active 50 DOM
-
2026-06-15days on market $285,000 Active 49 DOM
-
2026-06-14days on market $285,000 Active 47 DOM
-
2026-06-12days on market $285,000 Active 46 DOM
-
2026-06-10days on market $285,000 Active 44 DOM
-
2026-06-09days on market $285,000 Active 43 DOM
-
2026-06-08days on market $285,000 Active 42 DOM
-
2026-06-07days on market $285,000 Active 41 DOM
-
2026-06-05days on market $285,000 Active 39 DOM
-
2026-06-05days on market $285,000 Active 38 DOM
-
2026-06-03days on market $285,000 Active 37 DOM
-
2026-06-02days on market $285,000 Active 36 DOM
-
2026-06-01days on market $285,000 Active 35 DOM
-
2026-05-31days on market $285,000 Active 34 DOM
-
2026-05-30days on market $285,000 Active 33 DOM
-
2026-05-19status Active
-
2026-04-28status Pending
-
2026-04-06$285,000 Active
ⓘ Source: listings_history table (triggers on properties + properties_extension) + one-shot
backfill from property_details.listing_events for pre-trigger history.
Tax reassessment forecast CA · Resets to sale price
- Current annual tax
- $1,757 · $146/mo
- Projected year-2 tax
- $2,166 · $180/mo
- Expected delta
- +$409/yr (+$34/mo · 23.3%)
ⓘ Screening estimate from a state-policy table — verify with the county assessor before closing.
Climate risk First Street
- Flood 1/10 Low FEMA zone X (unshaded) · 0% chance over 30 yrs
- Wildfire 8/10 Severe
- Heat 4/10 Moderate 7 d/yr ≥96°F today · 17 d/yr by 30 yrs out
- Wind 1/10 Low
- Air quality 10/10 Extreme 29 unhealthy d/yr today · 33 by 30 yrs out
Nearby sold comps map
Loading sold comps map…
Walkable amenities ~0.75 mi
Loading nearby amenities…
Taxation est. · year 1
- Rental income
- $34,537
- − Mortgage interest
- −$15,964
- − Property taxes
- −$1,757
- − Insurance
- −$1,425
- − Repairs & maintenance
- −$2,763
- − Management
- −$2,763
- − HOA
- −$528
- − Depreciation
- −$8,291
- Taxable income
- $1,046
- Est. tax owed @ 24.0%
- −$251
- After-tax cash flow
- $5,388/yr
For passive investors: Depreciation is non-cash, so a rental often shows a tax loss while cash-flowing — sheltering income. Rental losses are passive: they offset passive income freely, and up to $25,000/yr can offset ordinary (W-2) income if you actively participate and your MAGI is under $100k (phasing out to $0 by $150k); unused losses carry forward. On sale, claimed depreciation is recaptured at up to 25%, and gains may owe capital-gains tax (a 1031 exchange can defer both). Figures are a year-1 estimate at your 24.0% rate — not tax advice; consult a CPA.
Schools (NCES district)
- District
- Soulsbyville Elementary
- NCES district ID
- 0637320
- Math proficiency
- 30% ▼ -4.00%
- Reading proficiency
- 38% ▼ -10.00%
- Median HH income
- $60,518
- Composite
- 30.5/100
- National rank
- #6217
- State rank
- #272 of 517 in CA
Livability — Mono Vista
- Score
- 56/100
- State rank
- #793
- US rank
- #22675
Category grades
Schools grade is shown separately in the Schools card above.
Census & demographics
- Census place
- Mono Vista, CA
- Population (ZIP)
- 28,373
Population outlook (Tuolumne County) Hauer SSP2
- Today (2025)
- 50,349 people
- By 2030
- 48,708 · -3.3%
- By 2040
- 45,284 · -10.1%
- By 2050
- 42,575 · -15.4%
- By 2075
- 36,827 · -26.9%
- By 2100
- 30,369 · -39.7%
Race, ethnicity, and origin ACS 2023
- Neighborhood character
- Predominantly White (82%)
- Race & ethnicity
- White 82% Hispanic / Latino 11% Two or more races 9% Asian 1% Native American 1%
- Hispanic origin (detail)
- Mexican 7% Puerto Rican 1%
- Common ancestry
- Italian 5% Russian 4% Slovak 3%
- Foreign-born
- 5% · Canada
- Languages at home
- 95% English-only · Spanish 3%
Political lean MEDSL · Tuolumne
- 2024 margin
- Strong R (+21.9) · D 37.9% · R 59.7% · Other 2.4%
- 2008→2024 swing
- -9.2pp toward R · 2008: -12.7pp · 2024: -21.9pp
- All cycles
- 2024: R+21.9 2020: R+18.8 2016: R+20.9 2012: R+15.9 2008: R+12.7
Not yet ingested
- Civics
- —
Market trends
- HPI YoY
- ▼ -322.67%
- Current HPI
- 130.9637
- Rent YoY
- —
- Metro
- —
- State GDP YoY
- ▲ 3.21%
- F500 in state
- 116
Industry mix (Fortune 500 HQ in CA)
| Industry | F500 HQs | Revenue |
|---|---|---|
| Technology | 27 | $1,492B |
|
||
| Financial Services | 3 | $174B |
|
||
| Retail | 3 | $44B |
|
||
| Insurance | 3 | $26B |
|
||
| Media / Entertainment | 2 | $115B |
|
||
| Pharmaceuticals / Biotech | 2 | $62B |
|
||
Price history
3 events — show timeline
- 2026-05-19 Relisted — bridgeMLS, Bay East AOR, or Contra Costa AOR
- 2026-04-28 Pending — bridgeMLS, Bay East AOR, or Contra Costa AOR
- 2026-04-06 Listed $285,000 bridgeMLS, Bay East AOR, or Contra Costa AOR
Property tax history
+1.8%/yrLatest (2025): $1,757 · +1.7% YoY. Source: county tax records.
Cash-flow waterfall
monthlySold comps — $/sqft
last 12 mo · ≤1 miLoading sold comps…