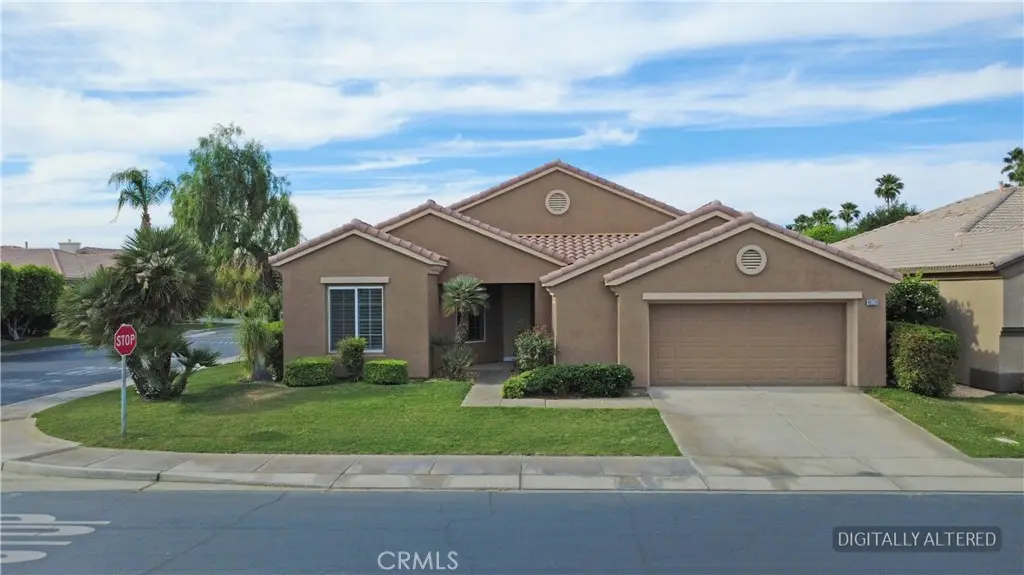
80370 Royal Aberdeen Dr · Indio, CA
Flood risk 1/10 · Minimal
- FEMA flood zone
- X (unshaded)
- Chance of flooding over 30 yrs
- 0.0%
- Est. flood insurance / yr
- $507 – $1,088
Fire risk 6/10 · Moderate
- Est. fire insurance / yr
- $659 – $1,223
Heat risk 10/10 · Severe
- Hot days now (above 114°F)
- 6 days/yr
- Hot days in 30 yrs
- 14 days/yr
Wind risk 1/10 · Minimal
- Chance of severe wind over 30 yrs
- —
Air-quality risk 4/10 · Minor
- Unhealthy air days now
- 4 days/yr
- Unhealthy air days in 30 yrs
- 5 days/yr
Risk factors via First Street. Map © Google.
Why this score? — see what drove the D grade
The composite is a weighted blend of 9 inputs, each scored 0–100. Each bar is that input's sub-score; the figure is the points it added to the 100-point composite (weight × sub-score).
- ARV discount +15.0/15.0
- Cash flow +7.7/30.0
- 1% rule +4.1/10.0
- Schools +3.8/10.0
- Rent growth +3.3/5.0
- Livability +2.7/5.0
- Condition / age +2.5/5.0
- DSCR +1.8/10.0
- Appreciation +0.0/10.0
$449,950
🖨 Deal sheet (PDF) 📄 Offer letter ✓ Due diligence
Listing remarks
Clean, well-maintained. and move-in ready! This Carnoustie model home is located in the highly desirable 55+ guard-gated community of Heritage Palms Country Club. Offering approximately 2,020 sq. ft. with 2 bedrooms, 2 bathrooms, plus a den/office, this home features a spacious layout, golf course/greenbelt setting, mountain views, and a 2-car plus golf cart garage. Located on the north side of Heritage Palms near the Fred Waring entrance, this well-maintained corner lot home offers convenient access to all the resort-style amenities the community is known for. Heritage Palms residents enjoy golf, clubhouse, restaurant, pools, fitness center, pickleball, tennis, and an active resort-style
Key facts
- Corner lot
- Active lifestyle
- Golf course setting
Tags
Property features AI
Finance
- Other: Located in a suburban community; Directions reference: community entrance at Fred Waring Dr & Jefferson St
- HOA & community: Part of Heritage Palms association; Monthly association fee of $600; Association amenities include gym/exercise room, pickleball, tennis, golf, clubhouse, controlled access; Senior community
Exterior
- Parking: Attached 2-car garage; 2 parking spaces total
- Utilities: Public sewer; District / public water
- Home design: Single-story house; Entry at front
- Construction: Year built source: Assessor
- Exterior features: House (no common walls); Community pool; Has a view; Lot described as 0-1 Unit/Acre
Interior
- Kitchen: Kitchen (appliances not specified)
- Bedrooms: 2 bedrooms on the main level
- Bathrooms: 2 full bathrooms
- Heating & cooling: Central cooling; Central furnace heating
- Interior features: One-level home with front entry; Main level has 2 bedrooms and 2 bathrooms; Living room
- Laundry & utility: Dedicated laundry room
Neighborhood map
What this means for you Summary
Snapshot
- This is a 2-bed/2.0-bath single-family listed at $450k.
Deal economics
- At list price, monthly cash flow is $-521 ($-6k/yr) — negative.
- To cash-flow at today's rent, offer at most $358k (20.5% below list).
- To meet the 1% rule (rent ≥ 1% of price), the offer needs to be $410k (8.9% below list).
- Recommended offer: $358k (20.5% below list) — sets the bar for cash-flow.
Location & tenants
- Location reads 53/100 on livability (#927 in CA) — a working-class tenant base; expect higher turnover. Strengths: housing B+; Watch: employment D, crime F, amenities F.
- Desert Sands Unified (suburban): math 31% / reading 56% proficiency, ranked #199 of 517 in CA (top 38%) — families likely to look elsewhere, expect single-tenant / working-renter base with shorter leases.
- Zoned schools: Carrillo Ranch Elementary (492 students, 81% FRL); Colonel Mitchell Paige Middle (math 10% / reading 10%, grade F, #474 of 498 statewide, top 99%, 436 students, 74% FRL); La Quinta High (math 31% / reading 65%, grade D, #380 of 1,170 statewide, top 33%, 2,500 students, 74% FRL) — zoned schools average 76% FRL vs 56% district-wide (20 pts higher); higher-poverty schools than district average — tighter screening recommended.
- Zoned-school proficiency averages 29% at this address vs 44% district-wide (-14 pts) — the specific schools serving this property underperform the Desert Sands Unified average; the district grade overstates school quality for this exact location.
- Market conditions: Rents rising (+3.3%/yr); 515 active listings in the ZIP; 40 comparable units currently listed for rent nearby; rentals lingering (median 46d on market — plan ~5-8 weeks vacancy on turnover, expect pricing pressure); 58% of comp listings sitting > 30 days — soft ceiling on asking rent; 9,195 units permitted in Riverside County in 2024 (1,512 in 5+ unit buildings).
- At $4,099/mo this rent would consume 74% of the median local household income ($67k/yr) (locally 2036% of renters already pay >50% of income on rent) — very limited rent-growth headroom before tenants either downsize or default.
Forward outlook
- Local home prices are declining (-3.0%/yr); year-one equity from $3k of loan paydown is wiped out by about $13k of value loss. Plan a longer hold.
- Riverside County population projected at +22% by 2050 — long-run rental-demand tailwind backs the buy-and-hold thesis.
Negotiation context
- It's been on market 44 days — a 3% lower offer ($436k) is reasonable based on typical stale-listing flexibility.
- 5 sale attempts since 20y ago with the ask held roughly flat each time — persistent listings suggest the price (not the market) is what's stuck; bring a comps-based counter.
Risks & watch-outs
- Climate carrying-cost: major wildfire risk; extreme-heat days projected 6→14/yr by 2055 (HVAC capex compounding) — expect insurance premiums to compound above CPI over the hold.
Questions for the listing agent
- What do current leases actually rent for vs. the listed asking? Can we see a recent rent roll and the last 12 months of T-12 income?
- It's been on market 44 days. Have you received any prior offers? Is the seller open to a 20% concession, seller financing, or rate buy-down credit?
- What does the HOA fee cover, when was the last increase, and are there any pending special assessments or reserve-fund shortfalls?
- Is there a deadline driving the sale (1031 exchange, divorce, estate, relocation)? That informs how much negotiation room exists.
- Schools are F-rated, which usually means shorter tenancies and higher turnover. Who's the typical renter profile here, and what's been the actual vacancy rate?
- Crime grade is F in this area — have there been break-ins, vandalism, or insurance claims at this property in the last 3 years? What carrier currently insures it and at what premium?
- The area grade is low — what's the realistic commute time and amenity access for the typical tenant pool here? Any planned neighborhood developments (good or bad) we should know about?
- What's the average days-on-market for RENTAL listings here right now (not sales)? A rising rental-DOM trend means longer vacancies and softer asking-rent achievability than the comps imply.
- What's the recent tenant-quality profile in this submarket — average credit score on applications, eviction rate, late-payment / NSF rate, and stable-employment percentage? A property-management company in the area should have these aggregated.
- How much new for-sale + rental construction is in the pipeline within 1–3 miles? Heavy new supply typically softens prices + rents 12–24 months out; constrained supply supports both.
Investment metrics
- 1% rule
- 0.91% ✗
- Cap rate
- 4.90%
- Cash-on-cash
- -4.97%
- DSCR
- 0.78
- GRM
- 9.1
CMA / ARV
- ARV (median comp)
- $571,557
- List price
- $449,950
- Delta
- -21.28%
- Verdict
- UNDERPRICED
- Comps
- 20 within 1.0 mi
Show comp detail 12 sales within ~0.75 mi
| Address | Dist | Beds/Ba | Sqft | Sold | Price | $/sf | Match |
|---|---|---|---|---|---|---|---|
| 80405 Portobello Dr | 0.12mi | 2/2.0 | 2,020 (0%) | 2mo | $470,000 | $233 | 93 |
| 80729 Braemar Ct | 0.28mi | 2/2.0 | 2,061 (+2%) | 3mo | $457,000 | $222 | 81 |
| 43328 Heritage Palms Dr N | 0.18mi | 2/2.0 | 1,885 (-7%) | 2mo | $599,000 | $318 | 78 |
| 44075 Royal Troon Dr | 0.45mi | 2/2.0 | 2,052 (+2%) | 2mo | $360,000 | $175 | 75 |
| 80190 Royal Birkdale | 0.57mi | 2/2.0 | 2,061 (+2%) | 2mo | $460,000 | $223 | 68 |
| 44110 Royal Troon Dr | 0.59mi | 2/2.0 | 1,885 (-7%) | 1mo | $385,000 | $204 | 61 |
| 44382 Royal Lytham Dr | 0.62mi | 3/2.0 (+1) | 2,079 (+3%) | 2mo | $560,000 | $269 | 59 |
| 44327 Royal Lytham Dr | 0.52mi | 2/2.5 | 2,172 (+8%) | 3mo | $695,000 | $320 | 59 |
| 44601 S Heritage Palms Dr | 0.46mi | 3/2.0 (+1) | 1,827 (-10%) | 0mo | $555,000 | $304 | 58 |
| 80717 Turnberry Ct | 0.33mi | 2/2.0 | 1,720 (-15%) | 3mo | $397,500 | $231 | 58 |
| 80534 Knightswood Rd | 0.46mi | 2/2.0 | 1,766 (-13%) | 2mo | $590,000 | $334 | 56 |
| 44584 S Heritage Palms Dr | 0.40mi | 3/2.0 (+1) | 2,258 (+12%) | 2mo | $590,000 | $261 | 55 |
Match score weights: distance 35% · size 25% · config 20% · recency 20%. Top-matched comps best support the ARV.
Projected returns pro-forma
-3.0% appreciation · 3.34% rent growth · sell at horizon
- IRR
- -24.1%
- Equity multiple
- 0.17×
- Total profit
- $-104,243
- Equity at exit
- $67,089
- IRR
- -17.9%
- Equity multiple
- 0.00×
- Total profit
- $-125,835
- Equity at exit
- $38,903
Cash invested: $125,986 (down + closing). Projections, not guarantees.
Landlord ↔ Tenant lean methodology
- Overall (STATE)
- 18 Strongly Tenant-Friendly
- State California
- 18 Strongly Tenant-Friendly · D+13
- County
- — inherits STATE
- City
- — inherits STATE
ZIP-level market 92201
- Home prices YoY
- -28.4%
- Rents YoY
- 3.3%
- Active inventory
- 515
- Price-to-rent
- 9.1×
Monthly cashflow live
- Estimated rent
- $4,099 high interval (Pro) →
- Mortgage (P&I)
- −$2,360
- Tax from tax record
- −$613 /mo · $7,351/yr
- Insurance
- −$187
- HOA
- −$600
- Vacancy / Maint / Mgmt
- −$861
- Net cashflow
- $-521
Break-even live
Sensitivity live
| Price | -10% $-267 | -5% $-394 | +0% $-521 | +5% $-649 | +10% $-776 |
|---|---|---|---|---|---|
| Rent | -10% $-845 | -5% $-683 | +0% $-521 | +5% $-359 | +10% $-197 |
| Rate | -1.0pp $-295 | -0.5pp $-407 | base $-521 | +0.5pp $-638 | +1.0pp $-756 |
UW: 25.0% down · 7.5% · 30yr · 1.5% tax · 5.0% vac · 8.0% maint · 8.0% mgmt
Financing live
Cash to close
- Down payment
- $112,488
- Closing costs
- $13,498
- Reserves months
- —
- Total cash needed
- —
Loan-product check · same deal, 3 products live
Conventional
25% down · 7.5% · 30yr
- Down + closing
- —
- Monthly P&I
- —
- Monthly cashflow
- —
- DSCR
- —
- Eligible?
- —
Personal DTI + credit; lowest rate.
DSCR
20% down · 8.5% · 30yr
- Down + closing
- —
- Monthly P&I
- —
- Monthly cashflow
- —
- DSCR
- —
- Eligible?
- —
No personal income docs; deal must DSCR.
Hard money
10% down · 12.0% · 12mo
- Down + closing
- —
- Monthly P&I
- —
- Monthly cashflow
- —
- DSCR
- —
- Eligible?
- —
Short-term bridge; refi at stabilization.
Rent comps 40 comps
| Address | Beds | Baths | Sqft | Rent | $/sqft | DOM | Units | Dist |
|---|---|---|---|---|---|---|---|---|
| 80411 Portobello Dr Indio, CA | 2.0 | 2.0 | 1707 | $3,200 | $1.87 | 45d | 1 | 0.15mi |
| 43388 Saint Andrews Dr Indio, CA | 2.0 | 2.0 | 1917 | $3,500 | $1.83 | 45d | 1 | 0.22mi |
| 43387 Saint Andrews Dr Indio, CA | 2.0 | 2.0 | 1766 | $4,500 | $2.55 | 45d | 1 | 0.27mi |
| 80571 Hoylake Dr Indio, CA | 2.0 | 2.5 | 2172 | $4,200 | $1.93 | 18d | 1 | 0.35mi |
| 80589 Hoylake Dr Indio, CA | 2.0 | 2.0 | 1420 | $2,500 | $1.76 | 20d | 1 | 0.37mi |
| 43465 Liberty St Indio, CA | 3.0 | 2.0 | 2200 | $4,200 | $1.91 | 45d | 1 | 0.45mi |
| 43419 Corte del Oro La Quinta, CA | 3.0 | 2.0 | 1829 | $7,000 | $3.83 | 19d | 1 | 0.48mi |
| 43424 Bordeaux Dr La Quinta, CA | 3.0 | 2.0 | 2172 | $6,000 | $2.76 | 45d | 1 | 0.55mi |
| 44725 Alexandria Vale Indio, CA | 2.0 | 2.0 | 1707 | $2,800 | $1.64 | 45d | 1 | 0.57mi |
| 80200 Royal Birkdale Dr Indio, CA | 2.0 | 2.0 | 2061 | $6,500 | $3.15 | 19d | 1 | 0.58mi |
| 80149 Royal Birkdale Dr Indio, CA | 3.0 | 2.0 | 2466 | $6,000 | $2.43 | 45d | 1 | 0.62mi |
| 42391 Palisades Dr Indio, CA | 3.0 | 2.0 | 1679 | $2,975 | $1.77 | 45d | 1 | 0.63mi |
| 42655 Delhi Pl Bermuda Dunes, CA | 3.0 | 2.5 | 1988 | $8,000 | $4.02 | 20d | 1 | 0.64mi |
| 80216 Jasper Park Ave Indio, CA | 2.0 | 3.0 | 1703 | $2,899 | $1.70 | 20d | 1 | 0.65mi |
| 43480 Port Maria Rd Bermuda Dunes, CA | 3.0 | 3.0 | 2096 | $6,500 | $3.10 | 45d | 1 | 0.68mi |
| 43480 Port Maria Rd Bermuda Dunes, CA | 3.0 | 3.0 | 2096 | $6,500 | $3.10 | 7d | 1 | 0.68mi |
| 44060 Mariposa Ct La Quinta, CA | 3.0 | 2.0 | 1621 | $3,250 | $2.00 | 45d | 1 | 0.70mi |
| 80055 Jasper Park Ave Indio, CA | 3.0 | 2.5 | 2162 | $4,000 | $1.85 | 45d | 1 | 0.71mi |
| 79948 Bethpage Ave Indio, CA | 3.0 | 2.0 | 1529 | $4,500 | $2.94 | 45d | 1 | 0.73mi |
| 45168 Coeur Dalene Dr Indio, CA | 3.0 | 3.0 | 2719 | $9,000 | $3.31 | 26d | 1 | 0.74mi |
| 80172 Green Hills Dr Indio, CA | 2.0 | 2.5 | 1703 | $4,200 | $2.47 | 45d | 1 | 0.77mi |
| 43615 Roebelenii Way Indio, CA | 3.0 | 2.0 | 1508 | $2,599 | $1.72 | 14d | 1 | 0.78mi |
| 80395 Green Hills Dr Indio, CA | 3.0 | 3.0 | 1981 | $7,500 | $3.79 | 45d | 1 | 0.80mi |
| 45233 Big Canyon St Indio, CA | 3.0 | 2.0 | 1529 | $6,000 | $3.92 | 45d | 1 | 0.81mi |
| 45338 Coeur Dalene Dr Indio, CA | 3.0 | 3.0 | 1898 | $6,500 | $3.42 | 45d | 1 | 0.82mi |
| 81145 Paludosa Dr Indio, CA | 3.0 | 2.0 | 1823 | $3,000 | $1.65 | 23d | 1 | 0.83mi |
| 45439 Shaugnessy Dr Indio, CA | 2.0 | 2.5 | 1703 | $5,500 | $3.23 | 45d | 1 | 0.86mi |
| 80372 Pebble Beach Dr Indio, CA | 3.0 | 3.0 | 1898 | $3,750 | $1.98 | 45d | 1 | 0.87mi |
| 80162 Pebble Beach Dr Indio, CA | 3.0 | 3.0 | 1898 | $8,000 | $4.21 | 18d | 1 | 0.87mi |
| 45385 Big Canyon St Indio, CA | 3.0 | 2.0 | 1529 | $3,200 | $2.09 | 45d | 1 | 0.88mi |
| 45553 Meadow Lake Dr Indio, CA | 3.0 | 2.0 | 2168 | $8,000 | $3.69 | 18d | 1 | 0.92mi |
| 79535 Dandelion Dr La Quinta, CA | 3.0 | 3.0 | 2237 | $3,950 | $1.77 | 45d | 1 | 0.93mi |
| 79891 Avenue 42 Unit 1 Bermuda Dunes, CA | 2.0 | 2.0 | 1400 | $1,895 | $1.35 | 21d | 1 | 0.93mi |
| 80188 Golden Horseshoe Dr Indio, CA | 3.0 | 2.5 | 1898 | $3,200 | $1.69 | 45d | 1 | 0.95mi |
| 80346 Indian Springs Dr Indio, CA | 2.0 | 2.5 | 1713 | $3,500 | $2.04 | 20d | 1 | 1.01mi |
| 44270 Camino Lavanda La Quinta, CA | 3.0 | 2.0 | 2216 | $5,797 | $2.62 | 45d | 1 | 1.08mi |
| 45596 Torrey Pines Ct Indio, CA | 3.0 | 3.0 | 1981 | $4,000 | $2.02 | 7d | 1 | 1.11mi |
| 79188 Bog Walk Ct Bermuda Dunes, CA | 3.0 | 3.0 | 2748 | $3,000 | $1.09 | 4d | 1 | 1.15mi |
| 79631 Half Moon Bay Dr Indio, CA | 2.0 | 2.5 | 1703 | $3,600 | $2.11 | 7d | 1 | 1.17mi |
| 80538 Avenida Camarillo Indio, CA | 2.0 | 2.0 | 1571 | $2,500 | $1.59 | 45d | 1 | 1.18mi |
HOA detail
- Monthly dues
- $600 · $7,200/yr
- Likely covers
- poolgymsecurity
Listing history 28 events
-
2026-06-21days on market $449,950 Active 44 DOM
-
2026-06-18days on market $449,950 Active 41 DOM
-
2026-06-17days on market $449,950 Active 40 DOM
-
2026-06-16days on market $449,950 Active 39 DOM
-
2026-06-15days on market $449,950 Active 38 DOM
-
2026-06-13days on market $449,950 Active 36 DOM
-
2026-06-09days on market $449,950 Active 32 DOM
-
2026-06-08days on market $449,950 Active 31 DOM
-
2026-06-07days on market $449,950 Active 30 DOM
-
2026-06-04days on market $449,950 Active 27 DOM
-
2026-06-03days on market $449,950 Active 26 DOM
-
2026-06-02days on market $449,950 Active 25 DOM
-
2026-06-01days on market $449,950 Active 24 DOM
-
2026-05-31days on market $449,950 Active 23 DOM
-
2026-05-08$449,950 Active 731-char remark
-
2025-09-08historical $1,800
-
2025-08-18price $1,800
-
2025-07-27price $1,500
-
2024-10-04$3,100
-
2009-05-09historical
-
2008-10-27price $469,000
-
2008-06-20$479,000
-
2008-05-18historical
-
2008-04-08price $479,000
-
2008-01-31price $489,000
-
2007-11-19$499,000
-
2007-02-02historical
-
2006-07-29$519,000
ⓘ Source: listings_history table (triggers on properties + properties_extension) + one-shot
backfill from property_details.listing_events for pre-trigger history.
Tax reassessment forecast CA · Resets to sale price
- Current annual tax
- $7,351 · $613/mo
- Projected year-2 tax
- $7,351 · $613/mo
- Expected delta
- $0/yr ($0/mo · 0.0%)
ⓘ Screening estimate from a state-policy table — verify with the county assessor before closing.
Climate risk First Street
- Flood 1/10 Low FEMA zone X (unshaded) · 0% chance over 30 yrs
- Wildfire 6/10 Major
- Heat 10/10 Extreme 6 d/yr ≥114°F today · 14 d/yr by 30 yrs out
- Wind 1/10 Low
- Air quality 4/10 Moderate 4 unhealthy d/yr today · 5 by 30 yrs out
Nearby sold comps map
Loading sold comps map…
Walkable amenities ~0.75 mi
Loading nearby amenities…
Taxation est. · year 1
- Rental income
- $49,191
- − Mortgage interest
- −$25,204
- − Property taxes
- −$7,351
- − Insurance
- −$2,250
- − Repairs & maintenance
- −$3,935
- − Management
- −$3,935
- − HOA
- −$7,200
- − Depreciation
- −$13,089
- Taxable loss
- −$13,774
- Est. tax savings @ 24.0%
- +$3,306
- After-tax cash flow
- $-2,949/yr
For passive investors: Depreciation is non-cash, so a rental often shows a tax loss while cash-flowing — sheltering income. Rental losses are passive: they offset passive income freely, and up to $25,000/yr can offset ordinary (W-2) income if you actively participate and your MAGI is under $100k (phasing out to $0 by $150k); unused losses carry forward. On sale, claimed depreciation is recaptured at up to 25%, and gains may owe capital-gains tax (a 1031 exchange can defer both). Figures are a year-1 estimate at your 24.0% rate — not tax advice; consult a CPA.
Schools (NCES district)
- District
- Desert Sands Unified
- NCES district ID
- 0611110
- Math proficiency
- 31% ▼ -4.00%
- Reading proficiency
- 56% ▲ 7.00%
- Median HH income
- $54,957
- Composite
- 37.77/100
- National rank
- #4346
- State rank
- #199 of 517 in CA
Livability — Indio
- Score
- 53/100
- State rank
- #927
- US rank
- #24244
Category grades
Schools grade is shown separately in the Schools card above.
Census & demographics
- Census place
- Indio, CA
- County
- Riverside County · 2,287,001 people
- City population
- 100,560
- Metro
- Riverside-San Bernardino-Ontario, CA
- Population (ZIP)
- 65,825
- Household income
- $66,758
- Rent vs Own
- Severe rent burden
- 2036.0
Population outlook (Riverside County) Hauer SSP2
- Today (2025)
- 2,664,475 people
- By 2030
- 2,802,692 · +5.2%
- By 2040
- 3,050,904 · +14.5%
- By 2050
- 3,256,783 · +22.2%
- By 2075
- 3,655,058 · +37.2%
- By 2100
- 3,766,594 · +41.4%
Race, ethnicity, and origin ACS 2023
- Neighborhood character
- Predominantly Hispanic (74%)
- Race & ethnicity
- Hispanic / Latino 74% Two or more races 39% White 19% Black 3% Asian 3% Native American 1%
- Hispanic origin (detail)
- Mexican 69%
- Common ancestry
- Romanian 1% Iranian 1%
- Foreign-born
- 29% · Canada, Vietnam, Jamaica
- Languages at home
- 41% English-only · Spanish 55% Arabic 1% Tagalog/Filipino 1%
Political lean MEDSL · Riverside
- 2024 margin
- Toss-up / Even · D 48.0% · R 49.3% · Other 2.6%
- 2008→2024 swing
- -3.6pp toward R · 2008: 2.3pp · 2024: -1.3pp
- All cycles
- 2024: R+1.3 2020: D+8.0 2016: D+4.3 2012: R+0.4 2008: D+2.3
Not yet ingested
- Civics
- —
Market trends
- HPI YoY
- ▼ -138.46%
- Current HPI
- 348.6605
- Rent YoY
- ▲ 3.34%
- Metro
- Riverside-San Bernardino-Ontario, CA
- State GDP YoY
- ▲ 3.21%
- F500 in state
- 116
Industry mix (Fortune 500 HQ in CA)
| Industry | F500 HQs | Revenue |
|---|---|---|
| Technology | 27 | $1,492B |
|
||
| Financial Services | 3 | $174B |
|
||
| Retail | 3 | $44B |
|
||
| Insurance | 3 | $26B |
|
||
| Media / Entertainment | 2 | $115B |
|
||
| Pharmaceuticals / Biotech | 2 | $62B |
|
||
Price history
-13.3% since first listed14 events — show timeline
- 2026-05-08 Listed $449,950 CRMLS
- 2025-09-08 Rental Removed $1,800 REDFIN
- 2025-08-18 Price Changed $1,800 REDFIN
- 2025-07-27 Price Changed $1,500 REDFIN
- 2024-10-04 Listed for Rent $3,100 REDFIN
- 2009-05-09 Listing Removed — GPSMLS
- 2008-10-27 Price Changed $469,000 GPSMLS
- 2008-06-20 Listed $479,000 GPSMLS
- 2008-05-18 Listing Removed — GPSMLS
- 2008-04-08 Price Changed $479,000 GPSMLS
- 2008-01-31 Price Changed $489,000 GPSMLS
- 2007-11-19 Listed $499,000 GPSMLS
- 2007-02-02 Listing Removed — GPSMLS
- 2006-07-29 Listed $519,000 GPSMLS
Property tax history
+4.2%/yrLatest (2025): $7,351 · +46.6% YoY. Source: county tax records.
Cash-flow waterfall
monthlySold comps — $/sqft
last 12 mo · ≤1 miLoading sold comps…