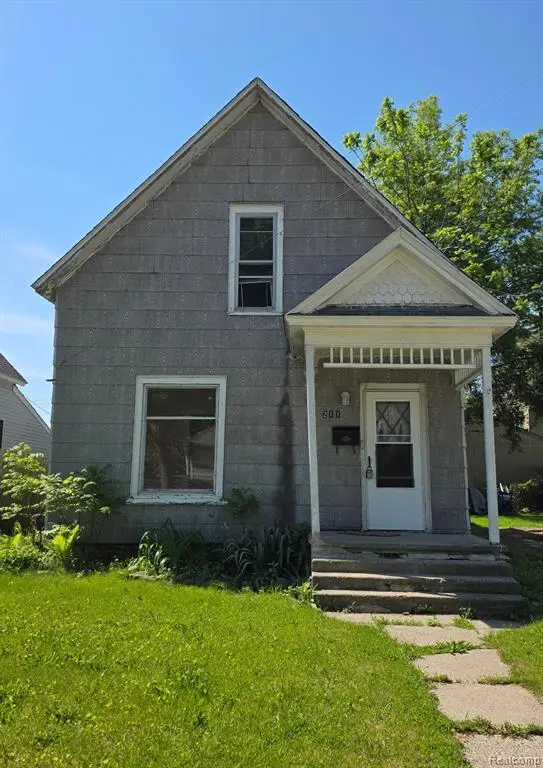
211 W Flint St · Lake Orion, MI
Flood risk 1/10 · Minimal
- FEMA flood zone
- X (unshaded)
- Chance of flooding over 30 yrs
- 0.0%
- Est. flood insurance / yr
- $473 – $860
Fire risk 1/10 · Minimal
- Est. fire insurance / yr
- $784 – $1,456
Heat risk 2/10 · Minimal
- Hot days now (above 97°F)
- 7 days/yr
- Hot days in 30 yrs
- 15 days/yr
Wind risk 2/10 · Minimal
- Chance of severe wind over 30 yrs
- —
Air-quality risk 3/10 · Minor
- Unhealthy air days now
- 2 days/yr
- Unhealthy air days in 30 yrs
- 4 days/yr
Risk factors via First Street. Map © Google.
Why this score? — see what drove the B grade
The composite is a weighted blend of 9 inputs, each scored 0–100. Each bar is that input's sub-score; the figure is the points it added to the 100-point composite (weight × sub-score).
- Cash flow +30.0/30.0
- 1% rule +10.0/10.0
- DSCR +10.0/10.0
- ARV discount +7.5/15.0
- Schools +5.1/10.0
- Livability +4.0/5.0
- Rent growth +2.5/5.0
- Condition / age +2.5/5.0
- Appreciation +0.0/10.0
$120,000
🖨 Deal sheet (PDF) 📄 Offer letter ✓ Due diligence
Listing remarks MLS
Handyman special in a prime Lake Orion location! Walking distance to downtown Lake Orion, shopping, dining, and entertainment. Includes lake privileges on beautiful Lake Orion, an all-sports lake. Perfect for renovation enthusiasts or investors looking for their next project, or buyers looking to build sweat equity. This property only has street parking - no driveway.
Key facts
- Lake privileges
- All sports lake
- 5,663 sq ft lot
Tags
Property features AI
Exterior
- Parking: No garage
- Utilities: Public water; Public sewer
- Home design: Single-family residence; Two levels; Lower-level entry with steps; Residential property
- Construction: Built with block foundation; Other construction materials; Asphalt roof
- Exterior features: Lake privileges; Paved road access; Lot roughly 30 x 180 (0.13 acres)
Interior
- Bathrooms: One full bathroom
- Heating & cooling: Forced air heating; Natural gas heating; No central cooling
- Interior features: Unfinished basement; Five total rooms
Neighborhood map
What this means for you Summary
Snapshot
- This is a 3-bed/1.0-bath single-family listed at $120k.
Deal economics
- At list price, monthly cash flow is $1k ($16k/yr) — positive.
- The deal already cash-flows at list — no discount required.
- Meets the 1% rule at list price ($3k rent vs $120k).
- Cap rate 19.9% vs local median 4.4% in Lake Orion — top-decile yield for the area; either an underpriced asset or a hidden risk that comps aren't pricing in. Stress-test before assuming the spread holds.
Location & tenants
- Location reads 80/100 on livability (#77 in MI, #1,679 nationally) — a professional / high-income tenant draw. Strengths: employment A+, housing A+, cost of living A; Watch: amenities F, commute F.
- Lake Orion Community Schools (suburban): math 49% / reading 64% proficiency, ranked #45 of 540 in MI (top 8%) — acceptable for families but not a draw, mixed tenant base, ~2y average lease; only 16% free/reduced lunch — higher-income household profile.
- Zoned schools: Orion Oaks Elementary School (math 39% / reading 59%, grade D, #425 of 1,397 statewide, top 31%, 515 students, 32% FRL); Oakview Middle School (math 50% / reading 64%, grade B, #66 of 493 statewide, top 14%, 406 students, 35% FRL); Lake Orion Community High School (math 54% / reading 75%, grade B-, #46 of 713 statewide, top 7%, 2,174 students, 24% FRL).
- Market conditions: 90 active listings in the ZIP; 5 comparable units currently listed for rent nearby; rentals at typical pace (median 17d on market — plan ~3-4 weeks tenant-placement turnaround); 2,614 units permitted in Oakland County in 2024 (721 in 5+ unit buildings).
Forward outlook
- Local home prices are declining (-3.0%/yr); year-one equity from $830 of loan paydown is wiped out by about $4k of value loss. Plan a longer hold.
- Oakland County population projected at +10% by 2050 — modest demand growth; plan on rents tracking national, not racing it.
- At projected returns (-3.0% appreciation + 3.0% rent growth), your $34k cash investment doubles in ~3 years — after that, you're playing with house money.
Negotiation context
- Only 4 days on market — expect competitive offers; lowballing is unlikely to land.
- 2 sale attempts with the ask held roughly flat each time — persistent listings suggest the price (not the market) is what's stuck; bring a comps-based counter.
- Current owner paid $65k; list at $120k implies a 85% gain — meaningful room to come down on a strong offer.
Risks & watch-outs
- Watch-outs: property tax is 2.7% of price; built in 1930 — expect roof / HVAC / electrical / plumbing capex.
Questions for the listing agent
- Built in 1930 — when were the roof, HVAC, electrical panel, plumbing, and water heater last replaced?
- Property tax is high relative to price — has the assessment been appealed recently, and will the sale trigger a re-assessment?
- Is there a deadline driving the sale (1031 exchange, divorce, estate, relocation)? That informs how much negotiation room exists.
- Schools are A-rated — typically a magnet for longer-tenancy family renters. What's the average tenant stay here, and is there a school-zone premium baked into asking?
- What's the average days-on-market for RENTAL listings here right now (not sales)? A rising rental-DOM trend means longer vacancies and softer asking-rent achievability than the comps imply.
- What's the recent tenant-quality profile in this submarket — average credit score on applications, eviction rate, late-payment / NSF rate, and stable-employment percentage? A property-management company in the area should have these aggregated.
- How much new for-sale + rental construction is in the pipeline within 1–3 miles? Heavy new supply typically softens prices + rents 12–24 months out; constrained supply supports both.
Investment metrics
- 1% rule
- 2.43% ✓
- Cap rate
- 19.93%
- Cash-on-cash
- 48.70%
- DSCR
- 3.17
- GRM
- 3.4
CMA / ARV
- ARV (on-the-fly)
- $262,240
- Comps found
- 12
Show comp detail 12 sales within ~0.75 mi
| Address | Dist | Beds/Ba | Sqft | Sold | Price | $/sf | Match |
|---|---|---|---|---|---|---|---|
| 126 N North Shore Dr | 0.21mi | 3/1.5 | 1,170 (-2%) | 4mo | $230,000 | $197 | 82 |
| 229 W Flint St | 0.02mi | 3/2.0 | 1,352 (+13%) | 4mo | $285,000 | $211 | 69 |
| 225 E Shadbolt St | 0.37mi | 2/1.0 (-1) | 1,215 (+2%) | 8mo | $315,000 | $259 | 68 |
| 325 N Broadway St | 0.30mi | 3/1.0 | 1,318 (+11%) | 1mo | $165,000 | $125 | 68 |
| 74 Odanah St | 0.62mi | 3/1.5 | 1,109 (-7%) | 1mo | $244,000 | $220 | 56 |
| 495 Glenn Ct | 0.54mi | 3/1.5 | 1,250 (+5%) | 20mo | $275,000 | $220 | 48 |
| 336 Heights Rd | 0.68mi | 3/2.0 | 1,213 (+2%) | 16mo | $399,950 | $330 | 48 |
| 586 Bagley St | 0.64mi | 3/1.0 | 1,036 (-13%) | 1mo | $242,500 | $234 | 48 |
| 536 Atwater St | 0.64mi | 3/1.0 | 1,260 (+6%) | 17mo | $210,000 | $167 | 46 |
| 414 Norland St | 0.71mi | 3/1.0 | 1,300 (+9%) | 12mo | $265,000 | $204 | 41 |
| 108 Highland Ave | 0.58mi | 2/1.5 (-1) | 1,320 (+11%) | 10mo | $730,000 | $553 | 39 |
| 338 Atwater St | 0.51mi | 3/2.0 | 1,346 (+13%) | 20mo | $260,000 | $193 | 34 |
Match score weights: distance 35% · size 25% · config 20% · recency 20%. Top-matched comps best support the ARV.
Projected returns pro-forma
-3.0% appreciation · 3.0% rent growth · sell at horizon
- IRR
- 46.3%
- Equity multiple
- 3.01×
- Total profit
- $67,513
- Equity at exit
- $17,892
- IRR
- 52.1%
- Equity multiple
- 6.09×
- Total profit
- $171,081
- Equity at exit
- $10,375
Cash invested: $33,600 (down + closing). Projections, not guarantees.
Landlord ↔ Tenant lean methodology
- Overall (STATE)
- 62 Landlord-Friendly
- State Michigan
- 62 Landlord-Friendly · EVEN
- County
- — inherits STATE
- City
- — inherits STATE
ZIP-level market 48362
- Active inventory
- 90
- Price-to-rent
- 3.4×
Monthly cashflow live
- Estimated rent
- $2,922 high interval (Pro) →
- Mortgage (P&I)
- −$629
- Tax from tax record
- −$265 /mo · $3,184/yr
- Insurance
- −$50
- HOA
- −$0
- Vacancy / Maint / Mgmt
- −$614
- Net cashflow
- $1,364
Break-even live
Sensitivity live
| Price | -10% $1,431 | -5% $1,397 | +0% $1,364 | +5% $1,330 | +10% $1,296 |
|---|---|---|---|---|---|
| Rent | -10% $1,133 | -5% $1,248 | +0% $1,364 | +5% $1,479 | +10% $1,594 |
| Rate | -1.0pp $1,424 | -0.5pp $1,394 | base $1,364 | +0.5pp $1,332 | +1.0pp $1,301 |
UW: 25.0% down · 7.5% · 30yr · 1.5% tax · 5.0% vac · 8.0% maint · 8.0% mgmt
Financing live
Cash to close
- Down payment
- $30,000
- Closing costs
- $3,600
- Reserves months
- —
- Total cash needed
- —
Loan-product check · same deal, 3 products live
Conventional
25% down · 7.5% · 30yr
- Down + closing
- —
- Monthly P&I
- —
- Monthly cashflow
- —
- DSCR
- —
- Eligible?
- —
Personal DTI + credit; lowest rate.
DSCR
20% down · 8.5% · 30yr
- Down + closing
- —
- Monthly P&I
- —
- Monthly cashflow
- —
- DSCR
- —
- Eligible?
- —
No personal income docs; deal must DSCR.
Hard money
10% down · 12.0% · 12mo
- Down + closing
- —
- Monthly P&I
- —
- Monthly cashflow
- —
- DSCR
- —
- Eligible?
- —
Short-term bridge; refi at stabilization.
Rent comps 5 comps
| Address | Beds | Baths | Sqft | Rent | $/sqft | DOM | Units | Dist |
|---|---|---|---|---|---|---|---|---|
| 120 S Broadway St Lake Orion, MI | 2.0 | 2.0 | 1065 | $2,950 | $2.77 | 16d | 1 | 0.19mi |
| 442 Mystic Cove Ln Lake Orion, MI | 2.0–4.0 | 2.0–3.0 | 1989 | $5,350 | $2.69 | 0d | 4 | 0.50mi |
| 733 Luna Ct Lake Orion, MI | 3.0 | 1.5 | 1177 | $2,695 | $2.29 | 20d | 1 | 0.76mi |
| 711 Kimberly Lake Orion, MI | 1.0–2.0 | 1.0–1.5 | 985 | $1,149 | $1.17 | 0d | 6 | 0.81mi |
| 784 Porteous Dr Lake Orion, MI | 2.0 | 1.0 | 875 | $1,600 | $1.83 | 45d | 1 | 1.05mi |
Listing history 6 events
-
2026-05-31status $120,000 Pending 4 DOM
-
2026-05-31days on market $120,000 Active 4 DOM
-
2026-05-27$120,000 Active
Show marketing remark (370 chars)
Handyman special in a prime Lake Orion location! Walking distance to downtown Lake Orion, shopping, dining, and entertainment. Includes lake privileges on beautiful Lake Orion, an all-sports lake. Perfect for renovation enthusiasts or investors looking for their next project, or buyers looking to build sweat equity. This property only has street parking - no driveway.
-
2026-05-27$120,000 Active 370-char remark
Show marketing remark (370 chars)
Handyman special in a prime Lake Orion location! Walking distance to downtown Lake Orion, shopping, dining, and entertainment. Includes lake privileges on beautiful Lake Orion, an all-sports lake. Perfect for renovation enthusiasts or investors looking for their next project, or buyers looking to build sweat equity. This property only has street parking - no driveway.
-
2004-08-25soldstatus $65,000
-
1997-08-05soldstatus $28,900
ⓘ Source: listings_history table (triggers on properties + properties_extension) + one-shot
backfill from property_details.listing_events for pre-trigger history.
Tax reassessment forecast MI · Partial reset (capped growth)
- Current annual tax
- $3,184 · $265/mo
- Projected year-2 tax
- $3,184 · $265/mo
- Expected delta
- $0/yr ($0/mo · 0.0%)
ⓘ Screening estimate from a state-policy table — verify with the county assessor before closing.
Climate risk First Street
- Flood 1/10 Low FEMA zone X (unshaded) · 0% chance over 30 yrs
- Wildfire 1/10 Low
- Heat 2/10 Low 7 d/yr ≥97°F today · 15 d/yr by 30 yrs out
- Wind 2/10 Low
- Air quality 3/10 Moderate 2 unhealthy d/yr today · 4 by 30 yrs out
Nearby sold comps map
Loading sold comps map…
Walkable amenities ~0.75 mi
Loading nearby amenities…
Taxation est. · year 1
- Rental income
- $35,060
- − Mortgage interest
- −$6,722
- − Property taxes
- −$3,184
- − Insurance
- −$600
- − Repairs & maintenance
- −$2,805
- − Management
- −$2,805
- − Depreciation
- −$3,491
- Taxable income
- $15,454
- Est. tax owed @ 24.0%
- −$3,709
- After-tax cash flow
- $12,653/yr
For passive investors: Depreciation is non-cash, so a rental often shows a tax loss while cash-flowing — sheltering income. Rental losses are passive: they offset passive income freely, and up to $25,000/yr can offset ordinary (W-2) income if you actively participate and your MAGI is under $100k (phasing out to $0 by $150k); unused losses carry forward. On sale, claimed depreciation is recaptured at up to 25%, and gains may owe capital-gains tax (a 1031 exchange can defer both). Figures are a year-1 estimate at your 24.0% rate — not tax advice; consult a CPA.
Schools (NCES district)
- District
- Lake Orion Community Schools
- NCES district ID
- 2620730
- Math proficiency
- 49% ▼ -10.00%
- Reading proficiency
- 64% ▼ -10.00%
- Median HH income
- $82,396
- Composite
- 51.21/100
- National rank
- #1755
- State rank
- #45 of 540 in MI
Livability — Lake Orion
- Score
- 80/100
- State rank
- #77
- US rank
- #1679
Category grades
Schools grade is shown separately in the Schools card above.
Census & demographics
- Census place
- Lake Orion, MI
- Population (ZIP)
- 14,746
Population outlook (Oakland County) Hauer SSP2
- Today (2025)
- 1,335,747 people
- By 2030
- 1,375,100 · +2.9%
- By 2040
- 1,435,385 · +7.5%
- By 2050
- 1,469,250 · +10.0%
- By 2075
- 1,531,946 · +14.7%
- By 2100
- 1,450,485 · +8.6%
Race, ethnicity, and origin ACS 2023
- Neighborhood character
- Predominantly White (88%)
- Race & ethnicity
- White 88% Two or more races 5% Hispanic / Latino 4% Black 2% Asian 2%
- Common ancestry
- Romanian 11% Lithuanian 5% Slovak 3%
- Foreign-born
- 6% · Canada, China, Dominican Republic
- Languages at home
- 95% English-only · Spanish 1% Chinese 1% German/W. Germanic 1%
Political lean MEDSL · Oakland
- 2024 margin
- D (+10.6) · D 54.4% · R 43.8% · Other 1.9%
- 2008→2024 swing
- -3.9pp toward R · 2008: 14.5pp · 2024: 10.6pp
- All cycles
- 2024: D+10.6 2020: D+14.1 2016: D+8.1 2012: D+8.1 2008: D+14.5
Not yet ingested
- Civics
- —
Market trends
- HPI YoY
- ▼ -307.96%
- Current HPI
- 182.3653
- Rent YoY
- —
- Metro
- —
- State GDP YoY
- ▲ 1.37%
- F500 in state
- 28
Industry mix (Fortune 500 HQ in MI)
| Industry | F500 HQs | Revenue |
|---|---|---|
| Automotive Parts | 3 | $48B |
|
||
| Automotive | 2 | $372B |
|
||
| Chemicals | 1 | $45B |
|
||
| Automotive Retail | 1 | $29B |
|
||
| Healthcare / Medical Devices | 1 | $23B |
|
||
| Automotive Technology | 1 | $20B |
|
||
Price history
+315.2% since first listed4 events — show timeline
- 2026-05-27 Listed $120,000 REALCOMP
- 2026-05-27 Listed $120,000 MiRealSource-MiMLS
- 2004-08-25 Sold (Public Records) $65,000 Public Records
- 1997-08-05 Sold (Public Records) $28,900 Public Records
Property tax history
+0.7%/yrLatest (2025): $3,184 · -18.0% YoY. Source: county tax records.
Cash-flow waterfall
monthlySold comps — $/sqft
last 12 mo · ≤1 miLoading sold comps…