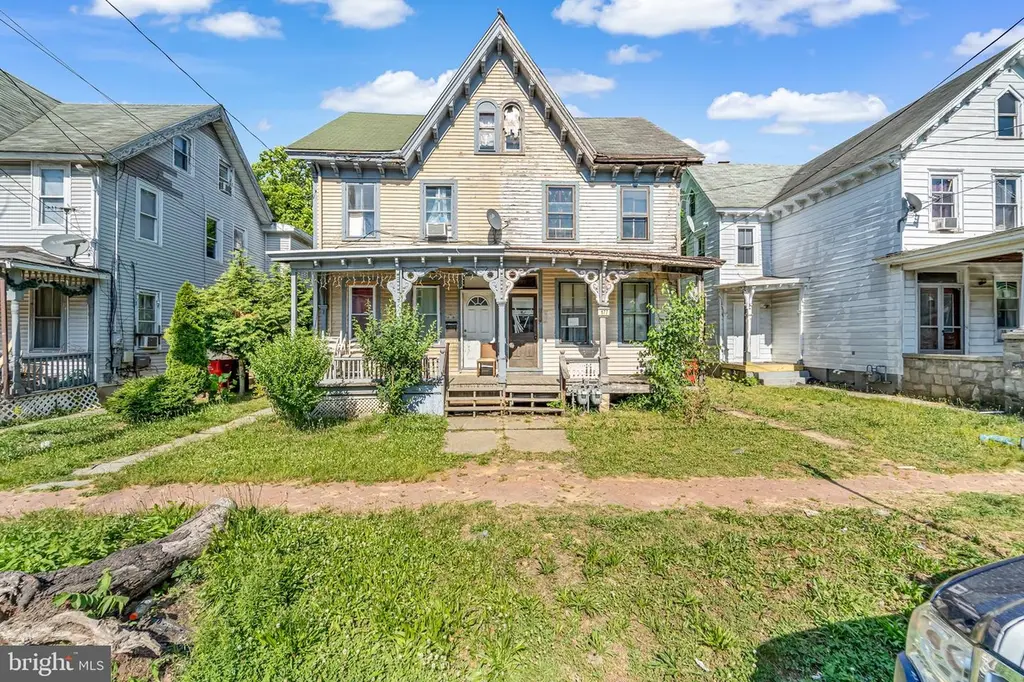
177 East Ave · Bridgeton, NJ
Flood risk 1/10 · Minimal
- FEMA flood zone
- X (unshaded)
- Chance of flooding over 30 yrs
- 0.0%
- Est. flood insurance / yr
- $507 – $1,088
Fire risk 4/10 · Minor
- Est. fire insurance / yr
- $526 – $976
Heat risk 7/10 · Major
- Hot days now (above 102°F)
- 7 days/yr
- Hot days in 30 yrs
- 15 days/yr
Wind risk 6/10 · Moderate
- Chance of severe wind over 30 yrs
- 67.0%
Air-quality risk 3/10 · Minor
- Unhealthy air days now
- 2 days/yr
- Unhealthy air days in 30 yrs
- 3 days/yr
Risk factors via First Street. Map © Google.
Why this score? — see what drove the B- grade
The composite is a weighted blend of 9 inputs, each scored 0–100. Each bar is that input's sub-score; the figure is the points it added to the 100-point composite (weight × sub-score).
- Cash flow +30.0/30.0
- 1% rule +10.0/10.0
- DSCR +10.0/10.0
- ARV discount +7.5/15.0
- Livability +3.6/5.0
- Rent growth +2.5/5.0
- Condition / age +2.5/5.0
- Schools +1.0/10.0
- Appreciation +0.0/10.0
$100,000
🖨 Deal sheet 📄 Offer letter ✓ Due diligence
Listing remarks MLS
Spacious duplex set up perfectly for a house-hacking opportunity or ready for a savvy investor to add to their portfolio! Unit B in the front is a 1BD/1BTH. Unit A can be accessed from the side & rear, offering 2 BD/1BTH on the second floor and a loft-style bedroom on the third. Strictly as-is sale, buyer is responsible for the CO. Seller obtained property via tax lien foreclosure. Seller makes no guarantees or warranties as to the condition or accuracy of the information provided. Seller has never seen nor been to property. Seller prefers to use Brennan Title to complete the transaction. Schedule your private tour TODAY!
Key facts
- 3,751 sq ft lot
- Built 1920
- Listed 8 days
Property features AI
Finance
- Financial info: Fee simple ownership
Exterior
- Parking: On-street parking
- Utilities: Public water; Public sewer; Natural gas service
- Home design: Detached structure; Wood siding construction; Above-grade living space reported
- Construction: Block foundation
- Exterior features: Lot dimensions approximately 25 x 150; No tidal water
Interior
- Bedrooms: One 1-bedroom unit; One 3-bedroom unit
- Heating & cooling: Radiator heat; Natural gas heat and hot water
- Interior features: Full basement
Neighborhood map
What this means for you Summary
Snapshot
- This is a 4-bed/?-bath single-family listed at $100k.
Deal economics
- At list price, monthly cash flow is $889 ($11k/yr) — positive.
- The deal already cash-flows at list — no discount required.
- Meets the 1% rule at list price ($2k rent vs $100k).
- Cap rate 17.0% vs local median 4.9% in Bridgeton — top-decile yield for the area; either an underpriced asset or a hidden risk that comps aren't pricing in. Stress-test before assuming the spread holds.
Location & tenants
- Location reads 71/100 on livability (#240 in NJ) — a middle-class / working-renter tenant base. Strengths: commute A+, health & safety A+, housing A-; Watch: employment D, schools F, crime F.
- Bridgeton City School District (town): math 4% / reading 21% proficiency, ranked #468 of 472 in NJ (top 99%) — low school quality limits family demand, transient renter base, plan for 1-2y turnover.
- Market conditions: 201 active listings in the ZIP; 216 units permitted in Cumberland County in 2024 (73 in 5+ unit buildings).
Forward outlook
- Local home prices are declining (-3.0%/yr); year-one equity from $691 of loan paydown is wiped out by about $3k of value loss. Plan a longer hold.
- Cumberland County population projected to shrink 7% by 2050 — rents likely to lag national; underwrite the cash flow, not the appreciation.
- At projected returns (-3.0% appreciation + 3.0% rent growth), your $28k cash investment doubles in ~4 years — after that, you're playing with house money.
Negotiation context
- Only 8 days on market — expect competitive offers; lowballing is unlikely to land.
- 2 sale attempts with the ask held roughly flat each time — persistent listings suggest the price (not the market) is what's stuck; bring a comps-based counter.
Risks & watch-outs
- Watch-outs: built in 1920 — expect roof / HVAC / electrical / plumbing capex.
- Climate carrying-cost: major wind risk, 67% chance of damaging wind over 30y; extreme-heat days projected 7→15/yr by 2055 (HVAC capex compounding) — expect insurance premiums to compound above CPI over the hold.
Questions for the listing agent
- Built in 1920 — when were the roof, HVAC, electrical panel, plumbing, and water heater last replaced?
- Is there a deadline driving the sale (1031 exchange, divorce, estate, relocation)? That informs how much negotiation room exists.
- Schools are F-rated, which usually means shorter tenancies and higher turnover. Who's the typical renter profile here, and what's been the actual vacancy rate?
- Crime grade is F in this area — have there been break-ins, vandalism, or insurance claims at this property in the last 3 years? What carrier currently insures it and at what premium?
- What's the average days-on-market for RENTAL listings here right now (not sales)? A rising rental-DOM trend means longer vacancies and softer asking-rent achievability than the comps imply.
- What's the recent tenant-quality profile in this submarket — average credit score on applications, eviction rate, late-payment / NSF rate, and stable-employment percentage? A property-management company in the area should have these aggregated.
- How much new for-sale + rental construction is in the pipeline within 1–3 miles? Heavy new supply typically softens prices + rents 12–24 months out; constrained supply supports both.
Investment metrics
- 1% rule
- 2.10% ✓
- Cap rate
- 16.96%
- Cash-on-cash
- 38.11%
- DSCR
- 2.70
- GRM
- 4.0
CMA / ARV
- ARV (on-the-fly)
- $291,505
- Comps found
- 4
Show comp detail 4 sales within ~0.75 mi
| Address | Dist | Beds/Ba | Sqft | Sold | Price | $/sf | Match |
|---|---|---|---|---|---|---|---|
| 26 N Elm St | 0.43mi | 3/1.0 (-1) | 1,640 (-3%) | 21mo | $165,000 | $101 | 49 |
| 16 Spring St | 0.62mi | 4/1.0 | 1,441 (-14%) | 4mo | $154,000 | $107 | 40 |
| 5 Twin Oaks Dr | 0.58mi | 3/2.5 (-1) | 1,766 (+5%) | 22mo | $305,000 | $173 | 32 |
| 20 Twin Oaks Dr | 0.66mi | 3/2.5 (-1) | 1,556 (-8%) | 23mo | $313,000 | $201 | 23 |
Match score weights: distance 35% · size 25% · config 20% · recency 20%. Top-matched comps best support the ARV.
Projected returns pro-forma
-3.0% appreciation · 3.0% rent growth · sell at horizon
- IRR
- 34.2%
- Equity multiple
- 2.45×
- Total profit
- $40,514
- Equity at exit
- $14,910
- IRR
- 41.1%
- Equity multiple
- 4.88×
- Total profit
- $108,529
- Equity at exit
- $8,646
Cash invested: $28,000 (down + closing). Projections, not guarantees.
Landlord ↔ Tenant lean methodology
- Overall (STATE)
- 21 Tenant-Leaning
- State New Jersey
- 21 Tenant-Leaning · D+6
- County
- — inherits STATE
- City
- — inherits STATE
ZIP-level market 08302
- Home prices YoY
- -24.0%
- Active inventory
- 201
- Price-to-rent
- 4.0×
Monthly cashflow live
- Estimated rent
- $2,096 medium interval (Pro) →
- Mortgage (P&I)
- −$524
- Tax from tax record
- −$201 /mo · $2,409/yr
- Insurance
- −$42
- HOA
- −$0
- Vacancy / Maint / Mgmt
- −$440
- Net cashflow
- $889
Break-even live
UW: 25.0% down · 7.5% · 30yr · 1.5% tax · 5.0% vac · 8.0% maint · 8.0% mgmt
Financing live
Cash to close
- Down payment
- $25,000
- Closing costs
- $3,000
- Reserves months
- —
- Total cash needed
- —
Loan-product check · same deal, 3 products live
Conventional
25% down · 7.5% · 30yr
- Down + closing
- —
- Monthly P&I
- —
- Monthly cashflow
- —
- DSCR
- —
- Eligible?
- —
Personal DTI + credit; lowest rate.
DSCR
20% down · 8.5% · 30yr
- Down + closing
- —
- Monthly P&I
- —
- Monthly cashflow
- —
- DSCR
- —
- Eligible?
- —
No personal income docs; deal must DSCR.
Hard money
10% down · 12.0% · 12mo
- Down + closing
- —
- Monthly P&I
- —
- Monthly cashflow
- —
- DSCR
- —
- Eligible?
- —
Short-term bridge; refi at stabilization.
Listing history 8 events
-
2026-06-17status $100,000 Pending 8 DOM
-
2026-06-17days on market $100,000 Active 8 DOM
-
2026-06-16days on market $100,000 Active 7 DOM
-
2026-06-15days on market $100,000 Active 6 DOM
-
2026-06-13days on market $100,000 Active 4 DOM
-
2026-06-12days on market $100,000 Active 3 DOM
-
2026-06-09remarks 631-char remark
Show marketing remark (635 chars)
Spacious duplex set up perfectly for a house-hacking opportunity or ready for a savvy investor to add to their portfolio! Unit B in the front is a 1BD/1BTH. Unit A can be accessed from the side & rear, offering 2 BD/1BTH on the second floor and a loft-style bedroom on the third. Strictly as-is sale, buyer is responsible for the CO. Seller obtained property via tax lien foreclosure. Seller makes no guarantees or warranties as to the condition or accuracy of the information provided. Seller has never seen nor been to property. Seller prefers to use Brennan Title to complete the transaction. Schedule your private tour TODAY!
-
2026-06-09$100,000 Active 1 DOM
Show marketing remark (635 chars)
Spacious duplex set up perfectly for a house-hacking opportunity or ready for a savvy investor to add to their portfolio! Unit B in the front is a 1BD/1BTH. Unit A can be accessed from the side & rear, offering 2 BD/1BTH on the second floor and a loft-style bedroom on the third. Strictly as-is sale, buyer is responsible for the CO. Seller obtained property via tax lien foreclosure. Seller makes no guarantees or warranties as to the condition or accuracy of the information provided. Seller has never seen nor been to property. Seller prefers to use Brennan Title to complete the transaction. Schedule your private tour TODAY!
ⓘ Source: listings_history table (triggers on properties + properties_extension) + one-shot
backfill from property_details.listing_events for pre-trigger history.
Tax reassessment forecast NJ · Partial reset (capped growth)
- Current annual tax
- $2,409 · $201/mo
- Projected year-2 tax
- $2,449 · $204/mo
- Expected delta
- +$41/yr (+$3/mo · 1.7%)
ⓘ Screening estimate from a state-policy table — verify with the county assessor before closing.
Climate risk First Street
- Flood 1/10 Low FEMA zone X (unshaded) · 0% chance over 30 yrs
- Wildfire 4/10 Moderate
- Heat 7/10 Severe 7 d/yr ≥102°F today · 15 d/yr by 30 yrs out
- Wind 6/10 Major 67% chance of damaging wind over 30 yrs
- Air quality 3/10 Moderate 2 unhealthy d/yr today · 3 by 30 yrs out
Nearby sold comps map
Loading sold comps map…
Walkable amenities ~0.75 mi
Loading nearby amenities…
Taxation est. · year 1
- Rental income
- $25,156
- − Mortgage interest
- −$5,602
- − Property taxes
- −$2,409
- − Insurance
- −$500
- − Repairs & maintenance
- −$2,012
- − Management
- −$2,012
- − Depreciation
- −$2,909
- Taxable income
- $9,712
- Est. tax owed @ 24.0%
- −$2,331
- After-tax cash flow
- $8,341/yr
For passive investors: Depreciation is non-cash, so a rental often shows a tax loss while cash-flowing — sheltering income. Rental losses are passive: they offset passive income freely, and up to $25,000/yr can offset ordinary (W-2) income if you actively participate and your MAGI is under $100k (phasing out to $0 by $150k); unused losses carry forward. On sale, claimed depreciation is recaptured at up to 25%, and gains may owe capital-gains tax (a 1031 exchange can defer both). Figures are a year-1 estimate at your 24.0% rate — not tax advice; consult a CPA.
Schools (NCES district)
- District
- Bridgeton City School District
- NCES district ID
- 3402250
- Math proficiency
- 4% ▼ -8.00%
- Reading proficiency
- 21% ▲ 3.00%
- Median HH income
- $34,542
- Composite
- 10.15/100
- National rank
- #9797
- State rank
- #468 of 472 in NJ
Livability — Bridgeton
- Score
- 71/100
- State rank
- #240
- US rank
- #6660
Category grades
Schools grade is shown separately in the Schools card above.
Census & demographics
- Census place
- Bridgeton, NJ
- Population (ZIP)
- 47,003
Population outlook (Cumberland County) Hauer SSP2
- Today (2025)
- 152,743 people
- By 2030
- 150,373 · -1.6%
- By 2040
- 146,881 · -3.8%
- By 2050
- 142,653 · -6.6%
- By 2075
- 129,468 · -15.2%
- By 2100
- 107,456 · -29.6%
Race, ethnicity, and origin ACS 2023
- Neighborhood character
- Diverse neighborhood (Simpson 0.69)
- Race & ethnicity
- Hispanic / Latino 39% White 30% Black 25% Two or more races 19% Native American 2% Asian 1%
- Hispanic origin (detail)
- Mexican 25% Puerto Rican 8% Dominican 2%
- Common ancestry
- Romanian 2%
- Foreign-born
- 17% · Canada, Jamaica
- Languages at home
- 64% English-only · Spanish 34% Other Indo-European 1%
Political lean MEDSL · Cumberland
- 2024 margin
- Toss-up / Even · D 47.6% · R 51.3% · Other 1.1%
- 2008→2024 swing
- -25.4pp toward R · 2008: 21.6pp · 2024: -3.8pp
- All cycles
- 2024: R+3.8 2020: D+6.0 2016: D+5.3 2012: D+23.1 2008: D+21.6
Not yet ingested
- Civics
- —
Market trends
- HPI YoY
- ▼ -91.94%
- Current HPI
- 290.6461
- Rent YoY
- —
- Metro
- —
- State GDP YoY
- ▲ 2.05%
- F500 in state
- 34
Industry mix (Fortune 500 HQ in NJ)
| Industry | F500 HQs | Revenue |
|---|---|---|
| Consumer Goods | 3 | $31B |
|
||
| Pharmaceuticals | 2 | $153B |
|
||
| Technology | 2 | $21B |
|
||
| Insurance | 2 | $20B |
|
||
| Healthcare | 2 | $19B |
|
||
| Financial Services | 1 | $70B |
|
||
Price history
+0.0% since first listed2 events — show timeline
- 2026-06-09 Listed $100,000 SJSRMLS
- 2026-06-09 Listed $100,000 BRIGHT MLS
Property tax history
+0.8%/yrLatest (2025): $2,409 · +9.5% YoY. Source: county tax records.
Cash-flow waterfall
monthlySold comps — $/sqft
last 12 mo · ≤1 miLoading sold comps…