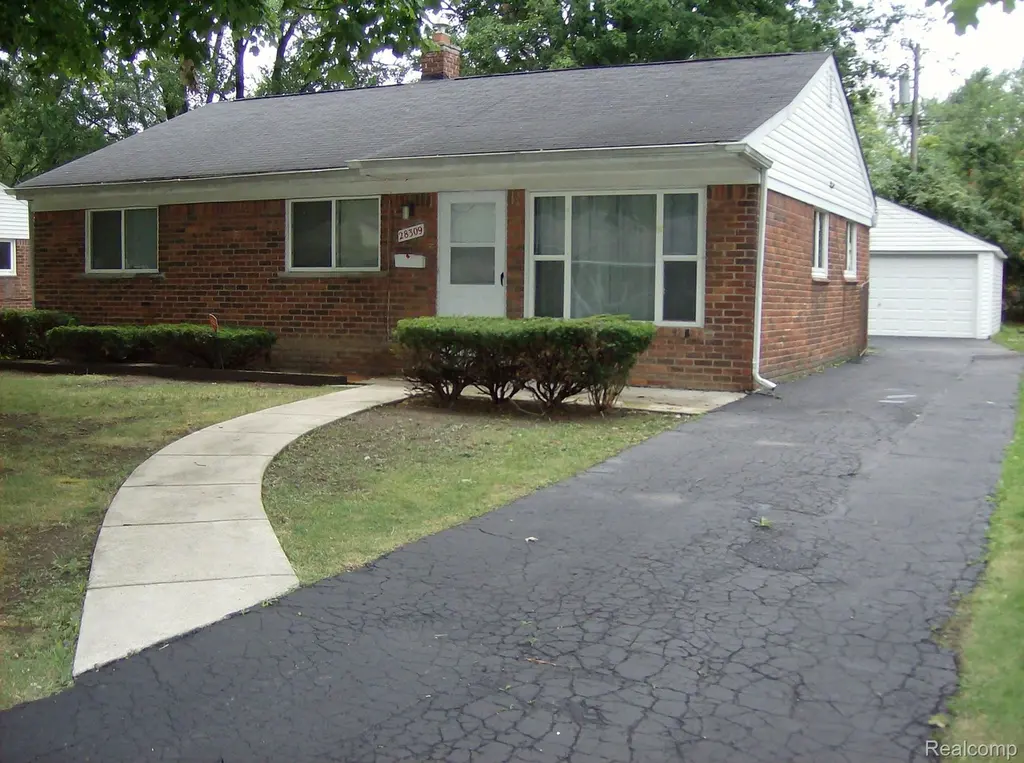
28309 Aberdeen St · Southfield, MI
Flood risk 1/10 · Minimal
- FEMA flood zone
- X (unshaded)
- Chance of flooding over 30 yrs
- 0.0%
- Est. flood insurance / yr
- $507 – $1,088
Fire risk 1/10 · Minimal
- Est. fire insurance / yr
- $784 – $1,456
Heat risk 2/10 · Minimal
- Hot days now (above 97°F)
- 7 days/yr
- Hot days in 30 yrs
- 15 days/yr
Wind risk 2/10 · Minimal
- Chance of severe wind over 30 yrs
- —
Air-quality risk 4/10 · Minor
- Unhealthy air days now
- 3 days/yr
- Unhealthy air days in 30 yrs
- 6 days/yr
Risk factors via First Street. Map © Google.
Why this score? — see what drove the C- grade
The composite is a weighted blend of 9 inputs, each scored 0–100. Each bar is that input's sub-score; the figure is the points it added to the 100-point composite (weight × sub-score).
- Cash flow +15.7/30.0
- ARV discount +13.6/15.0
- 1% rule +5.1/10.0
- DSCR +4.8/10.0
- Rent growth +3.7/5.0
- Livability +3.6/5.0
- Condition / age +2.5/5.0
- Schools +2.4/10.0
- Appreciation +0.0/10.0
$179,000
🖨 Deal sheet 📄 Offer letter ✓ Due diligence
Listing remarks MLS
Come and see this MOVE-IN ready Newly redecorated 3-Bedroom ranch in the Heart of Southfield Michigan. Excellent location near freeways, a beautiful park on 12-mile rd. , shopping, Southfield Public Schools, and so much more. This residential home sits on a large lot with a huge fenced in backyard and a 2- car detached garage featuring an enclosed patio at back of property for entertaining family & friends. New Carpeting throughout the home as well as a fresh coat of paint. This home comes equipped with a Fridge, Washer and Dryer. Come and take a peek this one won't last long!
Key facts
- 9,148 sq ft lot
- 2 garage spots
- Built 1956
Property features AI
Exterior
- Parking: Detached 2-car garage
- Utilities: Public water; Public sewer
- Home design: Single-family residence; One story; Ground-level entry
- Construction: Brick construction; Slab foundation; Home warranty included
- Exterior features: Back yard fencing; Paved road access
Interior
- Kitchen: Free-standing refrigerator; Ice maker; Disposal
- Bedrooms: 6 total rooms (bedroom count not specified)
- Bathrooms: 1 full bathroom
- Heating & cooling: Forced air heating; Natural gas heating; No cooling
- Interior features: Disposal; Humidifier; Ice maker
- Laundry & utility: Washer; Dryer
Neighborhood map
What this means for you Summary
Snapshot
- This is a 3-bed/1.0-bath single-family listed at $179k.
Deal economics
- At list price, monthly cash flow is $78 ($935/yr) — positive.
- The deal already cash-flows at list — no discount required.
- Meets the 1% rule at list price ($2k rent vs $179k).
- Recommended offer: $176k (1.5% below list) — sets the bar for market timing.
- Cap rate 6.8% vs local median 4.4% in Southfield — top-decile yield for the area; either an underpriced asset or a hidden risk that comps aren't pricing in. Stress-test before assuming the spread holds.
Location & tenants
- Location reads 72/100 on livability (#248 in MI) — a middle-class / working-renter tenant base. Strengths: commute A+, cost of living A+, housing A+; Watch: schools D, health & safety D, crime F.
- Southfield Public School District (urban): math 17% / reading 37% proficiency, ranked #392 of 540 in MI (top 73%) — low school quality limits family demand, transient renter base, plan for 1-2y turnover.
- Market conditions: Rents rising fast (+4.8%/yr); 93 active listings in the ZIP; 26 comparable units currently listed for rent nearby; rentals at typical pace (median 17d on market — plan ~3-4 weeks tenant-placement turnaround); solid renter incomes; 2,614 units permitted in Oakland County in 2024 (721 in 5+ unit buildings).
Forward outlook
- Local home prices are declining (-3.0%/yr); year-one equity from $1k of loan paydown is wiped out by about $5k of value loss. Plan a longer hold.
- Oakland County population projected at +10% by 2050 — modest demand growth; plan on rents tracking national, not racing it.
Negotiation context
- It's been on market 24 days — a 2% lower offer ($176k) is reasonable based on typical stale-listing flexibility.
- 9 sale attempts since 14y ago with the ask held roughly flat each time — persistent listings suggest the price (not the market) is what's stuck; bring a comps-based counter.
Risks & watch-outs
- Watch-outs: built in 1956 — expect roof / HVAC / electrical / plumbing capex.
Questions for the listing agent
- Built in 1956 — when were the roof, HVAC, electrical panel, plumbing, and water heater last replaced?
- Is there a deadline driving the sale (1031 exchange, divorce, estate, relocation)? That informs how much negotiation room exists.
- Schools are D-rated, which usually means shorter tenancies and higher turnover. Who's the typical renter profile here, and what's been the actual vacancy rate?
- Crime grade is F in this area — have there been break-ins, vandalism, or insurance claims at this property in the last 3 years? What carrier currently insures it and at what premium?
- What's the average days-on-market for RENTAL listings here right now (not sales)? A rising rental-DOM trend means longer vacancies and softer asking-rent achievability than the comps imply.
- What's the recent tenant-quality profile in this submarket — average credit score on applications, eviction rate, late-payment / NSF rate, and stable-employment percentage? A property-management company in the area should have these aggregated.
- How much new for-sale + rental construction is in the pipeline within 1–3 miles? Heavy new supply typically softens prices + rents 12–24 months out; constrained supply supports both.
Investment metrics
- 1% rule
- 1.01% ✓
- Cap rate
- 6.82%
- Cash-on-cash
- 1.86%
- DSCR
- 1.08
- GRM
- 8.2
CMA / ARV
- ARV (median comp)
- $206,979
- List price
- $179,000
- Delta
- -13.52%
- Verdict
- UNDERPRICED
- Comps
- 20 within 1.0 mi
Show comp detail 12 sales within ~0.75 mi
| Address | Dist | Beds/Ba | Sqft | Sold | Price | $/sf | Match |
|---|---|---|---|---|---|---|---|
| 28426 Sutherland St | 0.06mi | 3/1.0 | 1,036 (0%) | 4mo | $169,000 | $163 | 93 |
| 28464 Stuart Ave | 0.24mi | 3/1.0 | 1,036 (0%) | 4mo | $210,000 | $203 | 85 |
| 28110 Marshall St | 0.26mi | 3/1.0 | 1,056 (+2%) | 2mo | $181,000 | $171 | 83 |
| 28578 Marshall St | 0.32mi | 3/1.5 | 1,056 (+2%) | 2mo | $207,500 | $196 | 78 |
| 3012 Greenfield Rd | 0.39mi | 3/1.0 | 1,065 (+3%) | 0mo | $245,000 | $230 | 77 |
| 28055 Aberdeen St | 0.12mi | 3/1.0 | 1,144 (+10%) | 2mo | $235,000 | $205 | 76 |
| 28060 Aberdeen St | 0.11mi | 3/1.0 | 1,144 (+10%) | 7mo | $170,000 | $149 | 72 |
| 2690 Ellwood Ave | 0.44mi | 3/1.0 | 998 (-4%) | 2mo | $175,000 | $175 | 71 |
| 3659 Ellwood Ave | 0.63mi | 3/1.0 | 1,025 (-1%) | 2mo | $280,000 | $273 | 67 |
| 1845 Thomas Ave | 0.74mi | 3/1.0 | 1,022 (-1%) | 8mo | $265,000 | $259 | 57 |
| 16940 W 11 Mile Rd | 0.67mi | 2/1.5 (-1) | 1,080 (+4%) | 2mo | $116,000 | $107 | 53 |
| 3626 Prairie Ave | 0.75mi | 2/2.0 (-1) | 976 (-6%) | 2mo | $279,900 | $287 | 45 |
Match score weights: distance 35% · size 25% · config 20% · recency 20%. Top-matched comps best support the ARV.
Projected returns pro-forma
-3.0% appreciation · 4.84% rent growth · sell at horizon
- IRR
- -11.1%
- Equity multiple
- 0.59×
- Total profit
- $-20,531
- Equity at exit
- $26,689
- IRR
- 0.9%
- Equity multiple
- 1.07×
- Total profit
- $3,459
- Equity at exit
- $15,477
Cash invested: $50,120 (down + closing). Projections, not guarantees.
Landlord ↔ Tenant lean methodology
- Overall (STATE)
- 62 Landlord-Friendly
- State Michigan
- 62 Landlord-Friendly · EVEN
- County
- — inherits STATE
- City
- — inherits STATE
ZIP-level market 48076
- Rents YoY
- 4.8%
- Active inventory
- 93
- Price-to-rent
- 8.2×
Monthly cashflow live
- Estimated rent
- $1,811 high interval (Pro) →
- Mortgage (P&I)
- −$939
- Tax from tax record
- −$340 /mo · $4,077/yr
- Insurance
- −$75
- HOA
- −$0
- Vacancy / Maint / Mgmt
- −$380
- Net cashflow
- $78
Break-even live
UW: 25.0% down · 7.5% · 30yr · 1.5% tax · 5.0% vac · 8.0% maint · 8.0% mgmt
Financing live
Cash to close
- Down payment
- $44,750
- Closing costs
- $5,370
- Reserves months
- —
- Total cash needed
- —
Loan-product check · same deal, 3 products live
Conventional
25% down · 7.5% · 30yr
- Down + closing
- —
- Monthly P&I
- —
- Monthly cashflow
- —
- DSCR
- —
- Eligible?
- —
Personal DTI + credit; lowest rate.
DSCR
20% down · 8.5% · 30yr
- Down + closing
- —
- Monthly P&I
- —
- Monthly cashflow
- —
- DSCR
- —
- Eligible?
- —
No personal income docs; deal must DSCR.
Hard money
10% down · 12.0% · 12mo
- Down + closing
- —
- Monthly P&I
- —
- Monthly cashflow
- —
- DSCR
- —
- Eligible?
- —
Short-term bridge; refi at stabilization.
Rent comps 26 comps
| Address | Beds | Baths | Sqft | Rent | $/sqft | DOM | Units | Dist |
|---|---|---|---|---|---|---|---|---|
| 28291 Pierce St Southfield, MI | 2.0 | 1.0 | 1332 | $1,580 | $1.19 | 24d | 1 | 0.12mi |
| 28051 Stuart Ave Southfield, MI | 3.0 | 1.5 | 1441 | $2,000 | $1.39 | 16d | 1 | 0.27mi |
| 28124 Brentwood St Southfield, MI | 3.0 | 1.0 | 1056 | $1,800 | $1.70 | 24d | 1 | 0.32mi |
| 27435 Greenfield Rd Southfield, MI | 2.0 | 2.0 | 1200 | $1,399 | $1.17 | 5d | 1 | 0.51mi |
| 3644 Greenfield Rd Unit 3664 Greenfield Berkley, MI | 2.0 | 1.5 | 950 | $1,700 | $1.79 | 17d | 1 | 0.60mi |
| 17440 W Eleven Mile Rd Lathrup Village, MI | 2.0 | 2.5 | 1264 | $1,949 | $1.54 | 5d | 1 | 0.76mi |
| 15833 W Eleven Mile Rd Southfield, MI | 1.0–2.0 | 1.0 | 905 | $1,424 | $1.57 | 1d | 6 | 0.79mi |
| 29890 Everett St Southfield, MI | 3.0 | 1.5 | 1100 | $2,200 | $2.00 | 43d | 1 | 0.83mi |
| 18248 W 12 Mile Rd Southfield, MI | 1.0–2.0 | 1.0–2.0 | 902 | $2,254 | $2.50 | 1d | 1 | 0.85mi |
| 3185 Buckingham Ave Berkley, MI | 3.0 | 1.0 | 1091 | $1,895 | $1.74 | 24d | 1 | 0.85mi |
| 3936 Royal Ave Berkley, MI | 3.0 | 2.0 | 900 | $2,000 | $2.22 | 43d | 1 | 1.03mi |
| 30256 Southfield Rd Southfield, MI | 3.0 | 2.0 | 1227 | $1,662 | $1.35 | 5d | 2 | 1.06mi |
| 30256 Southfield Rd Southfield, MI | 3.0 | 2.0 | 1238 | $1,675 | $1.35 | 24d | 1 | 1.06mi |
| 30276 Southfield Rd Unit 215 Southfield, MI | 2.0 | 2.0 | 956 | $1,399 | $1.46 | 19d | 1 | 1.13mi |
| 30268 Southfield Rd #230 Southfield, MI | 2.0 | 2.0 | 956 | $1,450 | $1.52 | 43d | 1 | 1.18mi |
| 18333 South Dr Southfield, MI | 1.0–2.0 | 1.0–2.0 | 1044 | $1,875 | $1.80 | 1d | 6 | 1.23mi |
| 2575 Catalpa Dr Unit 2575-06 Berkley, MI | 2.0 | 2.0 | 1100 | $1,695 | $1.54 | 24d | 1 | 1.31mi |
| 2575 Catalpa Dr Unit 2575-16 Berkley, MI | 2.0 | 1.0 | 1100 | $1,495 | $1.36 | 24d | 1 | 1.31mi |
| 2639 Oxford Rd Berkley, MI | 2.0 | 1.0 | 1010 | $2,495 | $2.47 | 1d | 1 | 1.32mi |
| 15075 Lincoln St Oak Park, MI | 2.0 | 1.0–2.0 | 746 | $1,240 | $1.66 | 3d | 1 | 1.37mi |
| 14801 Lincoln St Oak Park, MI | 2.0 | 1.0–1.5 | 990 | $1,240 | $1.25 | 3d | 1 | 1.39mi |
| 4120 W 13 Mile Rd Royal Oak, MI | 1.0–2.0 | 1.0 | 775 | $1,300 | $1.68 | 1d | 5 | 1.45mi |
| 2330 Wiltshire Rd Berkley, MI | 3.0 | 1.0 | 1254 | $2,400 | $1.91 | 2d | 1 | 1.45mi |
| 18335 W 13 Mile Rd Southfield, MI | 2.0 | 2.0 | 825 | $1,858 | $2.25 | 1d | 9 | 1.46mi |
| 25600 Briar Dr Oak Park, MI | 2.0–3.0 | 1.5 | 1235 | $1,935 | $1.57 | 23d | 7 | 1.47mi |
| 25500 Greenfield Rd Oak Park, MI | 2.0 | 1.0 | 637 | $1,310 | $2.05 | 1d | 12 | 1.48mi |
Listing history 21 events
-
2026-04-25$179,000 Active 589-char remark
Show marketing remark (589 chars)
Come and see this MOVE-IN ready Newly redecorated 3-Bedroom ranch in the Heart of Southfield Michigan. Excellent location near freeways, a beautiful park on 12-mile rd. , shopping, Southfield Public Schools, and so much more. This residential home sits on a large lot with a huge fenced in backyard and a 2- car detached garage featuring an enclosed patio at back of property for entertaining family & friends. New Carpeting throughout the home as well as a fresh coat of paint. This home comes equipped with a Fridge, Washer and Dryer. Come and take a peek this one won't last long!
-
2022-08-15historical
-
2022-08-15historical
-
2022-08-12price $180,000
-
2022-08-12price $180,000
-
2022-07-24$190,000 Active
-
2022-07-24$190,000 Active
-
2018-05-14soldstatus $97,000
-
2014-10-10soldstatus $1,050
-
2014-10-02$1,000
-
2014-09-04soldstatus $1,000
-
2014-08-22$1,000
-
2014-03-30historical
-
2013-03-29$1,095
-
2013-02-25soldstatus $47,500
-
2013-02-25soldstatus $47,500
-
2013-01-24historical
-
2013-01-24historical
-
2012-12-14$45,000
-
2012-12-14$45,000
ⓘ Source: listings_history table (triggers on properties + properties_extension) + one-shot
backfill from property_details.listing_events for pre-trigger history.
Tax reassessment forecast MI · Partial reset (capped growth)
- Current annual tax
- $4,077 · $340/mo
- Projected year-2 tax
- $4,077 · $340/mo
- Expected delta
- $0/yr ($0/mo · 0.0%)
ⓘ Screening estimate from a state-policy table — verify with the county assessor before closing.
Climate risk First Street
- Flood 1/10 Low FEMA zone X (unshaded) · 0% chance over 30 yrs
- Wildfire 1/10 Low
- Heat 2/10 Low 7 d/yr ≥97°F today · 15 d/yr by 30 yrs out
- Wind 2/10 Low
- Air quality 4/10 Moderate 3 unhealthy d/yr today · 6 by 30 yrs out
Nearby sold comps map
Loading sold comps map…
Walkable amenities ~0.75 mi
Loading nearby amenities…
Taxation est. · year 1
- Rental income
- $21,735
- − Mortgage interest
- −$10,027
- − Property taxes
- −$4,077
- − Insurance
- −$895
- − Repairs & maintenance
- −$1,739
- − Management
- −$1,739
- − Depreciation
- −$5,207
- Taxable loss
- −$1,948
- Est. tax savings @ 24.0%
- +$468
- After-tax cash flow
- $1,402/yr
For passive investors: Depreciation is non-cash, so a rental often shows a tax loss while cash-flowing — sheltering income. Rental losses are passive: they offset passive income freely, and up to $25,000/yr can offset ordinary (W-2) income if you actively participate and your MAGI is under $100k (phasing out to $0 by $150k); unused losses carry forward. On sale, claimed depreciation is recaptured at up to 25%, and gains may owe capital-gains tax (a 1031 exchange can defer both). Figures are a year-1 estimate at your 24.0% rate — not tax advice; consult a CPA.
Schools (NCES district)
- District
- Southfield Public School District
- NCES district ID
- 2632310
- Math proficiency
- 17% ▼ -3.00%
- Reading proficiency
- 37% ▲ 1.00%
- Median HH income
- $51,400
- Composite
- 23.77/100
- National rank
- #7814
- State rank
- #392 of 540 in MI
Livability — Southfield
- Score
- 72/100
- State rank
- #248
- US rank
- #6175
Category grades
Schools grade is shown separately in the Schools card above.
Census & demographics
- Census place
- Southfield, MI
- County
- Oakland County · 1,009,092 people
- City population
- 54,914
- Metro
- Detroit-Warren-Dearborn, MI
- Population (ZIP)
- 25,405
- Household income
- $90,058
- Rent vs Own
- Severe rent burden
- 607.0
Population outlook (Oakland County) Hauer SSP2
- Today (2025)
- 1,335,747 people
- By 2030
- 1,375,100 · +2.9%
- By 2040
- 1,435,385 · +7.5%
- By 2050
- 1,469,250 · +10.0%
- By 2075
- 1,531,946 · +14.7%
- By 2100
- 1,450,485 · +8.6%
Race, ethnicity, and origin ACS 2023
- Neighborhood character
- Diverse neighborhood (Simpson 0.57)
- Race & ethnicity
- Black 57% White 32% Two or more races 7% Hispanic / Latino 3% Asian 2%
- Common ancestry
- Romanian 3% Slovak 1% Scotch-Irish 1%
- Foreign-born
- 8% · Canada, Vietnam
- Languages at home
- 90% English-only · Spanish 3% Arabic 2% Russian/Polish/Slavic 1%
Political lean MEDSL · Oakland
- 2024 margin
- D (+10.6) · D 54.4% · R 43.8% · Other 1.9%
- 2008→2024 swing
- -3.9pp toward R · 2008: 14.5pp · 2024: 10.6pp
- All cycles
- 2024: D+10.6 2020: D+14.1 2016: D+8.1 2012: D+8.1 2008: D+14.5
Not yet ingested
- Civics
- —
Market trends
- HPI YoY
- ▼ -192.13%
- Current HPI
- 229.2304
- Rent YoY
- ▲ 4.84%
- Metro
- Detroit-Warren-Dearborn, MI
- State GDP YoY
- ▲ 1.37%
- F500 in state
- 28
Industry mix (Fortune 500 HQ in MI)
| Industry | F500 HQs | Revenue |
|---|---|---|
| Automotive Parts | 3 | $48B |
|
||
| Automotive | 2 | $372B |
|
||
| Chemicals | 1 | $45B |
|
||
| Automotive Retail | 1 | $29B |
|
||
| Healthcare / Medical Devices | 1 | $23B |
|
||
| Automotive Technology | 1 | $20B |
|
||
Price history
+306.7% since first listed25 events — show timeline
- 2026-05-29 Sold (MLS) $183,000 REALCOMP
- 2026-05-29 Sold (MLS) $183,000 MiRealSource-MiMLS
- 2026-05-19 Pending — MiRealSource-MiMLS
- 2026-05-19 Pending — REALCOMP
- 2026-04-25 Listed $179,000 REALCOMP
- 2026-04-25 Listed $179,000 MiRealSource-MiMLS
- 2022-08-15 Listing Removed — REALCOMP
- 2022-08-15 Listing Removed — MiRealSource-MiMLS
- 2022-08-12 Price Changed $180,000 MiRealSource-MiMLS
- 2022-08-12 Price Changed $180,000 REALCOMP
- 2022-07-24 Listed $190,000 MiRealSource-MiMLS
- 2022-07-24 Listed $190,000 REALCOMP
- 2018-05-14 Sold (Public Records) $97,000 Public Records
- 2014-10-10 Sold (MLS) $1,050 MiRealSource-MiMLS
- 2014-10-02 Listed $1,000 MiRealSource-MiMLS
- 2014-09-04 Sold (MLS) $1,000 MiRealSource-MiMLS
- 2014-08-22 Listed $1,000 MiRealSource-MiMLS
- 2014-03-30 Listing Removed — MiRealSource-MiMLS
- 2013-03-29 Listed $1,095 MiRealSource-MiMLS
- 2013-02-25 Sold (MLS) $47,500 MiRealSource-MiMLS
- 2013-02-25 Sold (MLS) $47,500 REALCOMP
- 2013-01-24 Listing Removed — MiRealSource-MiMLS
- 2013-01-24 Listing Removed — REALCOMP
- 2012-12-14 Listed $45,000 MiRealSource-MiMLS
- 2012-12-14 Listed $45,000 REALCOMP
Property tax history
+7.1%/yrLatest (2025): $4,077 · +3.1% YoY. Source: county tax records.
Cash-flow waterfall
monthlySold comps — $/sqft
last 12 mo · ≤1 miLoading sold comps…